question

er-minio avatar image
er-minio asked

Globallink 520 data: is it an average?

I looked in the manual but it doesn't specify.

The data that the Globallink uploads to the VRM portal every 15 minutes: is it an average of the 15 minutes span or is it the live that of the moment it uploads?

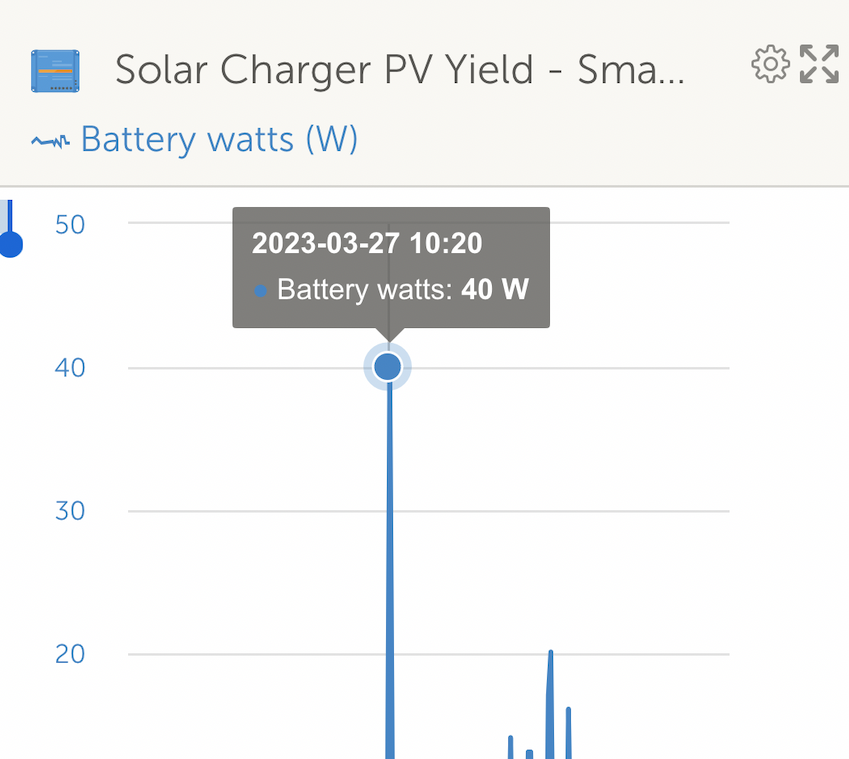
I've been replacing some cables on my system yesterday and added some loads, could see the MPPT and SmartShunt values updating several times per second in the VictronConnect app (scattered clouds on a windy day) with Wattage from the panel oscillating from 25W to peaks 110W multiple times over a span of a few minutes.

When I checked in the VRM portal later in the day, for that approximate time the PV Yel from the panel indicates 47W.

How is that calculated or averaged?
Or am I interpreting the data wrongly?


Thanks!

VRMSmartShuntVictronConnectsmart solar set-up helpgloballink
2 |3000

Up to 8 attachments (including images) can be used with a maximum of 190.8 MiB each and 286.6 MiB total.

7 Answers
jolir avatar image
jolir answered ·

PV “Yield” is measured in KWh (kilowatt hours) and is a measure of cumulative energy (power x time) supplied by the panels. This is what you are charged for at home, where 1KWh is often referred to as 1 “unit”.

Watts is a measure of instantaneous power supplied by the panels.

So, if in VRM, what is listed is Watts, then the GL520 is giving its instantaneous reading which it read at the last 15 minute poll.

If VRM is reporting KW hours then that is a total cumulative reading so far that day.

2 |3000

Up to 8 attachments (including images) can be used with a maximum of 190.8 MiB each and 286.6 MiB total.

er-minio avatar image
er-minio answered ·

Hi Jolir, thanks, yes I was referring to what is on the chart (should have added a screenshot) that is, indeed, indicated in W, not KWh.

screenshot-2023-04-13-at-094058.png

So, as you say, that is an instantaneous reading. Thanks!


It would be nice to be able to access peak data per day, as you can do when connecting directly to the MPPT via VictronConnect.


2 |3000

Up to 8 attachments (including images) can be used with a maximum of 190.8 MiB each and 286.6 MiB total.

jolir avatar image
jolir answered ·

You do get peak data, but it’s whatever the peak was at the precise 15 minute interval. If the GL520 were to poll every 30 seconds, say, that would immediately increase the GL520’s data usage by a factor of 30 times.

Then, I doubt we’d get 5 years of free data included in the price?

2 |3000

Up to 8 attachments (including images) can be used with a maximum of 190.8 MiB each and 286.6 MiB total.

er-minio avatar image
er-minio answered ·

No, what I mean is that in the Victron App you can see the maximum Wattage for the day the panel reached, and same (voltage) for the battery.

It is just 2 single data points per day.


screenshot-2023-04-13-at-164742.png


Would be nice if these could be somehow sent over by the Globallink, say on the last polling before midnight each day. Doesn't add anything, but a few bytes to the transmission.
But, again, not a critical feature of course.


2 |3000

Up to 8 attachments (including images) can be used with a maximum of 190.8 MiB each and 286.6 MiB total.

westen avatar image
westen answered ·

Interesting thought. I would like to have that feature very much.

2 |3000

Up to 8 attachments (including images) can be used with a maximum of 190.8 MiB each and 286.6 MiB total.

jolir avatar image
jolir answered ·

The peak figure for volts or watts is not actually that useful in the VE.connect App, because it doesn’t state for how long that figure was attained. That is to say, to use your display as an example, was that figure of 15W peak achieved for 1 second or 1 minute or 1 hour etc?

The only really useful figure is not that of Power but, rather, that of Energy, viz: Power x Time; 30Wh in your illustration. This gives an indication of by how much your “bucket of energy” (ie: your battery) has been refilled.

2 |3000

Up to 8 attachments (including images) can be used with a maximum of 190.8 MiB each and 286.6 MiB total.

er-minio avatar image
er-minio answered ·

For some users it could be interesting to see what the peak could be (in perfect conditions, even for a split of a second, etc.).

In reality the Battery Watts instantaneous reading we discussed in the first picture would be fairly useless as well, as that is the reading at the time of polling and, equally, we don't know for how long.

I agree completely with you that the yeld in Watt Hours is the figure most users want to look at (and the most telling of the state of the system), but if panel Wattage data is provided at this stage, including the peaks could be a nice addition.

Anyway, a "nice to have" (non essential) feature in the roadmap I'd say. :)


But in general, regarding "peak" reading, that's exactly why I was asking if the W value was an average of the 15 minutes span. But, yes, just looking at the collected Wh makes more sense.

I think it is a bit my little obsession of seeing how much my panel can reach W-wise.

2 |3000

Up to 8 attachments (including images) can be used with a maximum of 190.8 MiB each and 286.6 MiB total.

Related Resources