question

kaarthik avatar image
kaarthik asked

Why don't VRM dashboard consumption and production figures add up?

Dear all,

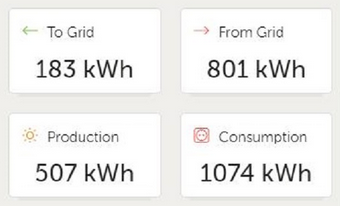
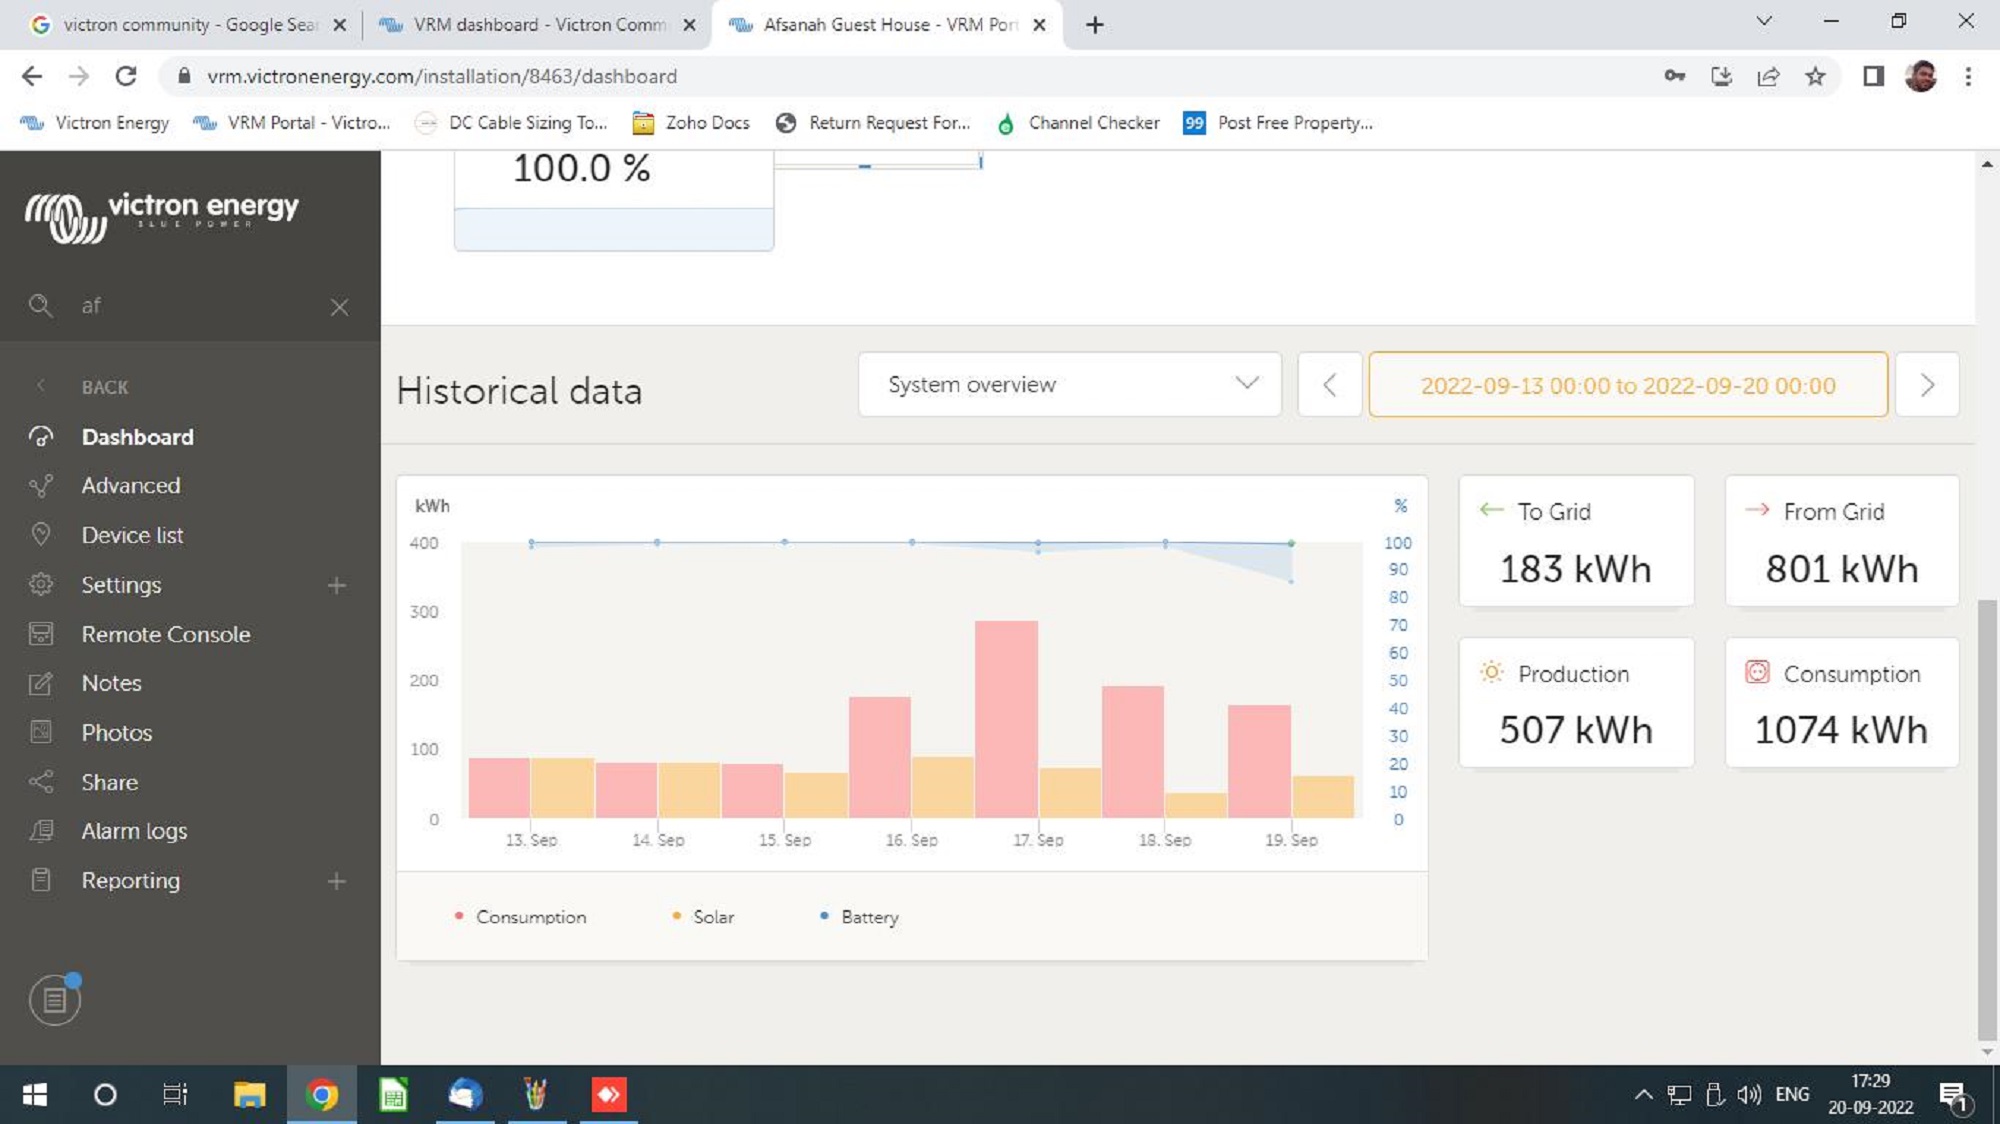
IN VRM dashboard i found that option to see power consumption , From grid , To grid , production. what i wonder is grid in 183kWh ,from grid 801 kWh , production 507kWh and consumption 1074kWh.

My question is

consumption - production = grid in

1074 - 507 = 567

but here instead of 567 it shows 801 , i want to how its 801kWh.

here below i have attached the scree shot of vrm page


Thanks in advance


VRMdashboard display
2 |3000

Up to 8 attachments (including images) can be used with a maximum of 190.8 MiB each and 286.6 MiB total.

5 Answers
nickdb avatar image
nickdb answered ·

There is overhead (energy loss) in converting ac/dc or dc/ac. This can be on or around 20% depending on loads, so if you produced 1000kWh and it was all used to drive loads, you would only supply around 800kWh with 200 lost to heat etc.

So you need to factor this in.

2 comments
2 |3000

Up to 8 attachments (including images) can be used with a maximum of 190.8 MiB each and 286.6 MiB total.

kaarthik avatar image kaarthik commented ·
you mean to say inverter takes 801 units but used only 567units rest 234 units wasted?

this means 70% efficiency ? 30% lost ?


0 Likes 0 ·
nickdb avatar image nickdb ♦♦ kaarthik commented ·

If you look at the 3 tabs, overview consumption and solar.

I'll use mine as an example, so far today on the overview tab.

Production 20kWh

Consumption 12kWh.


The consumption tab

From grid 0.4

From battery 4.8

From Solar 7

Total 12.2 (display rounds down to 12).


Solar tab:

To grid 0

To Battery 13

direct use 7

Total production 20.


All stacks up

In your case consumption - production is not grid in (feeding in).

Direct use is for loads, you have not subtracted power sent to the battery, the to grid breakdown for solar is what you want to use.

0 Likes 0 ·
kaarthik avatar image
kaarthik answered ·

untitled.jpg (253.1 KiB)
2 |3000

Up to 8 attachments (including images) can be used with a maximum of 190.8 MiB each and 286.6 MiB total.

kaarthik avatar image
kaarthik answered ·
2 |3000

Up to 8 attachments (including images) can be used with a maximum of 190.8 MiB each and 286.6 MiB total.

marekp avatar image
marekp answered ·

@kaarthik

You forgot to consider the "to grid" number.

screen-shot-2022-09-20-at-21828-pm.png

Production 507kWh includes 183kWh sent to grid.

507-183=324

801+324=1125

1074/1125=0.9547

Efficiency of your system is pretty nice at 95.47%


5 comments
2 |3000

Up to 8 attachments (including images) can be used with a maximum of 190.8 MiB each and 286.6 MiB total.

kaarthik avatar image kaarthik commented ·

Dear marekp ,

Thanks for your response , also please help me to under stand the other screen shot.

from grid : 56kWh production : 111kWh consumption : 184kWh

here if i take consumption - production = from grid which is 184 - 111 = 73 but actual value of from grid is 56kWh instead of 73kWh. Please help me to understand this thanks in advance.print.png

0 Likes 0 ·
print.png (11.5 KiB)
nickdb avatar image nickdb ♦♦ kaarthik commented ·

You need to choose the "solar" drop down option in the dashboard to see how solar is being used. "production" goes to 3 places:

Direct use (loads/consumption), To battery (charging),To grid (feeding back).

Use the relevant number for your calculations, you are using the total and ignoring it is used differently.

The overview page also ignores what comes from battery so depending on measurement period, numbers won't add up.

To understand this you need to select "consumption" in the dashboard display to see what all was used to supply loads: From battery, From grid and from solar.


You are only using one of the dashboards which shows part of the picture.

example overview, 2.8kWh "missing":

screenshot-2022-09-21-at-065219.png

example consumption (showing battery usage of 2,9):

screenshot-2022-09-21-at-065229.png

So this system has used 3kWh (0.1 solar + 2.9 battery) to supply the remaining 3kWh of loads.

Of the 0.2 production, only half was used to supply loads.

0 Likes 0 ·
kaarthik avatar image kaarthik nickdb ♦♦ commented ·


Dear Nickdb ,

Thanks a lot for your answer its very much helpful to under stand my long time doubt thanks again

0 Likes 0 ·
marekp avatar image marekp kaarthik commented ·
@kaarthik

How much energy was sent to and taken from the battery in the same period of time?

0 Likes 0 ·
jeroen-kuijf avatar image
jeroen-kuijf answered ·

Hi Kaarthik,

You can read in your instruction manual(s) what your loss will be at full load, and what it will consume with no load, this is for every machine different.

Most products with a transformer will give you 94-96% efficiency.

Most transformerless products can go up to 96-99%.

BUT, all that depends mostly on the temperature besides many other factors.

Batteries must be charged and then used, depending the type and many other parameters you can have losses up to 20% easily between a cycle.

When I charge 5000-6000W with my Quattro's from Solarmax inverters on the outputs, I loose about 300-400W in the quattro's themselves, and that's perfectly normal.

So, when I now use this energy I lose that again, total loss 600-800W for just 5000-6000w netto.

The GX will not try to calculate these losses, it will just show the real measured data.

When you switch on "has DC system" you will see approximately how much goes to the dc (GX device, BMV's, DC ventilation, etc), but this is making the GX even more unstable since it starts jumping a bit more, some use it, most do not use it due to the "wrong" indication and might influence the frequency output when you have grid inverters on the output of a multi/quattro, read the instructions about "has DC system".

Be sure to set the BMV (if you use any) to zero with the DC fuse out, next if you want to be very precise, you can set your tail current as low as possible, most people set it on 1 amp to show zero amp, and that works just fine, it's very very rare to have zero amp, you charge or you invert, isn't it, it only does that when your solar power passes exactly your load, also the charge efficiency is mostly programmed optimistic (like; I have the best batteries), be more pessimistic and lower that value.

The 3 pages on the VRM;

System overview; Just shows what you take or inject from/to the grid, solar production and what you used, nothing to be calculated here.

Consumption; There you see from where you used your energy, this is bang on already for years and to be correct, all you took should be what you used!

Solar; here you see where the solar energy went, some to the battery some direct use.

Now with these 3 pieces of info you can solve your puzzle, honestly I never look at it, what is important is to generate enough energy per day to able to pass it without any limitations and/or trying to calculate losses.

The solution is always the 25-50% rule; buy 25-50% more batteries and PV panels then you thought/calculated, problem solved.

Greetz, Jeroen.

Check us on VRM world under www.quintacasadafonte.com , Portugal.

2 |3000

Up to 8 attachments (including images) can be used with a maximum of 190.8 MiB each and 286.6 MiB total.

Related Resources