
Hi,
This is a teaser of an article title that I will expand on as interest and time allows.
I have talked around this topic in this modifications space for a while, and would like to consolidate that writing into one place. Hopefully this will help with expectations, and also inspire others to push the limits and undertake new developments.
If you would like to see me update it, keep it bumped up to the top with new comments. Contributions of links, explanations and examples are also appreciated. Questions should probably be asked as new questions, and just leave this to contributions.
Matthijs is probably going to hate this as all of this is based on my observations and not a deeper understanding of how things are actually working. So if you see something that is wrong, or could be improved, I'd love to hear it (or even better, copy your precisely re-written information straight in :)
In no particular order,
# Resolution & Accuracy
Data resolution is the significant figures of whatever is being measured that can be reliably reported. For example the temperature probes on the MultiPlus will only display temperature to the whole number, i.e 20 degrees C. Increasing the resolution of this data ( i.e. 20.23 degrees C) doesn't provide any greater accuracy, because that the underlying data isn't any more precise than that.
Some values provide a higher resolution, even though the underlying reading isn't extremely precise to begin with. A good example of this is the AC input current sensor. It will provide a display of up to 100 mA (0.0A) (Edit by reader: 100mA would be 0.1A not 0.0A) however this should not be considered a 100mA accurate piece of measurement equipment. Further the accuracy of this current reading will vary across the range, being most imprecise at very low currents, and increasing in precision towards high current readings.
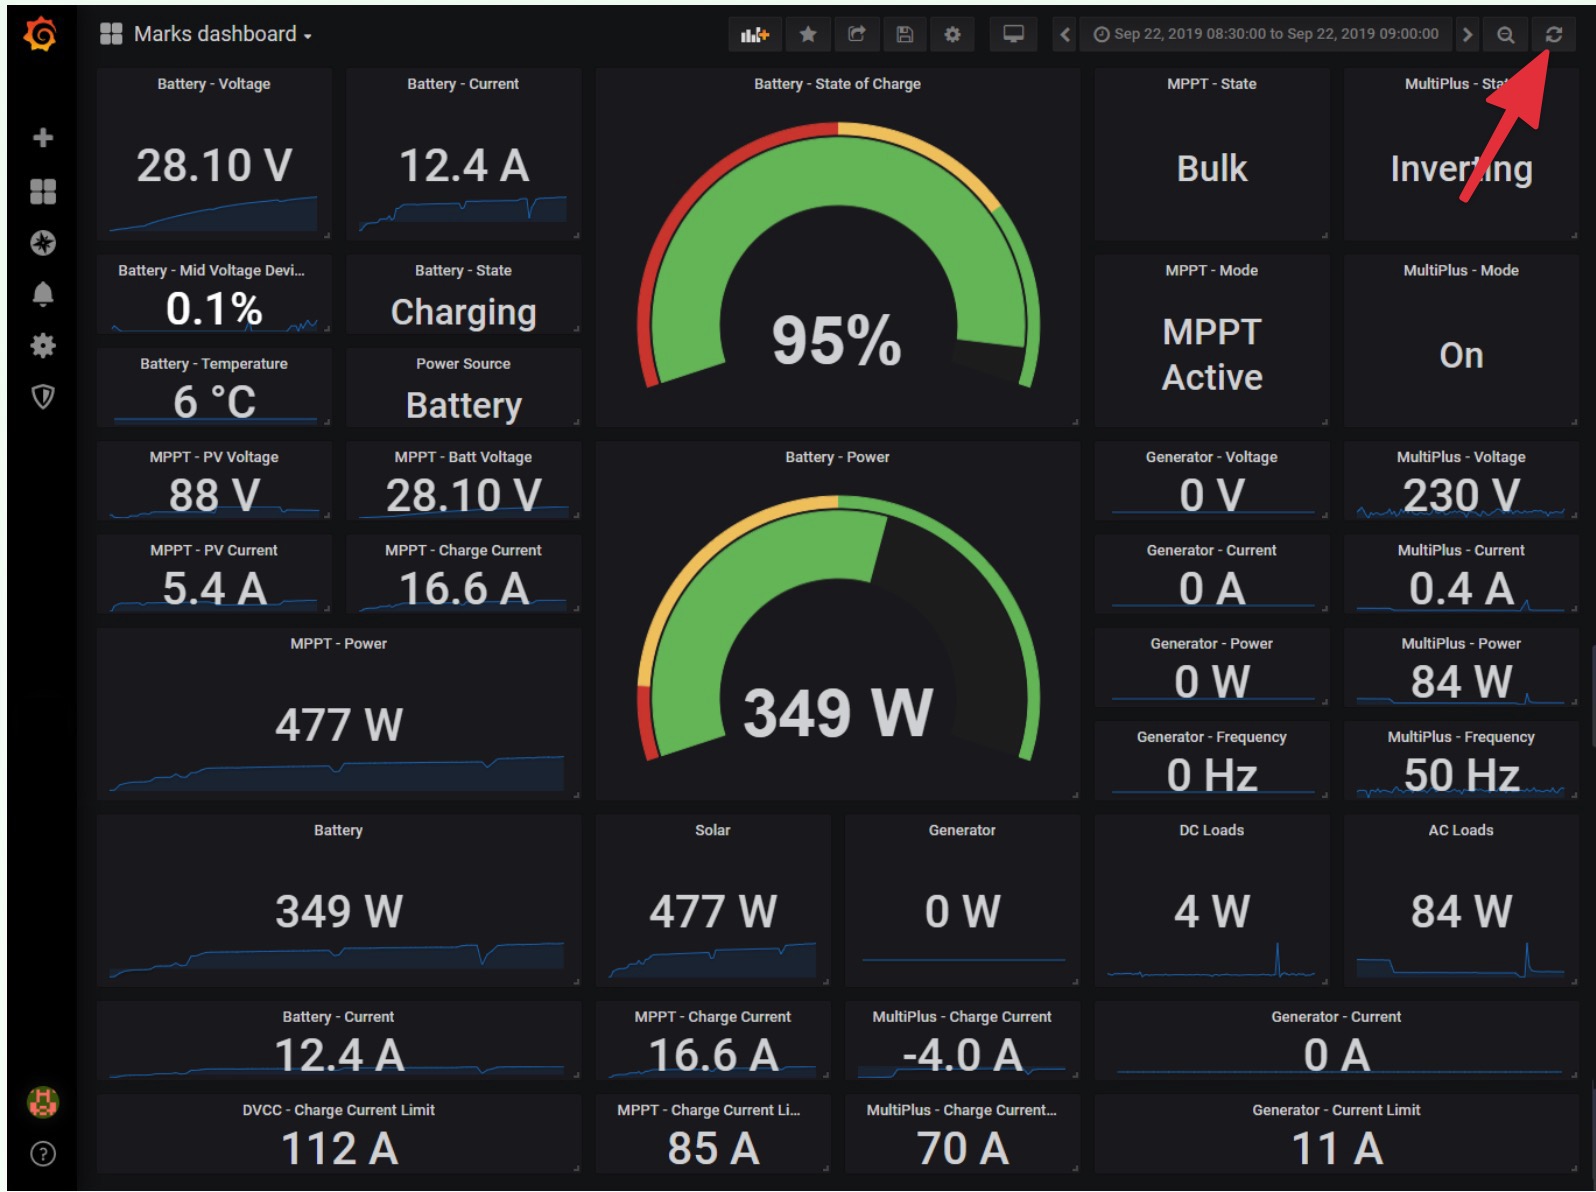
Resolution can also B) apply to the number of data points that are measured or displayed. In some cases data is only updated when it is changed (to reduce unnecessary information) for example the charge state (bulk, absorption) is not transmitted with every packet of data. This can make data appear to 'disappear' in a tool like Grafana if you have selected a range to display where the data has not changed, and not been updated, so there is no value for the time period selected.
Depending on your settings in Grafana the exact resolution of the data points (both in their frequency and amplitude) might be obscured from you. Typically to make it more readable, with averages drawn in-between. If you require precise data points for a particular analysis, you will need to investigate and modify the appropriate display settings in Grafana. This will not modify the underlying data in the database as it was received.
# Refresh rate
Data is entering the database from one end, and then being queried by the Grafana interface at the other end.
These timings do not always line up. A typical refresh rate of the data as it is displayed to you might be 5 seconds to 5 minutes minutes or more, even though the underlying data is coming into the database as a stream, at all sorts of intervals.
# Delay
A delay is introduced as data makes its way from the initial source of the measurement to the point where you are reading it from.
The more layers of computation that are added, the bigger the delay. In the high level
This can make supposed 'realtime' readings appear incorrect or inaccurate. Especially if you are using certain triggers to activate relays or other controls where you know that the event has occurred in the real world, but the system has not yet reacted to it in the way that it was programmed to do so.
In some cases there are also additional artificial delays imposed, to attempt to 'smooth' out spikes or other data issues that can lead to false starts.
# MQTT
MQTT (sometimes said Mosquitto) is a lightweight messaging protocol. It sits as a more accessible and inter-operative API layer between the underlying data (typically from dbus) and other services that you might like to use to access that data (such as Grafana). For most cases users will not need to know much about MQTT except that they need to turn it on for some features to be enabled. It does add a CPU load to the GX device, so should be the first thing disabled if an older GX device (CCGX) is struggling with load issues.
# Modbus TCP
Modbus TCP is another feature rich API layer between the dbus and other applications. It allows for two way modification of data on the dbus, such as changing the AC input current limit, and a lot more.
# database vs stream display
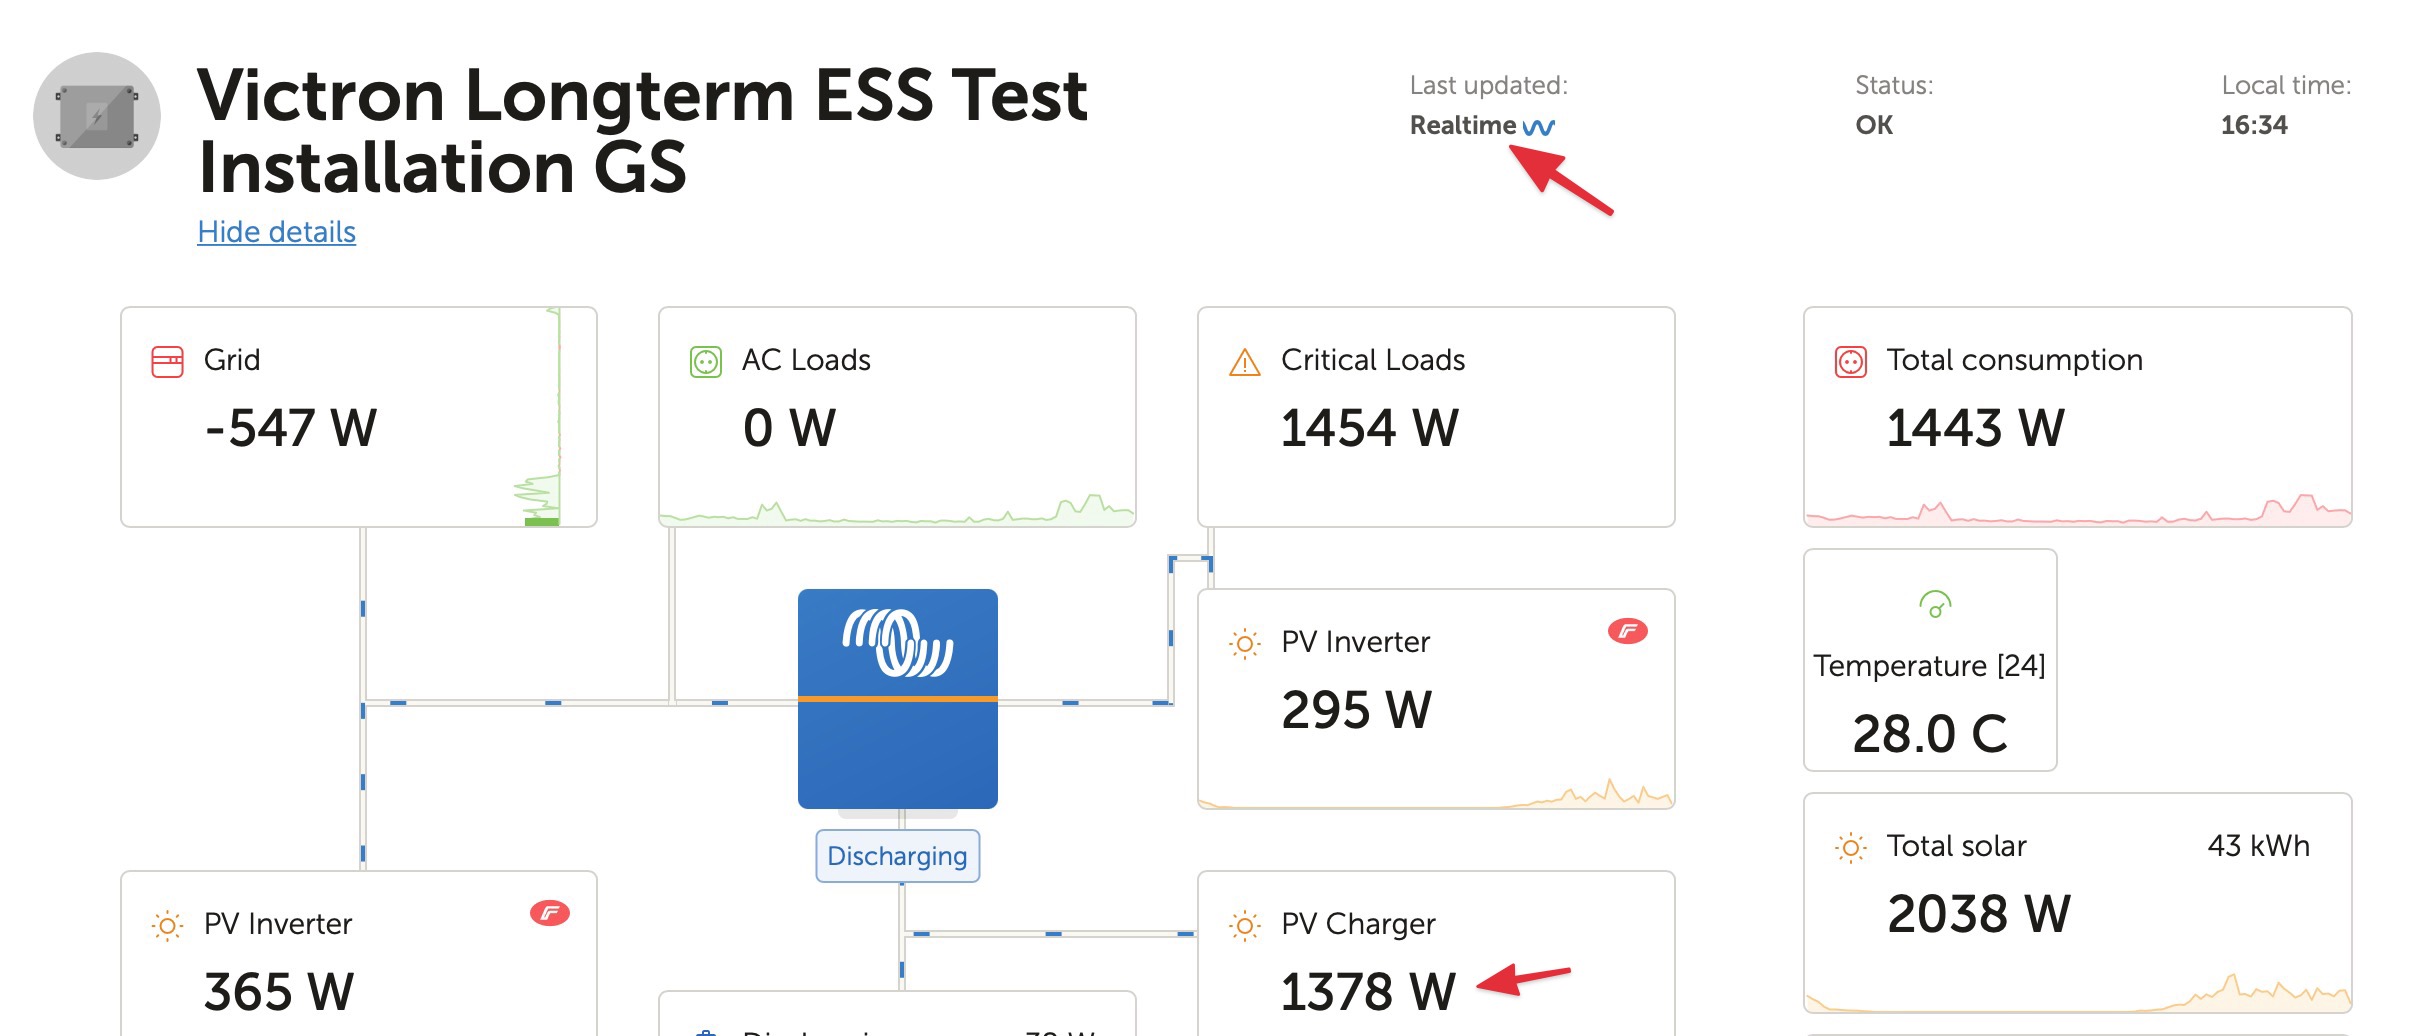
For systems that support it, the VRM dashboard displays a stream of data, the most recent datapoint from the GX device via MQTT. This stream of data is not stored in a database, and discarded as soon as the next datapoint arrives. Because it doesn't need to be written to a databased, just read from the broker direct, it can have less delay than other methods. Though will still be constrained by the round trips required back and forth to internet web servers.
This is distinct from the VRM database, which is set up by default to 15 minute intervals, and can be reduced to as low as 1 minute intervals in the VRM menu. The VRM database data is what is stored and generates the graphs that you can see in the Advanced menu of the VRM, or export as a CSV or excel file.
At some point in the indefinite future, I will cover the topics of:
# dbus
# push vs pull vs query
# 'Realtime'
# Grafana
# VRM dashboard
# HTML5 app
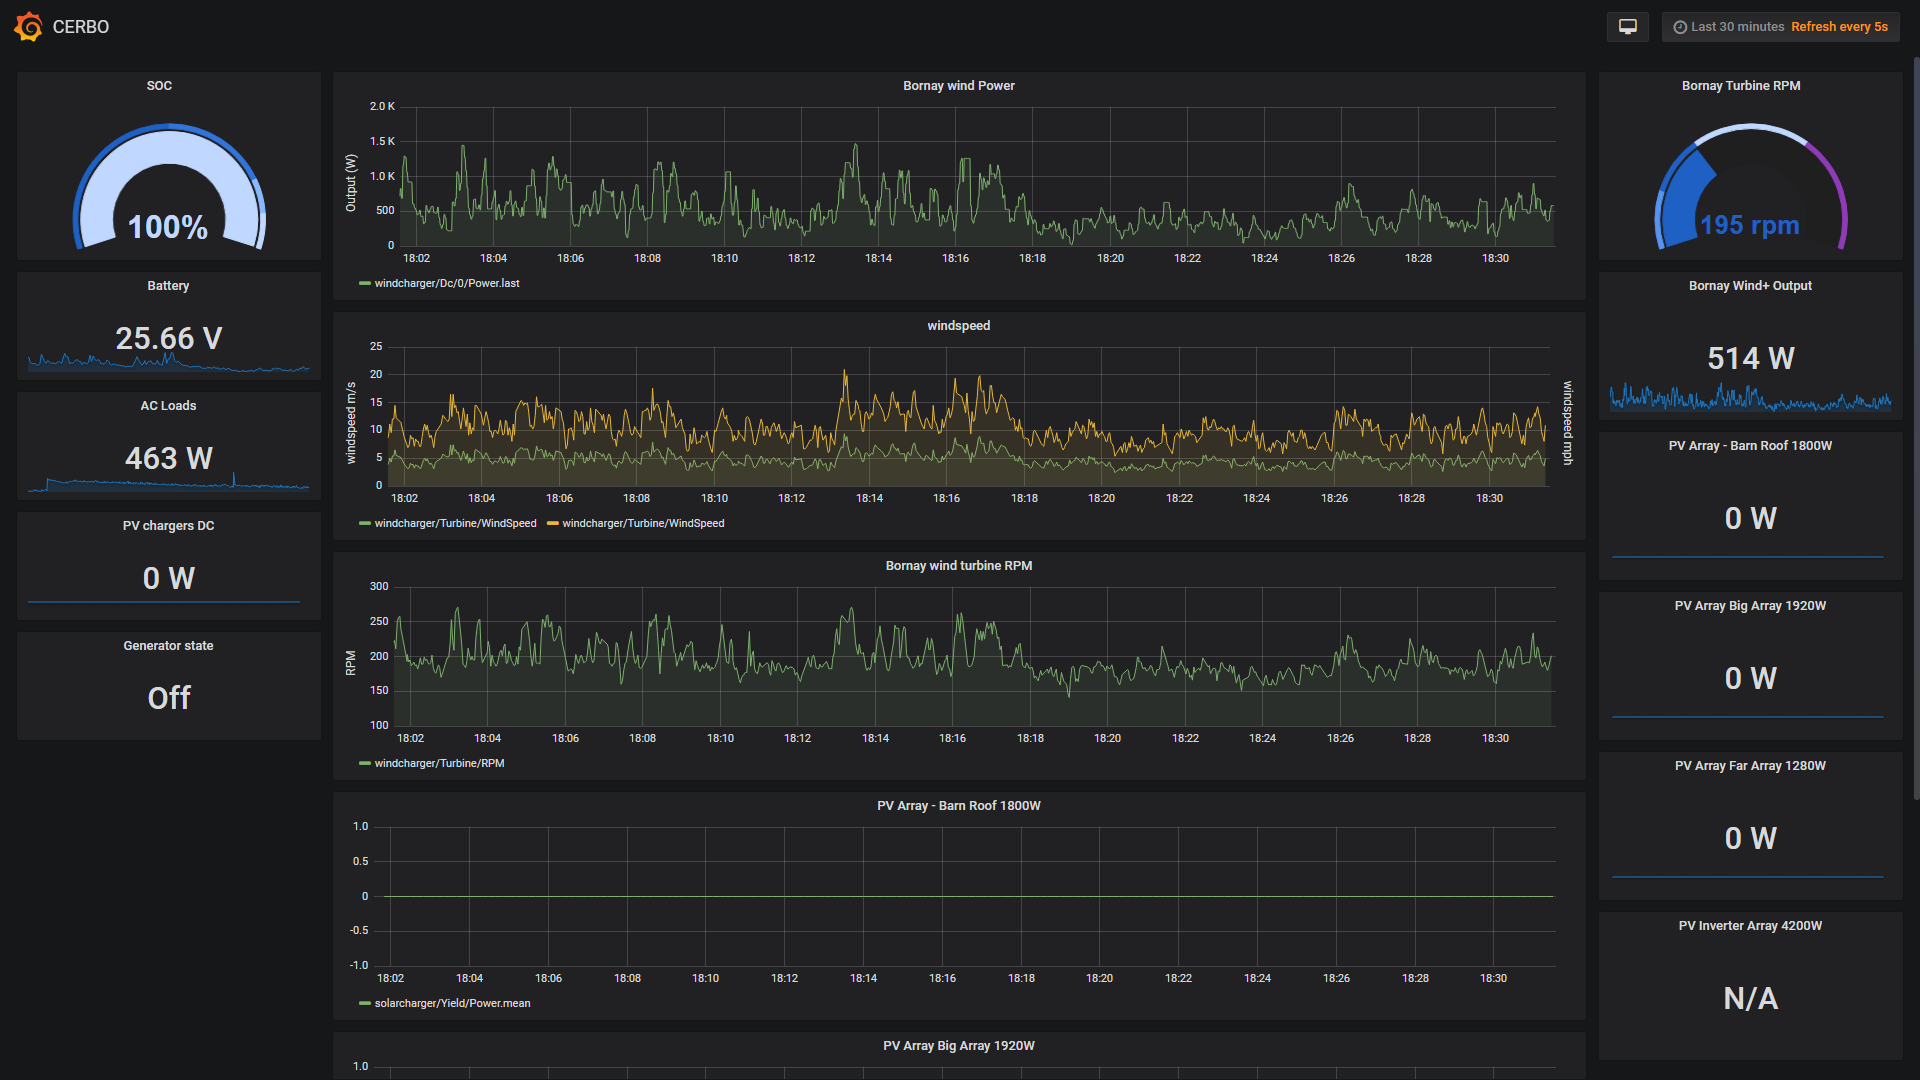
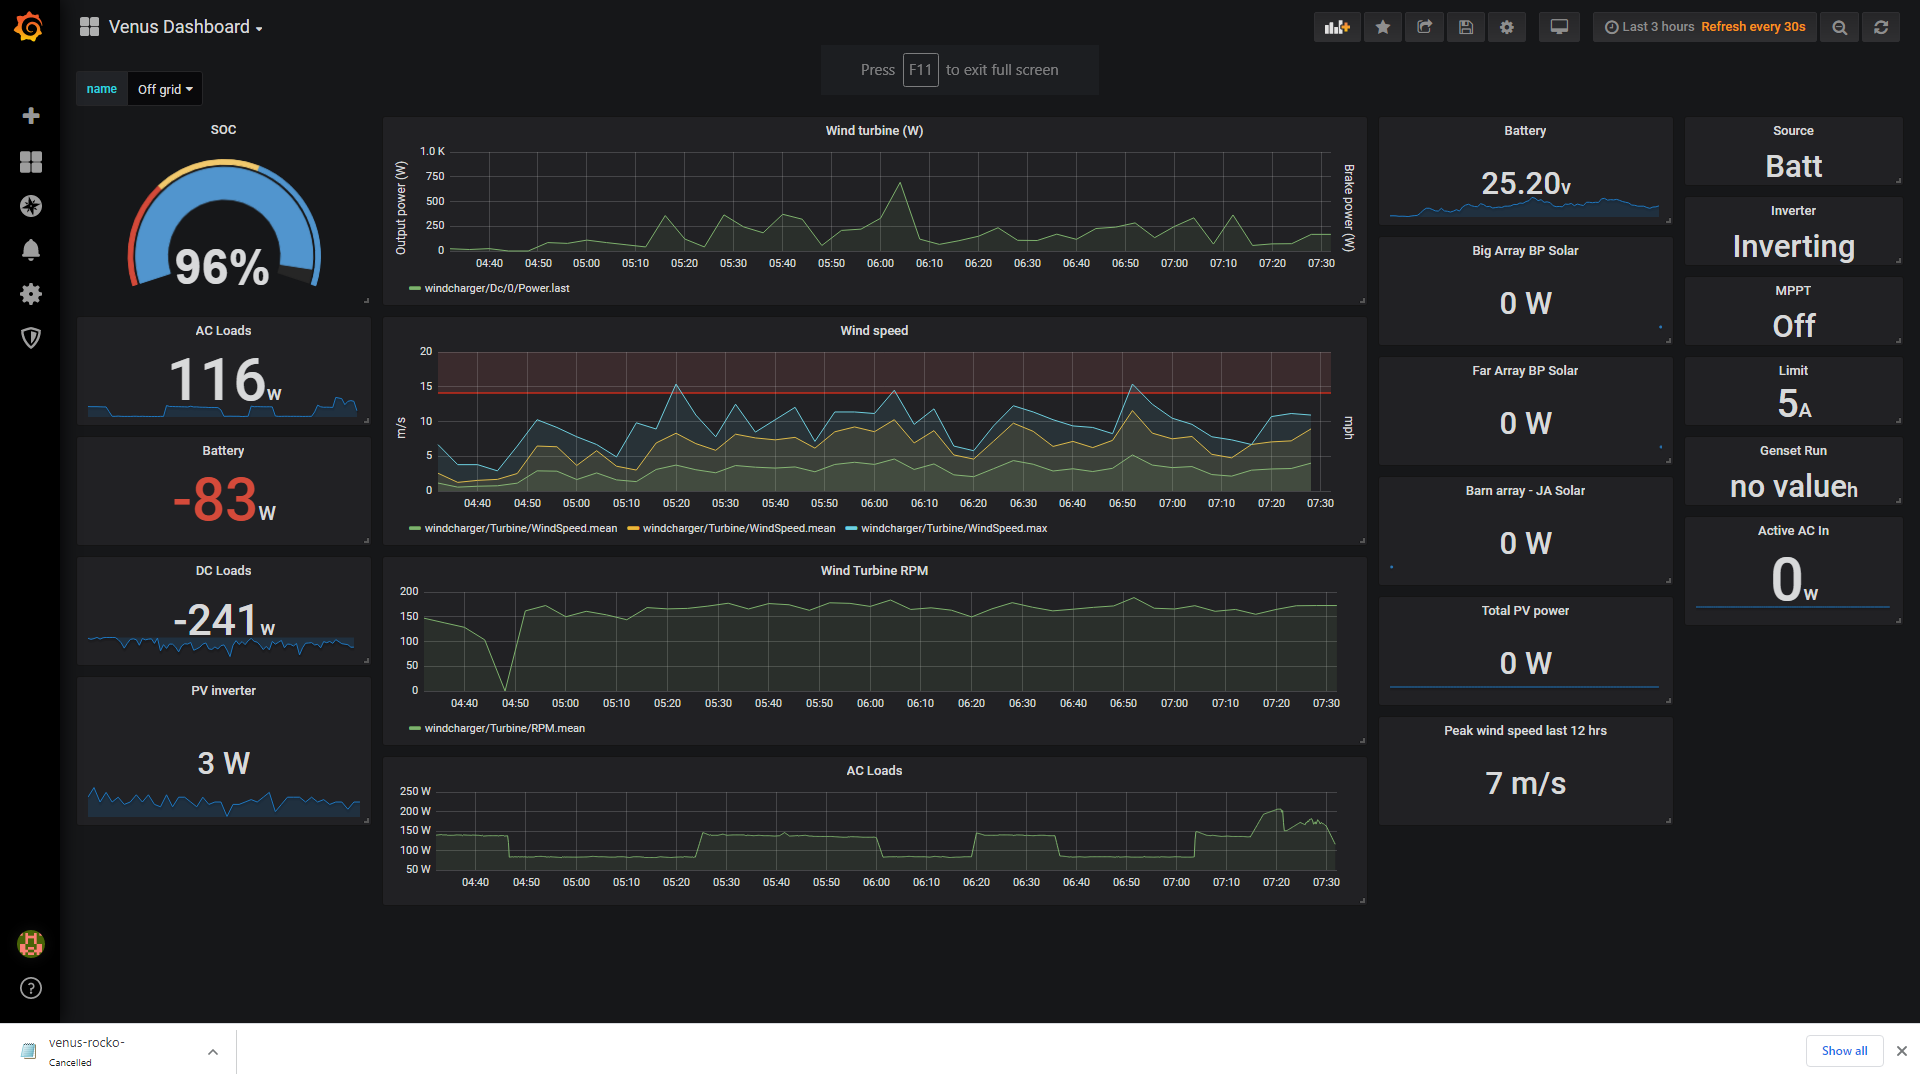
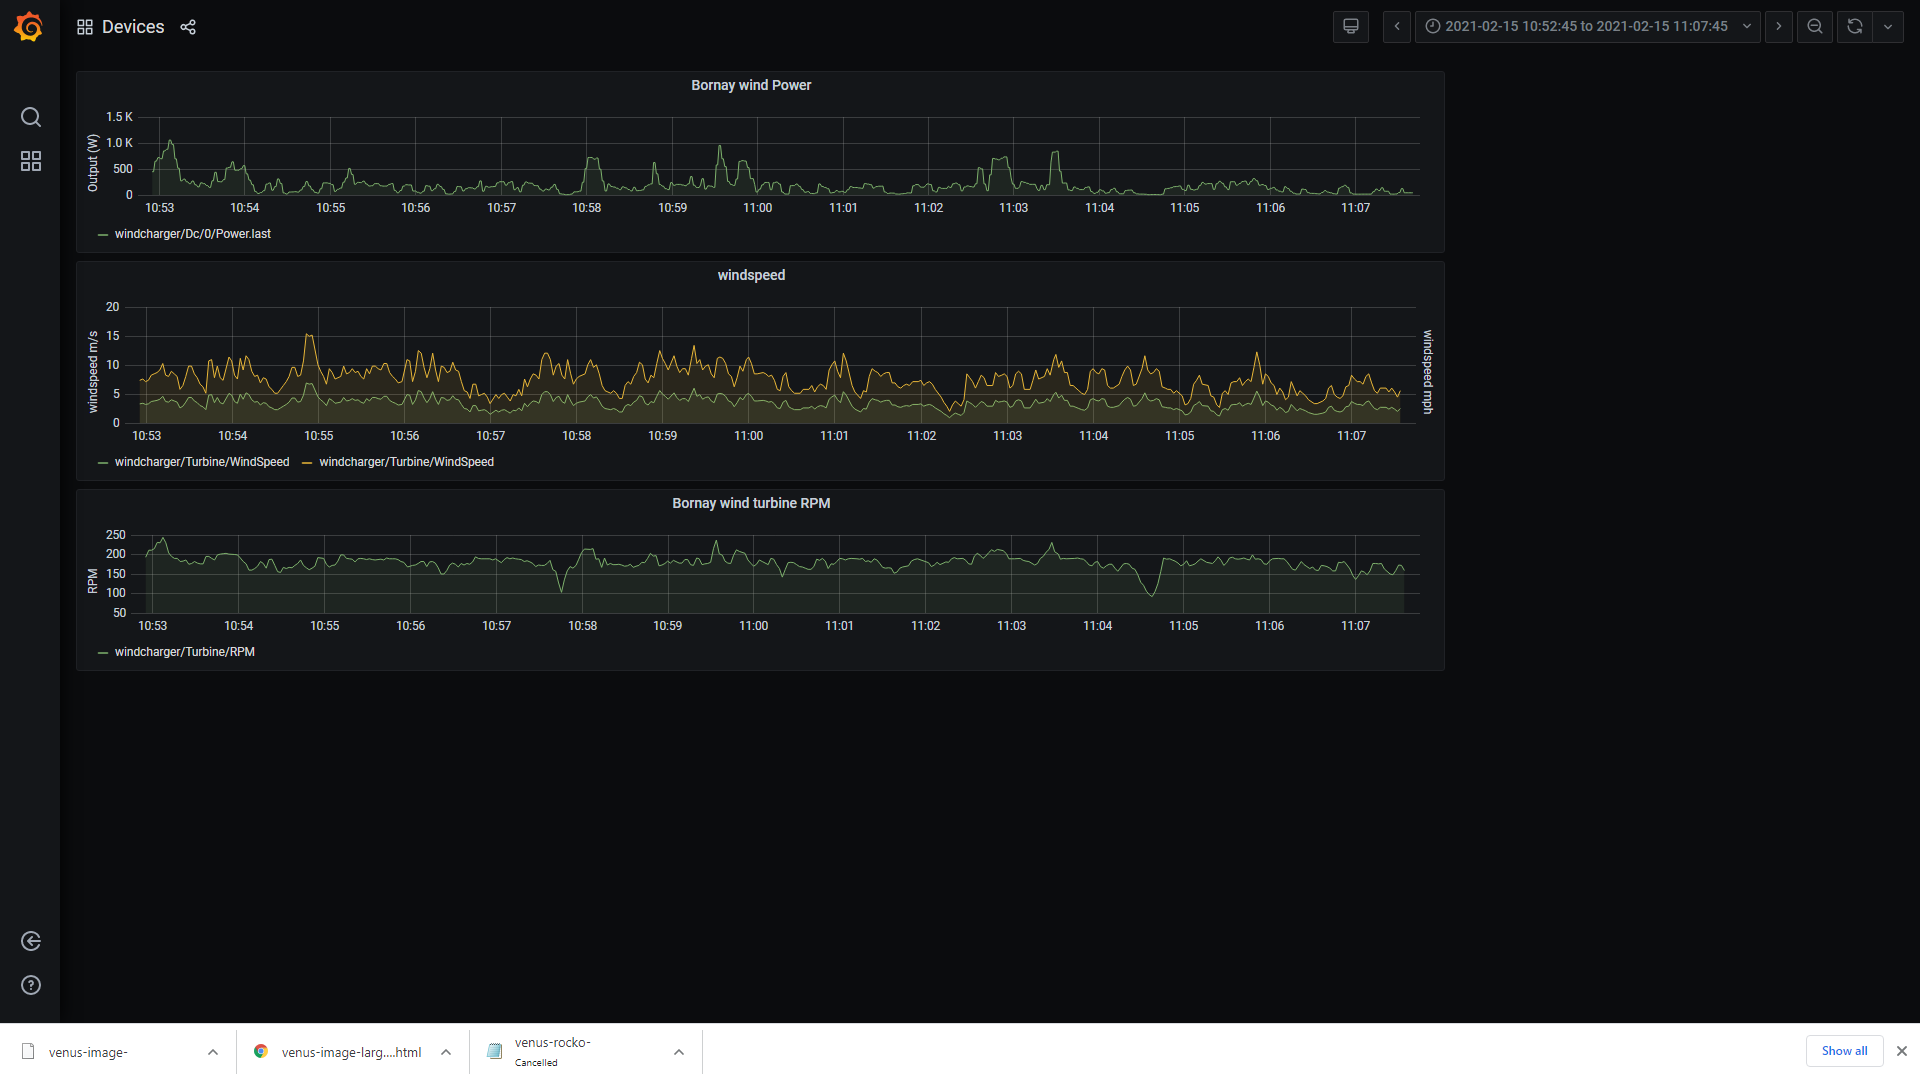
Just a teaser for now, but to get things started - here is a short video displaying 5 different perspectives of the source data point of PV power from the new MPPT RS:


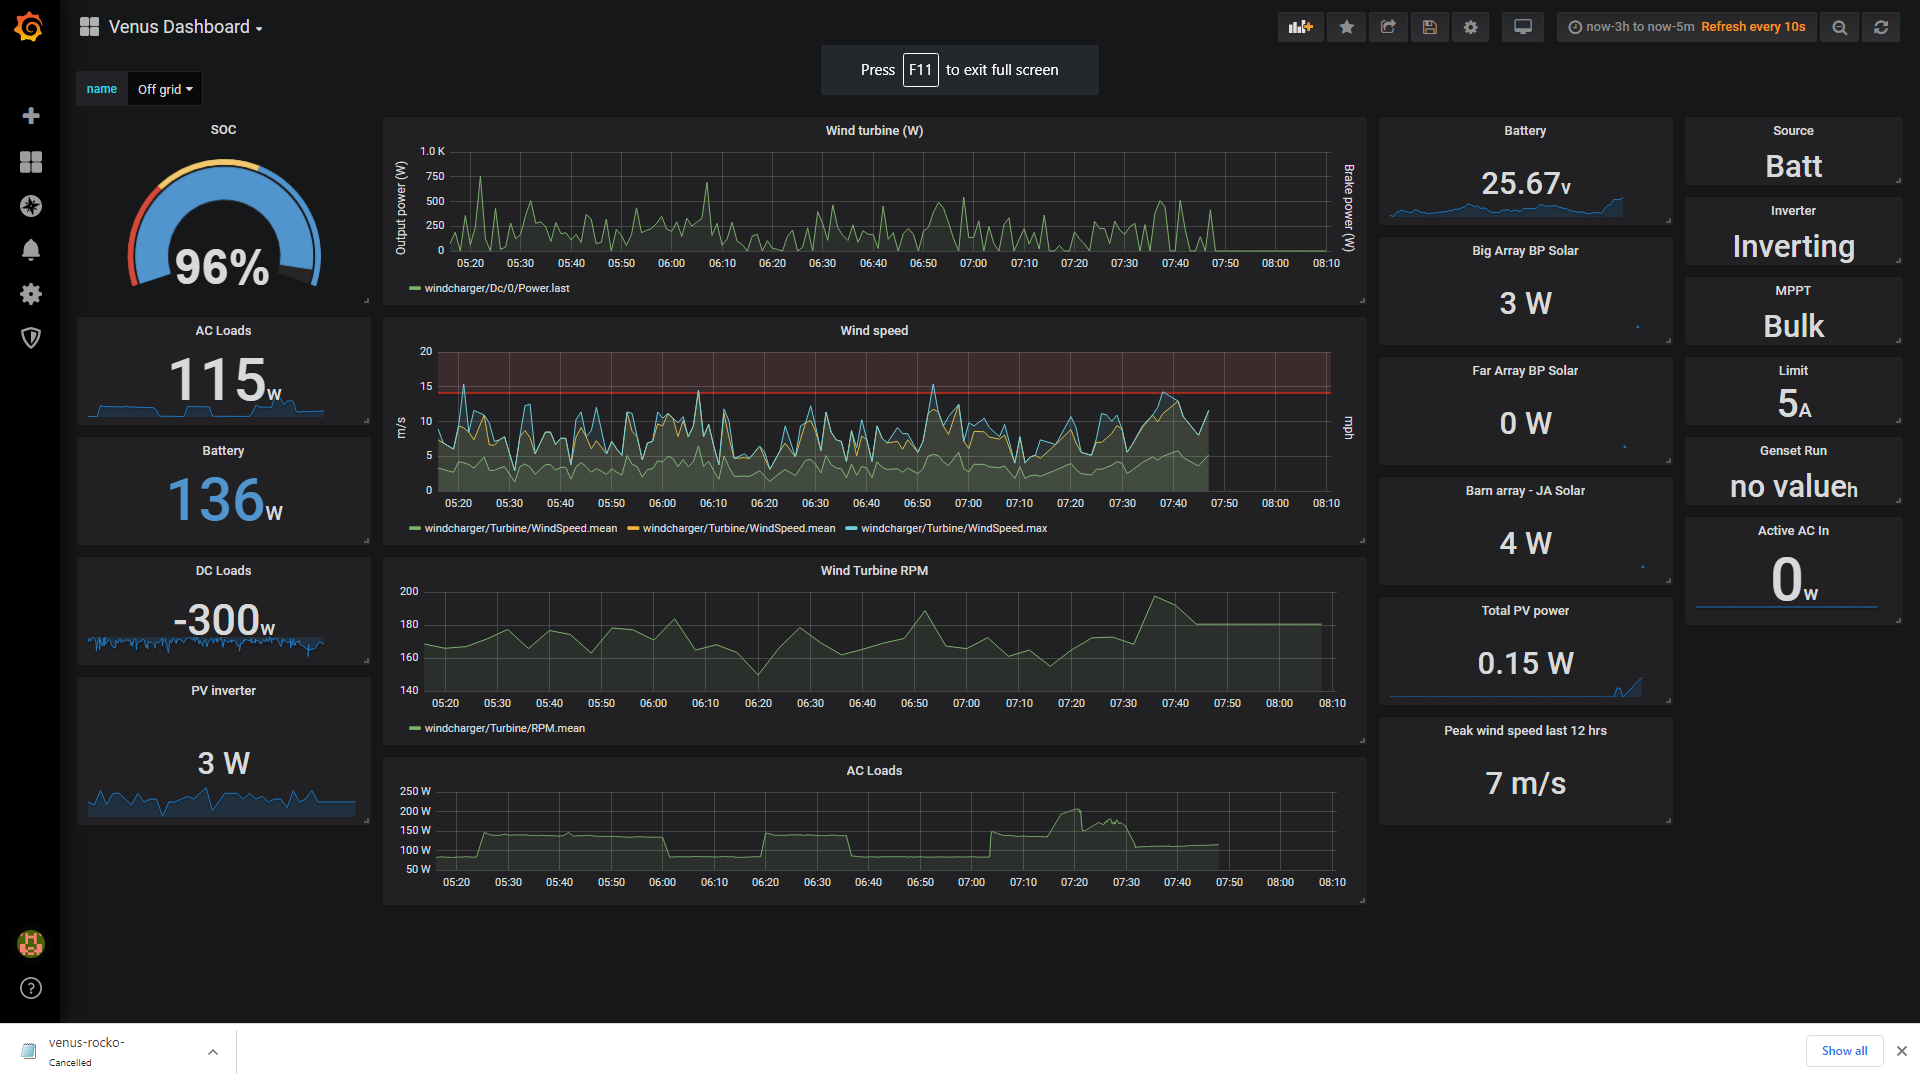 Once the system begins to 'wake up' in the morning, this is what I start to see. It may catch up later but its not very happy...