I have been running Grafana dashboards on Windows machines for some time but wanted to use a Raspberry Pi as the 'server' in my caravan. But I struggled with docker-compose and gave up several months ago and just used an Intel NUC running Windows 10 instead.
After reading a new post here a few days ago, I decided to have another go and - bingo - got Grafana dasboards working on a Pi 3B+.
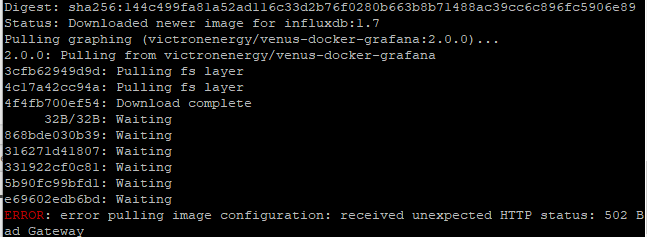
Initially it failed again (cryptic error messages that meant nothing to me), so as one last attempt, I started afresh with a brand new SD card image with the latest OS - and it all installed perfectly. (I had been experimenting with that Pi with various other programs, so I suspect one or more were conflicting the docker and/or docker-compose installation).
Here is a copy of my installation notes for those interested....
Installing Docker/Grafana on Raspberry Pi
Starting with a clean installation of RaspberryOS…
- Install Docker – sudo apt install docker
- Install Docker Compose – sudo apt install docker-compose
- Add pi user to docker group – sudo usermod -aG docker pi
- Reboot (to force group change above)
- Create a Victron directory – mkdir Victron
- Change to that folder – cd Victron
- Copy your docker-compose.yaml file (downloaded from github) to the Victron directory
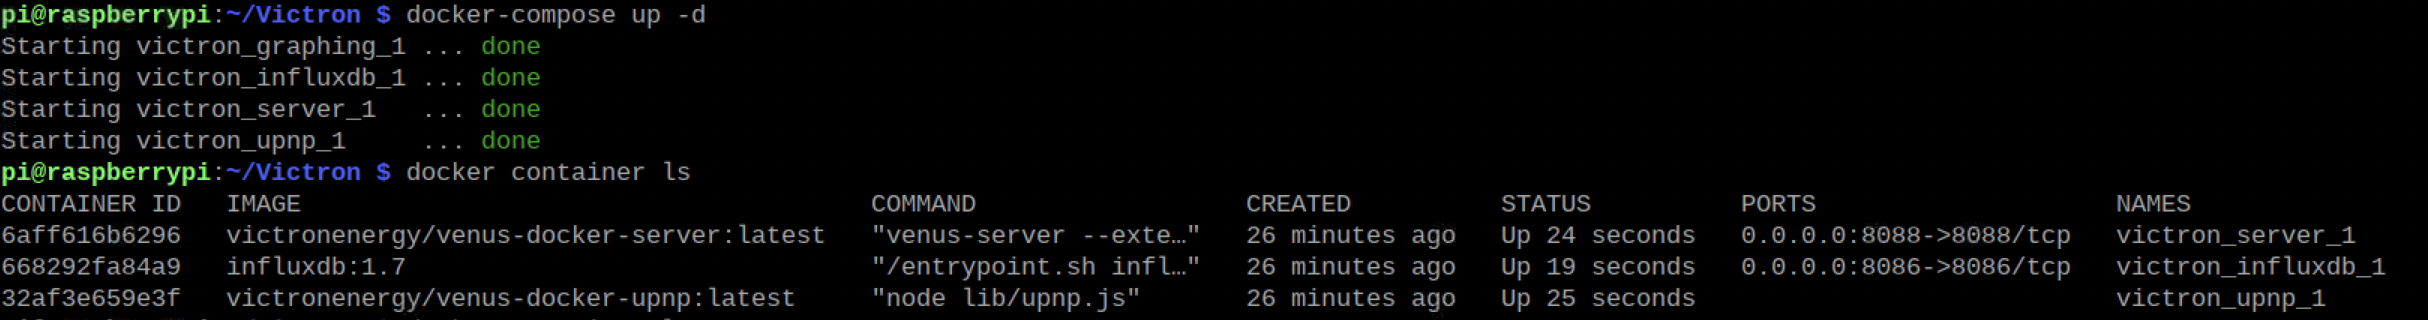
- Run the installer – docker-compose up -d
- Once finished (5-10mins), open a browser.
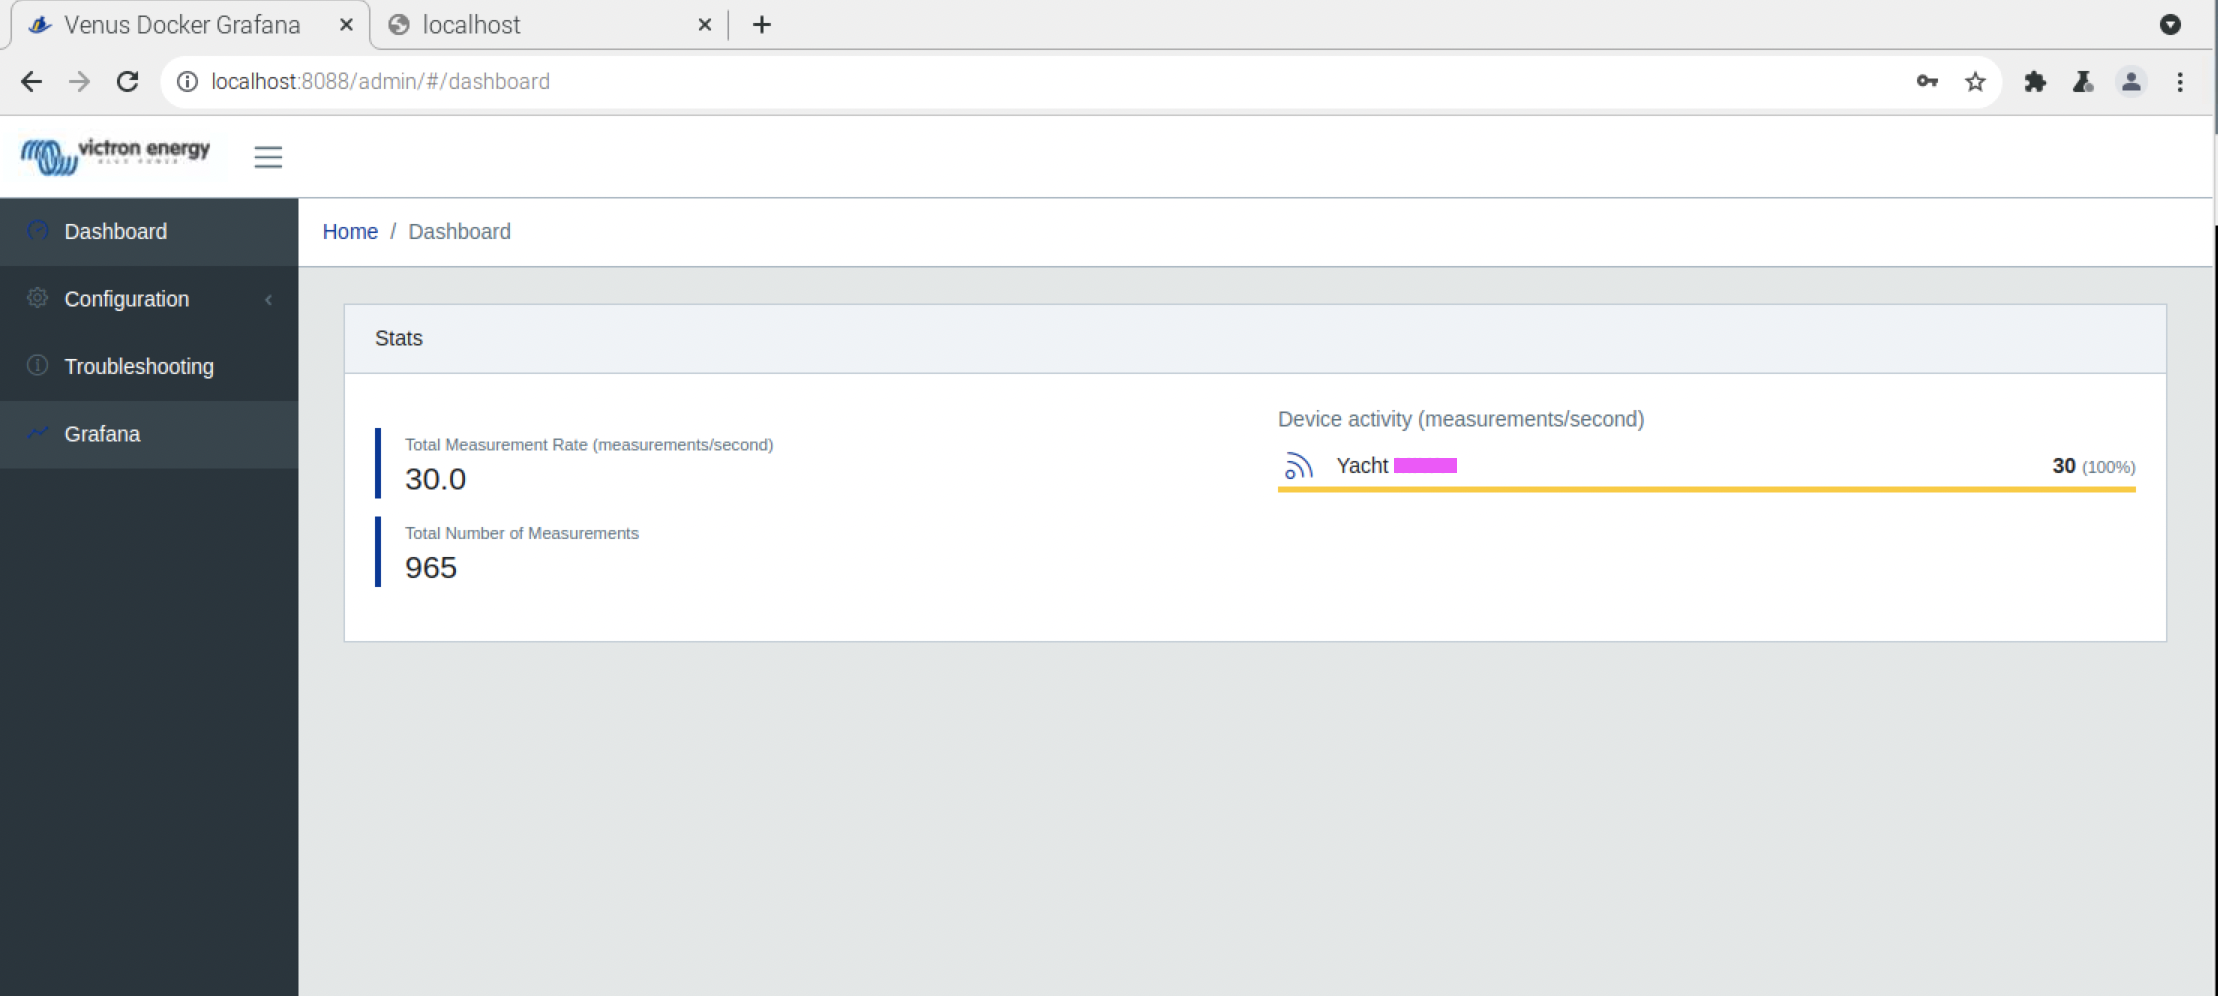
- Browse to http://localhost:8088 and login (admin and admin)
- Go to configuration, VRM and enter your VRM credentials to login. Your VRM-connected systems should then be visible.
- Select the system (enable it).
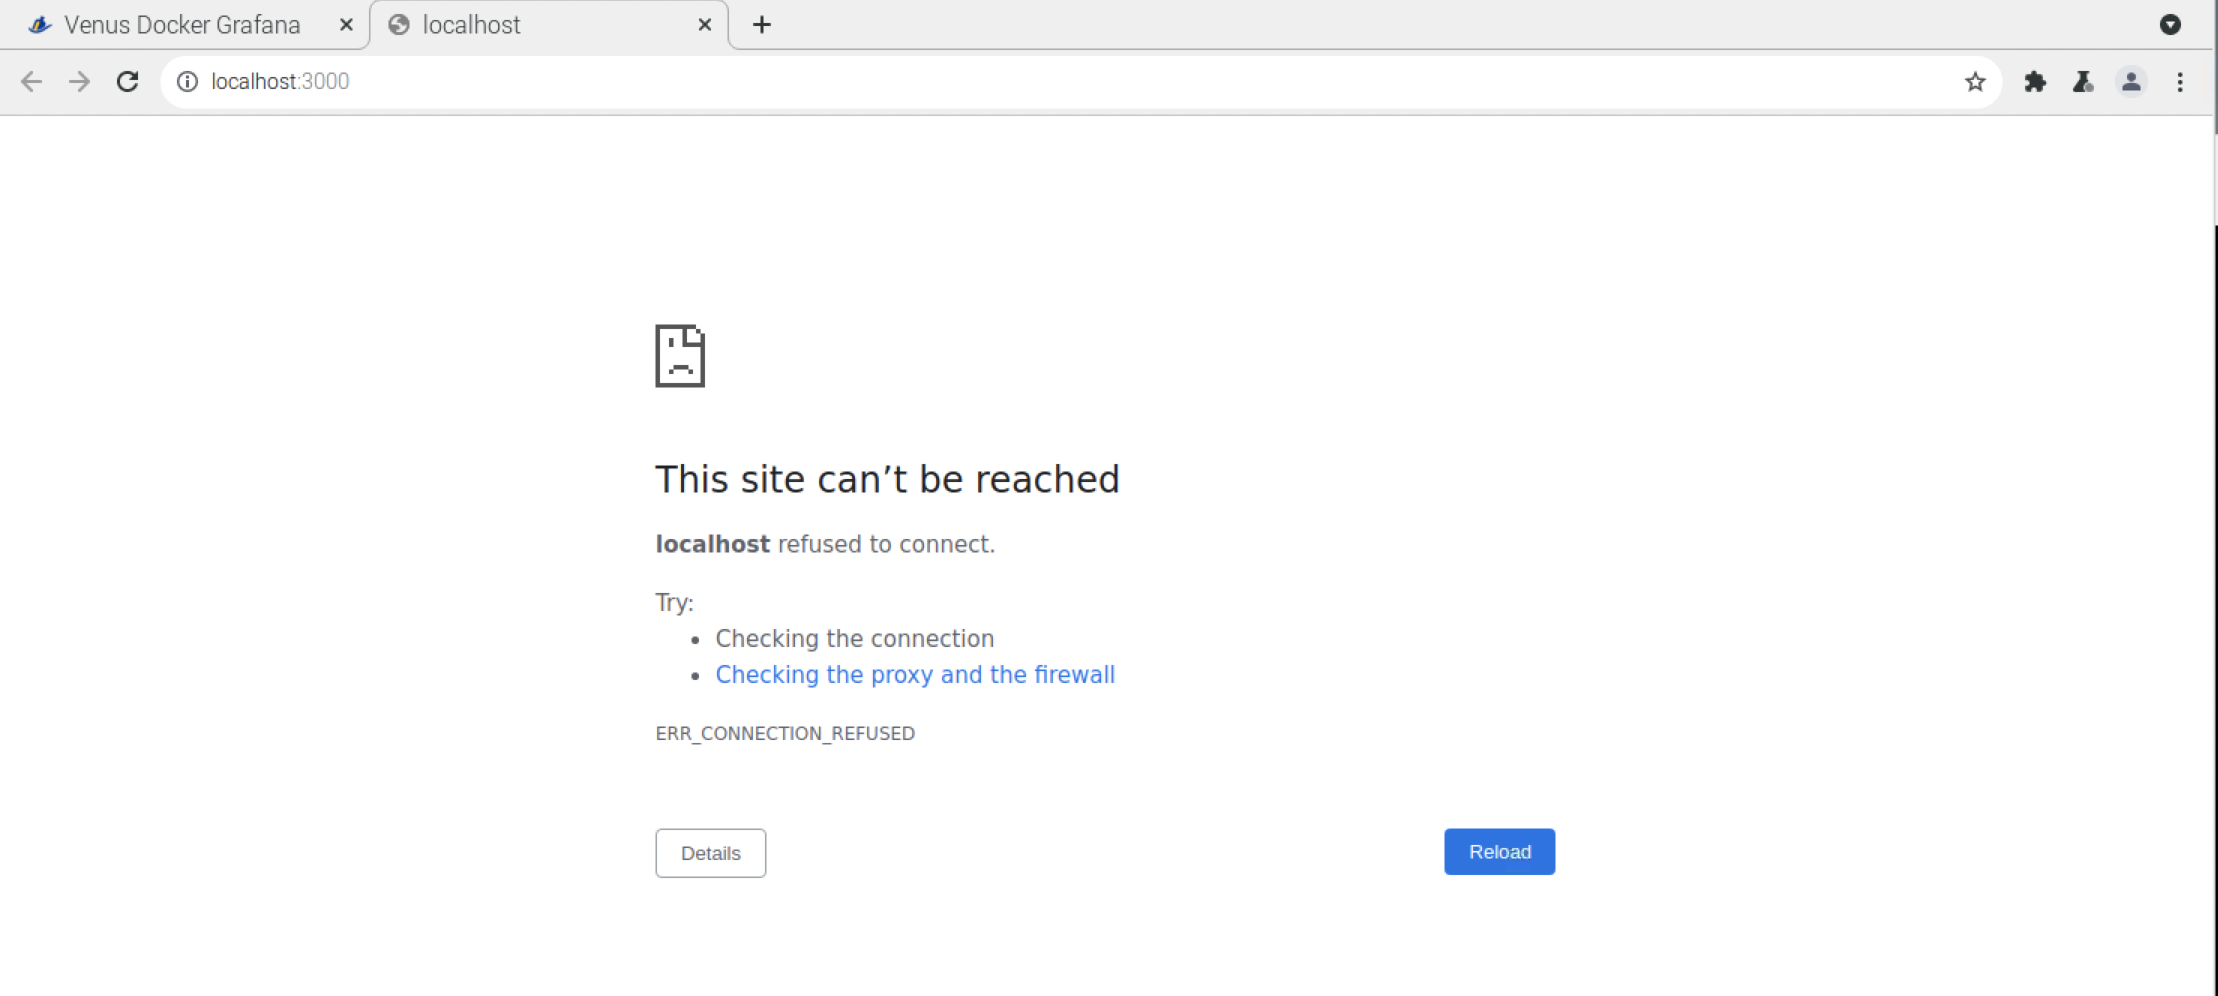
- Open Grafana – http://localhost:3000 (login is admin & admin). Your system(s) should appear under Devices.
- Change to Dashboards and open the sample Venus Dashboard to confirm all is working.
- Import any previously developed dashboard JSON files and start tweaking.
NB – some of the beta visualisation plugins seem to be missing on the Pi version as compared to the latest Windows version (eg the bargraph).
My slightly modified docker-compose.yaml file (added restart: commands) looks like this...
version: '3.4'
services:
server:
image: "victronenergy/venus-docker-server:latest"
ports:
- "8088:8088"
volumes:
- "config-storage:/config"
restart: always
upnp:
image: "victronenergy/venus-docker-upnp:latest"
network_mode: host
restart: always
influxdb:
image: "influxdb:1.7"
ports:
- "8086:8086"
volumes:
- "influxdb-storage:/var/lib/influxdb"
environment:
- INFLUXDB_HTTP_LOG_ENABLED=false
restart: always
graphing:
image: "victronenergy/venus-docker-grafana:latest"
volumes:
- "grafana-storage:/var/lib/grafana"
ports:
- "3000:3000"
restart: always
volumes:
influxdb-storage:
grafana-storage:
config-storage:
Cheers
Phil