(This is my first go at writing an article here, so please forgive my amateur attempt).
This community has been a great place for me to learn new things and get some inspiration from people more knowledgeable than me, so I thought I'd share some of my own experiences with Grafana in the hope that (a) others may benefit and (b) it prompts some lively input on how to do things better!
My setup: I have two systems running (but both of them works-in-progress):
1. - a 12V system in a caravan with MultiPlus, two MPPTs, BMV, lithium battery and a RPi running VenusOS.
2. - a 24V system in my shed (man cave) with a small MultiPlus, MPPT, BMV, AGM bank and RPi running VenusOS.
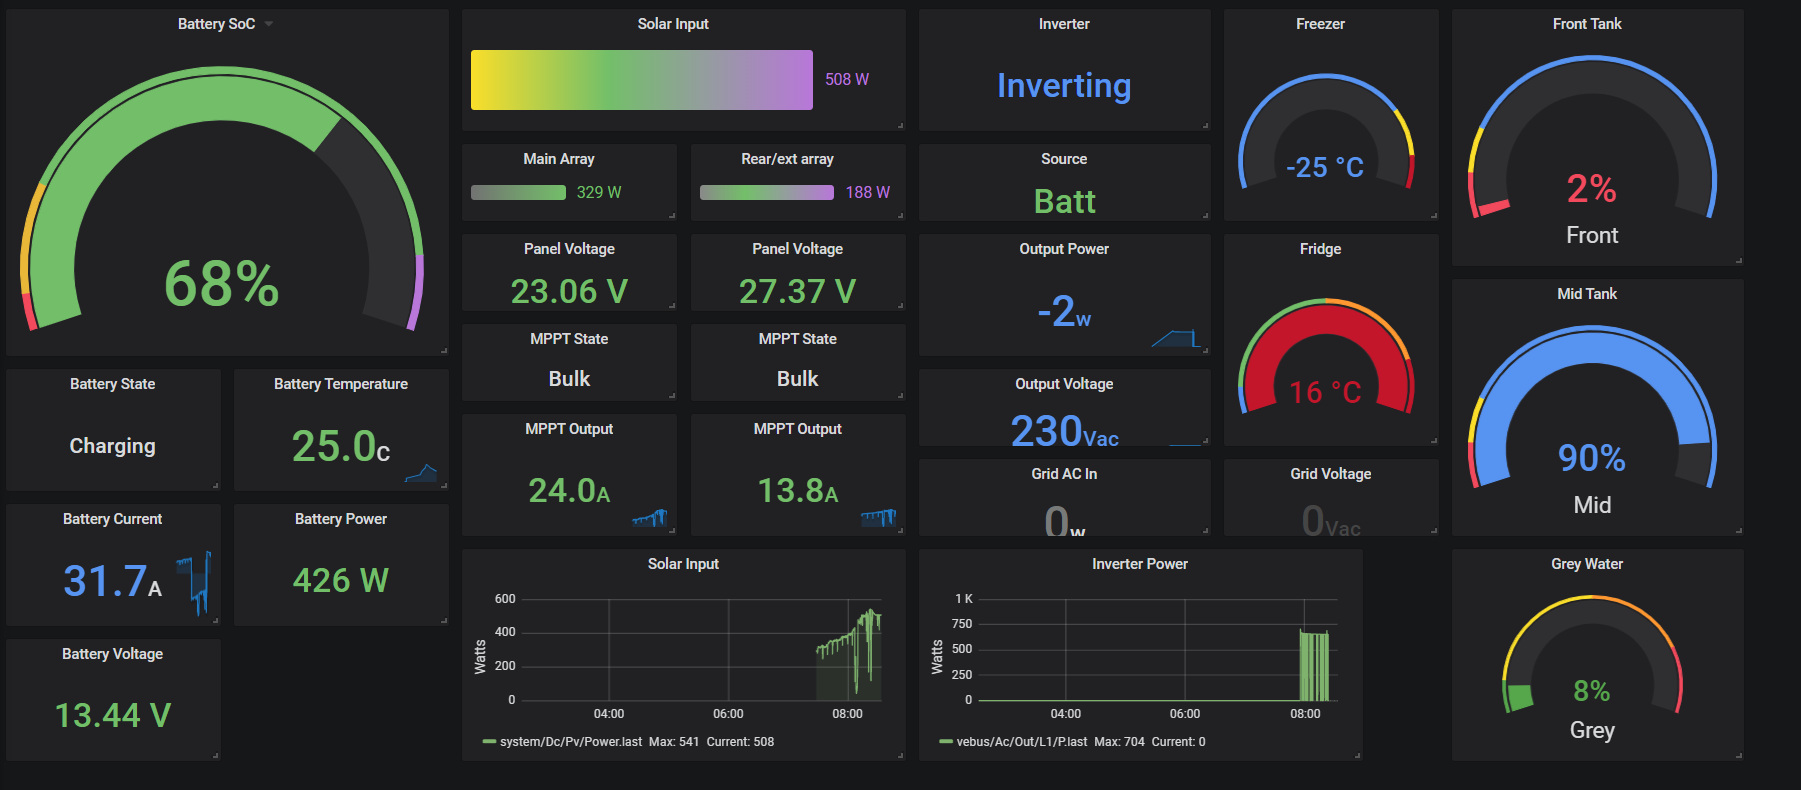
Caravan Dashboard.
This is my current dashboard...
And here is the JSON file for it. (I had to change the file type from .json to .txt - you need to change it back to .json. I hope this works OK.)... Caravan JSON file.txt
Shed Dashboard
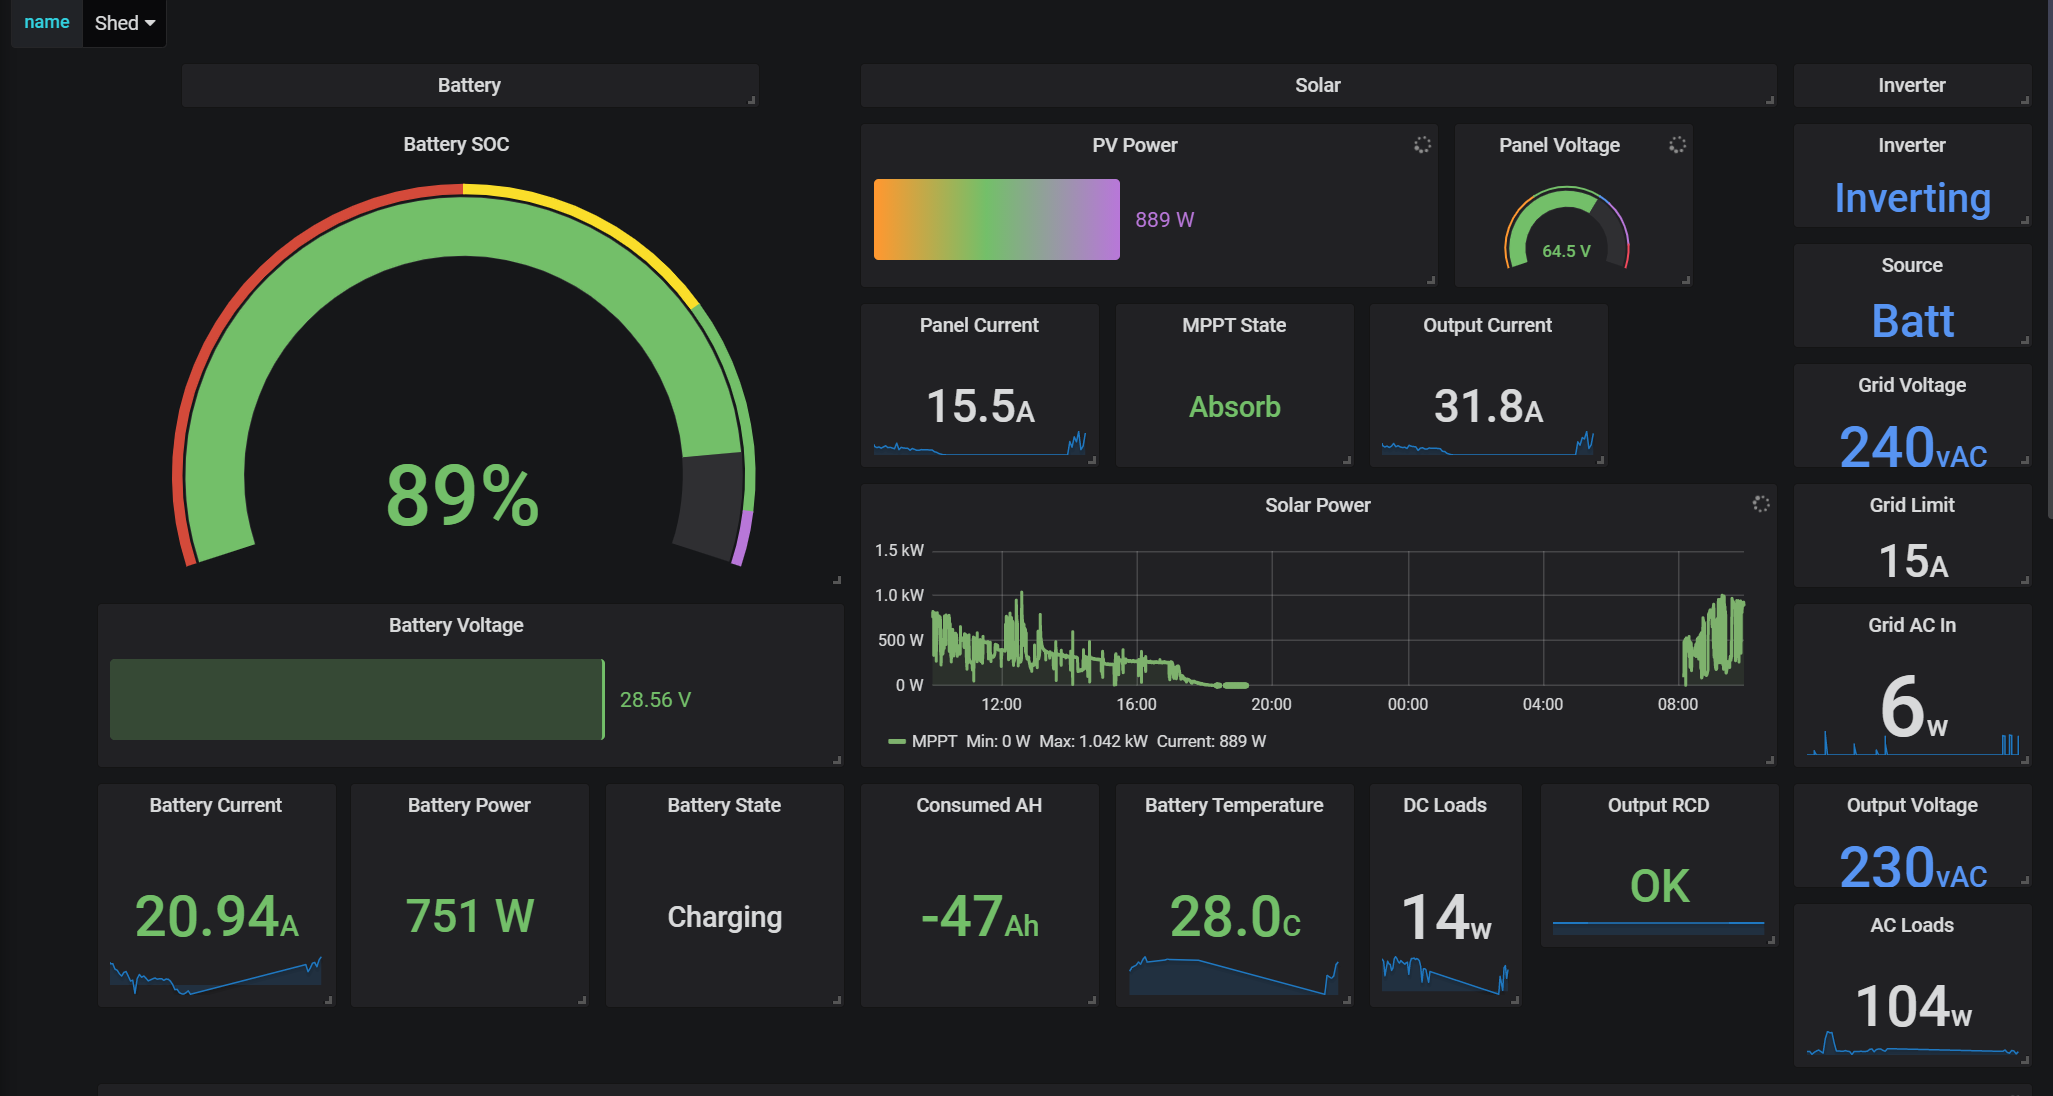
And the JSON file - Shed JSON file.txt
Some notes:
In the caravan I installed an Intel NUC running Windows 10 and browse to it with an iPad-mini - the iPad is the main UI while we are travelling. But I do have a 7" HDMI monitor, keyboard and mouse to talk to the PC when necessary (eg Docker and Windows updates). This system has been fairly stable but the NUC itself struggles when using it's browser (Edge). Not sure why, but the browser uses 100% of the CPU when running. (It's a fairly low-spec NUC). It's not an issue using the iPad as the browser.
In the shed I use an older SurfacePro running Windows 10 and a much older 10" iPad as the UI. Both are much less stable than the caravan system: I have to regularly restart Grafana on the PC and Safari crashes regularly on the iPad. In contrast, running the Venus Remote Console on the same iPad is rock solid, so there's something about Grafana it doesn't like (html5 perhaps?). One day I'll update the hardware, but it will do for now. The message here is that old(er) hardware could be problematic with Grafana.
All Windows PCs (including 2 other laptops) run Windows 10 Home with WSL (Windows Subsystem for Linux) - that is required to run Docker. W10 Pro would be a better choice is starting again.
There seem to be Docker updates every couple of days lately. Not a big deal but something to consider if on an expensive mobile data plan.
Data usage is much higher when running Grafana. Mine went from around 10MB/day with a Venus connection to VRM to somewhere in the 200-400MB/day with Grafana running. Again, it's something to consider on a limited mobile plan. In my case, it hasn't been a problem in reality - I use a 5GB/month plan that down-speeds to 1.5MBps when the 5GB is used. That happens about halfway through each month, but it doesn't affect the operation of VRM or Grafana. (It does make a Docker update VERY slow though!).
As for Grafana itself, I am finding new things every time I play with it. There are SO many options for every panel on the page. Getting them to behave the way I want takes a lot of fiddling (eg getting current values v. averaged values). And as I get closer to what I want, I find things I want to do but can't - like summing the two fresh water tanks to tell me how much water we have left. Another 'wish' is to have a needle indicator on gauges rather than a solid arc (for values like battery power and current that go negative as well as positive). Hopefully someone can point me in the right direction here!
One potential pain point that has bitten me (also with VRM) is building a UI based on device instances. A change of USB port can change the instance ID; and that stuffs up queries (and VRM advanced graph widgets) so you get either no data or (worse) incorrect data.
OK - hopefully that's enough to kick off some discussion.
Cheers
Phil