question

ips-ad avatar image
ips-ad asked

Historical data in VRM portal: statistics are incorrect

Hi, we set up a MultiPlus II and Cerbo GX recently, and so far it works like a charm. The Victron components really make a professional impression.

Our setup:

  • 3-phase from grid
  • ictron MultiPlus II 12/3000, AC Input connected to sub-distribution L1 (single phase)
    • 12x CALB CA180F 180 Ah LiFePO4 cells (from a stripped SolarWorld battery)
    • 3x Daly SmartBMS
  • Victron Cerbo GX
  • Energy meter ET340 as grid meter, input connected to grid only and output connected to sub-distribution
  • Kostal Piko 7.5, connected to sub-distribution L1, L2, L3 (SolarWorld-branded)

So basically we replaced out-of-support components from SolarWorld OEMs by Victron components.

...did all the configuration and stuff, and that's how the topology looks like in VRM:

1644923707681.png

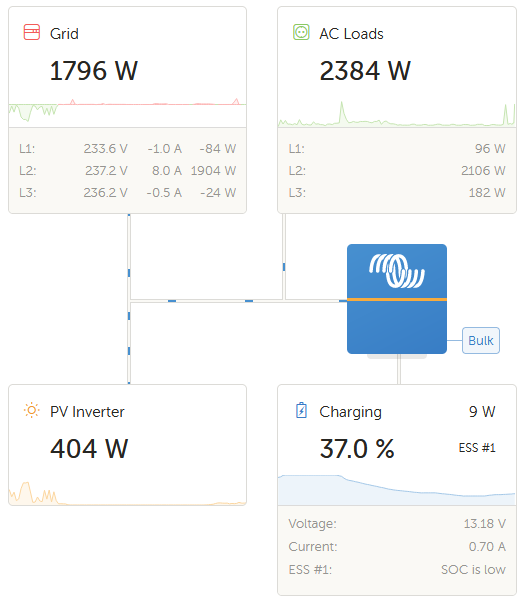
This is correct and all the numbers show up correctly, the system regulates like a charm (not discharging here because ESS minimum SOC is set to 35 % at the moment for safety reasons).

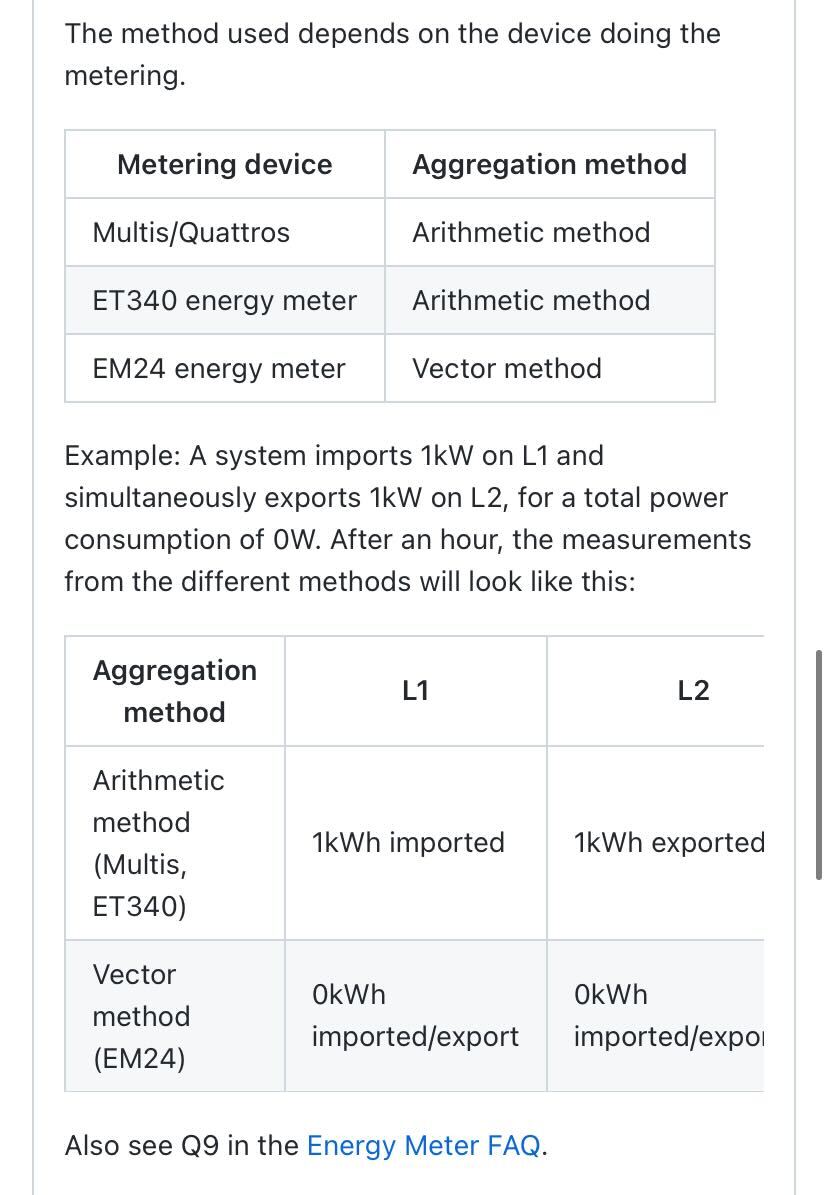
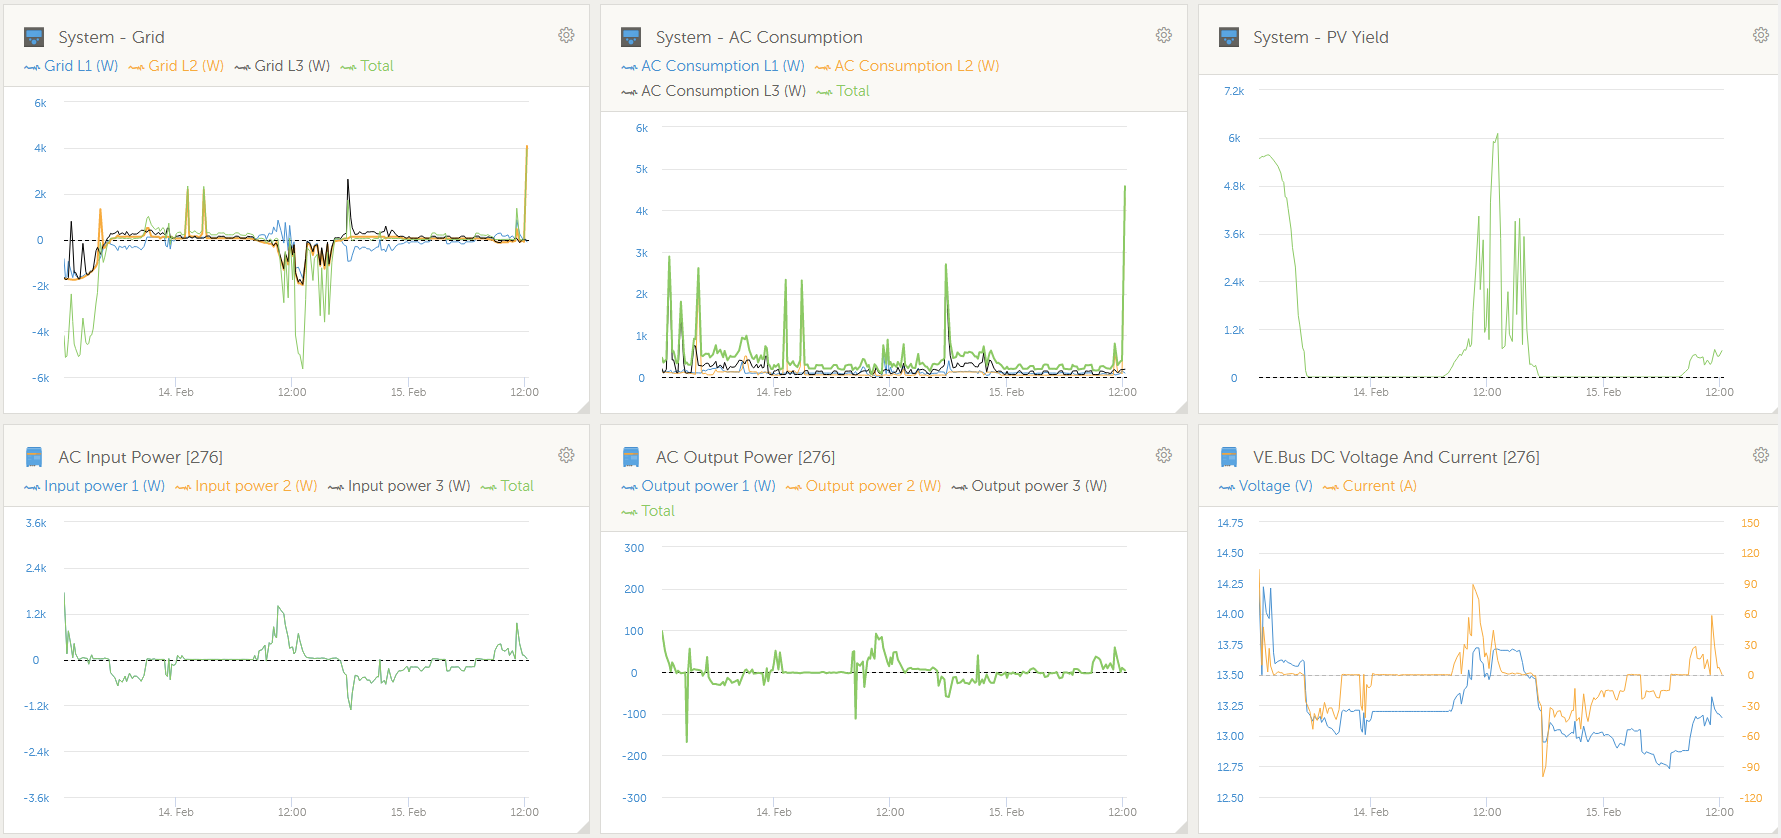
But, of course not everything is perfect yet :-) The VRM portal history data does not really make sense:

1644924210723.pngIn the highlighted area for example, there was almost no consumption from grid, it was all covered by the MultiPlus. But most of the consumption shows up as grid consumption and only a few as battery consumption?!

The advanced statistics look all correct though:

1644924612293.png


It seems like just the historical data is miscalculated. How can we fix that?

Thanks very much for any hints and ideas!

Multiplus-IIcerbo gxVRM
1644923707681.png (42.5 KiB)
1644924210723.png (28.2 KiB)
1644924612293.png (216.4 KiB)
2 |3000

Up to 8 attachments (including images) can be used with a maximum of 190.8 MiB each and 286.6 MiB total.

2 Answers
markus avatar image
markus answered ·

Hi, you are using the ET340 energy meter, which has arithmetic based sum calculation.

you should use the EM24, which has vector based sum calculation.

The difference is, the ET340 counts up "to grid" and "from grid" counters, while one phase is compensated with another.

The EM24 only counts the net sum of that compensation, which is what you want to have.

See Q9 here:

Energy Meters start page [Victron Energy]

2 |3000

Up to 8 attachments (including images) can be used with a maximum of 190.8 MiB each and 286.6 MiB total.

ips-ad avatar image
ips-ad answered ·

Thank you - I think I'm understanding what's happening there, the historical data is ignoring compensation (for sure not wrong under some circumstances, when you need the real input/output of all phases accounted). The EM24 is already calculating the compensation by itself.

This rises a couple more questions..:

  • Does the EM24 also provide detailed information about L1/L2/L3 (this is still useful information)?
  • Q9 in your link above states "In the ET340 - the energy imported and exported is counted at each individual phase and then the Total is provided from the sum of those values." vs. "In the EM24 - the energy imported and exported is counted as a total power, with net differential readings from each phase cancelling each other out.": To me, both results in the same total value, doesn't it..?
  • Apart from ET340/EM24 the "From battery" consumption in historical data is way too low - is it because above calculation goes wrong with the ET340? The MultiPlus seems to be delivering accurate values, but they are not displayed in historical data.

In fact, the system works fine locally with all totals being regulated out. The total power from/to grid value is even visible for the ET340 in VRM.

As software provider myself this all looks very much like a software issue in VRM historical data that could be solved with hardware swap, but maybe shouldn't, because there is nothing wrong with the hardware (proven by intact local regulation). "Just a checkbox" for different calculation missing somewhere. Unless I'm missing some point of course!

I'm looking forward to this discussion, and don't get me wrong, Victron looks like a great ecosystem and we had it set up real quickly - it's the last 10 % of perfection we're working at now - if that involves hardware swap with reasonable arguments, then it might be so.

4 comments
2 |3000

Up to 8 attachments (including images) can be used with a maximum of 190.8 MiB each and 286.6 MiB total.

markus avatar image markus ♦♦ commented ·

Hi,

.) yes, the EM24 does provide detailed per phase information

.) I know this can be misleading. ESS regulation with both meters does work good. The difference is the historical VRM data being correct with EM24, when it is about the sum on the official grid meter and not individual phases energy. In Countries where you pay energy per phase, the opposite is the case, but you should use per phase regulation in ESS menu then.

1644942933238.jpeg

.) yes, this does influence this too


"As software provider myself this all looks very much like a software issue"

Yes - it seems to be easy to solve, but according to mvader, it is not.


"I'm looking forward to this discussion,"

unfortunately - there is not much to discuss, if you want your historical VRM graphs being "correct" you will have to change the meter. There is no other way at this moment.

Best Regards

0 Likes 0 ·
1644942933238.jpeg (96.0 KiB)
kevgermany avatar image kevgermany ♦♦ markus ♦♦ commented ·
Reading between the lines it's more the way the different meters measure and record. But that's guesswork on my part.
0 Likes 0 ·
markus avatar image markus ♦♦ kevgermany ♦♦ commented ·
Yes - you have it right. The only real difference it makes, is the historical data on VRM.
0 Likes 0 ·
ips-ad avatar image ips-ad markus ♦♦ commented ·
Alright guys, so please just add that config checkbox into VRM, how hard can it be :-)


I'm kidding, I guess I'll just swap out the ET340 with a EM24 then. Unless there is a real chance that this is getting fixed in the VRM portal in the next months or so...?!


0 Likes 0 ·