question

bonie-wanda avatar image
bonie-wanda asked

VRM Dashboard Figures don’t add up

I’ve been suspicious about the dashboard data for a while but I’ve made the conclusion that it’s either wrong or I’m reading it wrong.

there is gaps in the data.
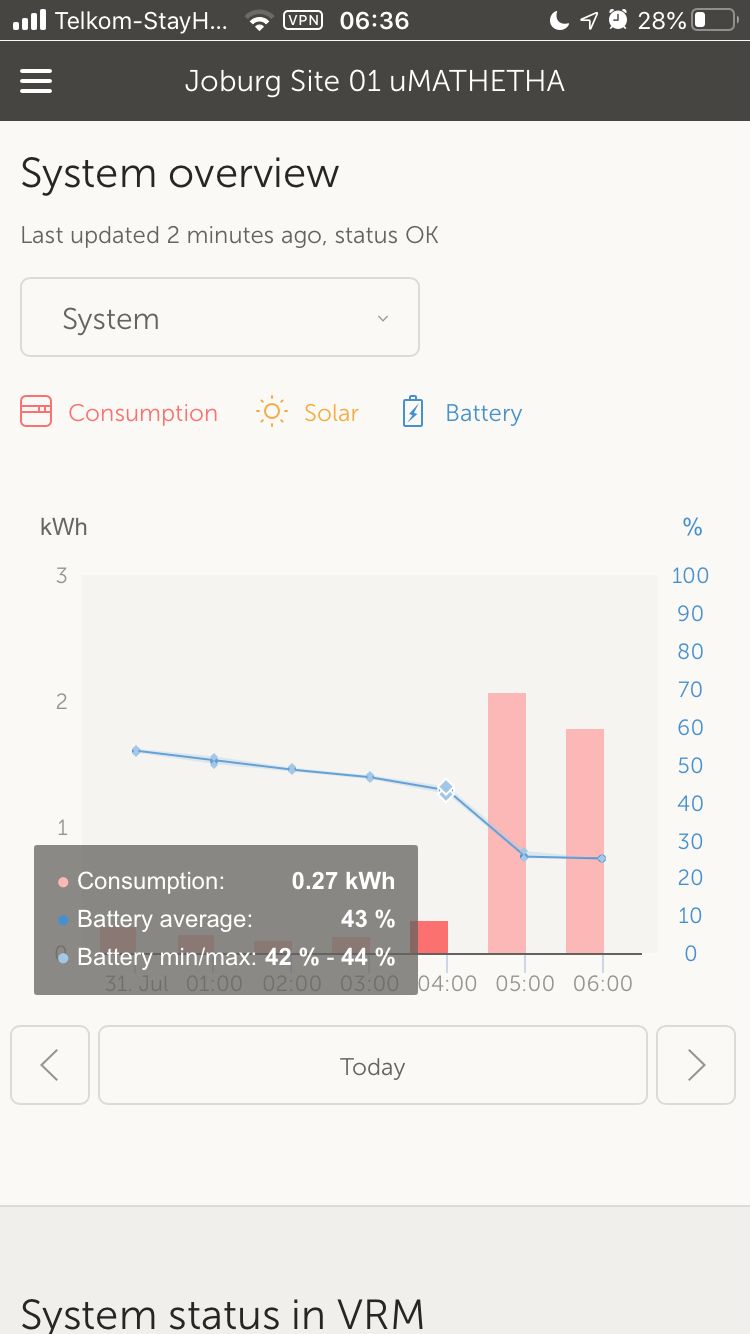
@4-5am the battery SOC readings are 42-44%

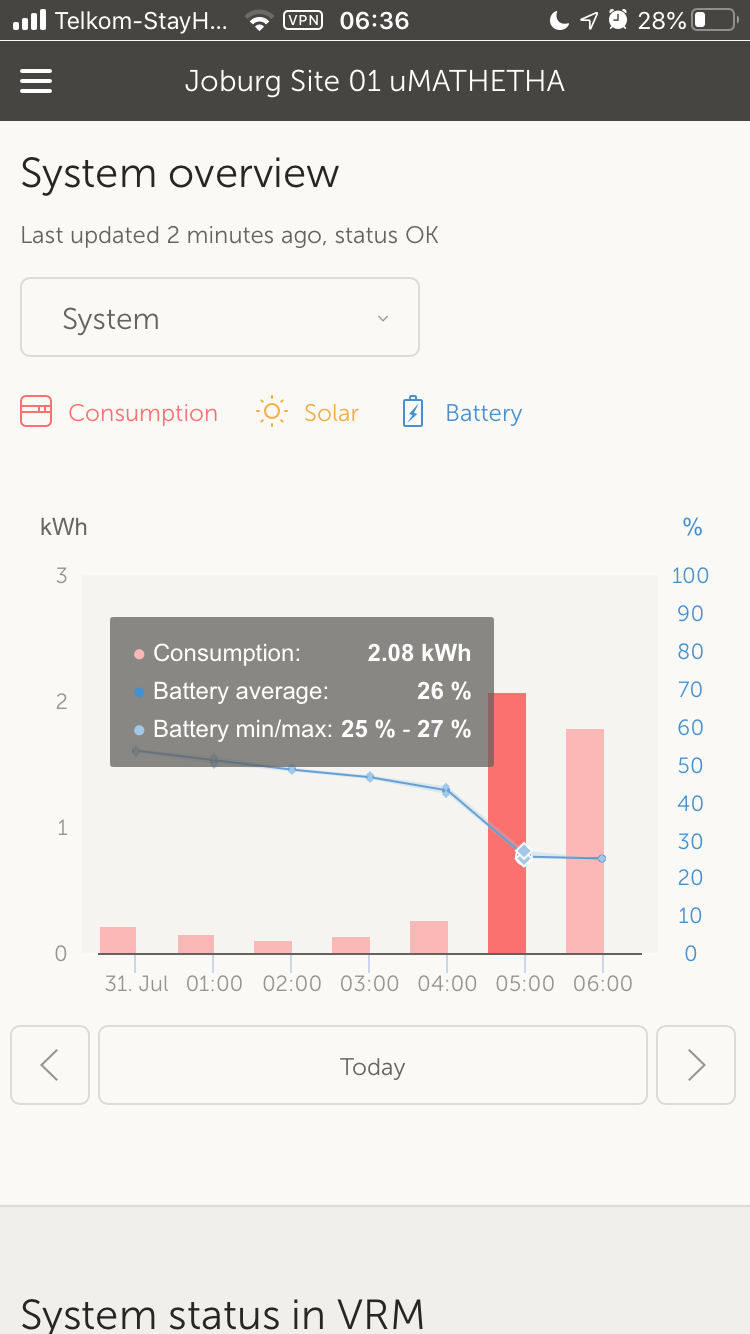
@5-6am the battery SOC readings are 25-27%

What happened to the 28-41%?

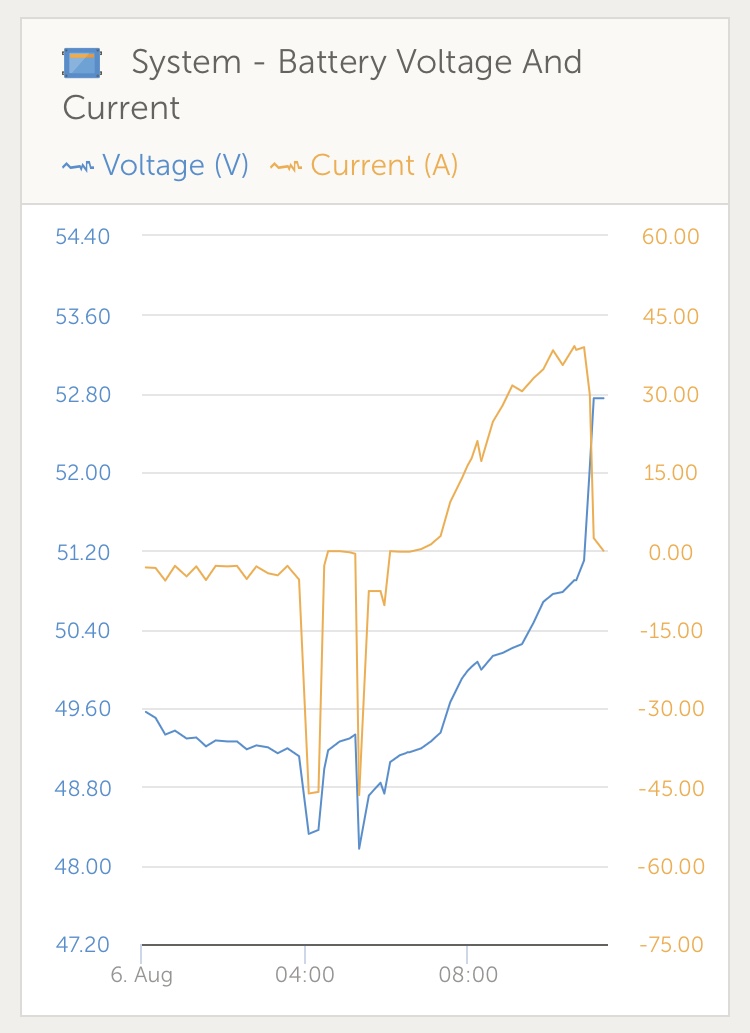
I was watching the console for some time between 5am and 530am when it was reading 39% and down to 32% whilst studying the current draw when the water heater is running.

Please shed some light.


multi ii 48v 3kva VenusGX 2x Pylontech us3000b MPPT 150/45 and MPPT 150/35


VRM
2 |3000

Up to 8 attachments (including images) can be used with a maximum of 190.8 MiB each and 286.6 MiB total.

4 Answers
snoobler avatar image
snoobler answered ·

First, you are hammering the living hell out of your battery. Unless this is an LFP battery, you're going to trash it pretty quickly.


2kWh in an hour? You ran 2kW for a whole hour? Of course your voltage/SoC is going to drop like a rock - unless you have a MASSIVE bank.


The answer is, the data are there. You're just looking in the wrong place. The system overview is WAY too coarse to see the level of detail you need.


You need to go into Advanced option on the left menu. Enable widgets at the far right.


You should have something that yields this:


As you can see, the data are more dense, and you can click and drag to zoom into areas of interest.


This shows the battery voltage and AC output current:

In the above, my fridge is turning on and off. You're likely going to see a huge current spike while your battery voltage drops like a rock.


There will also be a widget to display SoC. I don't have my BMV-700 installed yet, so I can't display that.


1596175788160.png (28.1 KiB)
1596175902502.png (38.7 KiB)
2 |3000

Up to 8 attachments (including images) can be used with a maximum of 190.8 MiB each and 286.6 MiB total.

snoobler avatar image
snoobler answered ·

Would love to see your graph for this time period.

1 comment
2 |3000

Up to 8 attachments (including images) can be used with a maximum of 190.8 MiB each and 286.6 MiB total.

bonie-wanda avatar image bonie-wanda commented ·


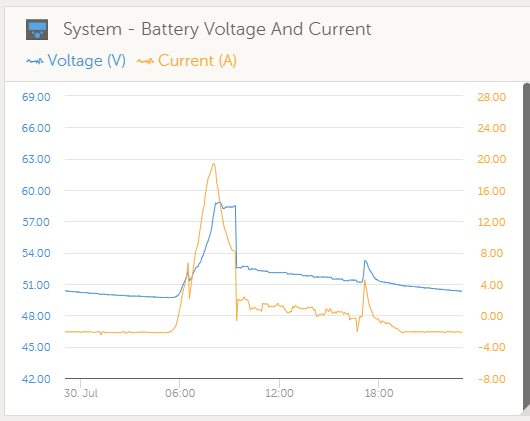
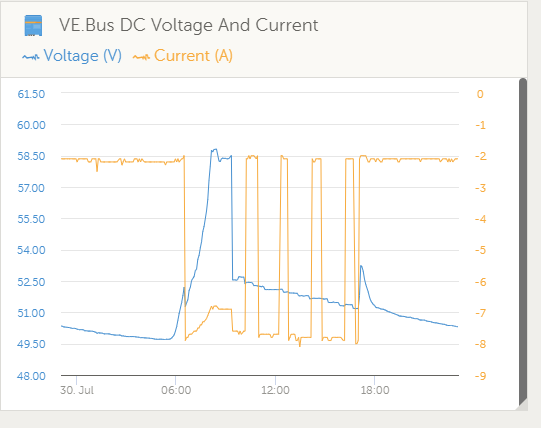
It’s ok. I think the discharge current within recommendations.
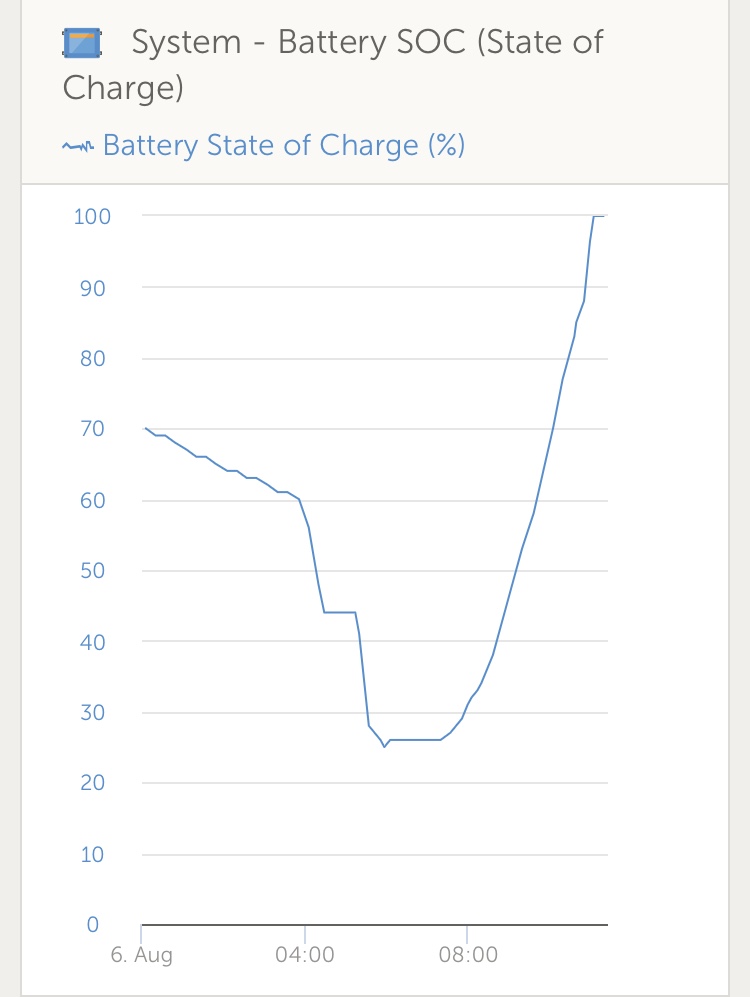
the bank is 2x 3.5kwh LFPs... the discharge current is limited on ESS but also by the inverter as it is small.

The inverter is 2,400watts but the water heater (MAIN_DB-connected) is 3,300watts. with grid set point at 10watts the ESS pushes back some battery or PV power when available within limits

0 Likes 0 ·
bonie-wanda avatar image
bonie-wanda answered ·

I’m just concerned that the dashboard System Overview which is a landing page does not reflect the true state of affairs.

The Battery Min/Max SOC is the problem for me. it does not flow. Is has gaps.


2 |3000

Up to 8 attachments (including images) can be used with a maximum of 190.8 MiB each and 286.6 MiB total.

Guy Stewart (Victron Community Manager) avatar image
Guy Stewart (Victron Community Manager) answered ·

Hi @Bonie Wanda

It might be worth looking deeper into the Advanced Tab of VRM, you will see much higher resolution data there, which will help you better understand your system.

What you are seeing here can occur if the state of charge is reported by a 3rd party BMS (e.g. a lithium battery), and that BMS does a large recalibrating jump in the state of charge that it is reporting to the VRM around the time of new hour / reporting period in the dashboard display.

I would expect if you look into the Advanced tab, you will see that around 4:50 to 5:10, there is a very large load on the system, a correspondingly large drop in battery voltage and a sudden drop in reported State of charge from the battery's BMS.

The dashboard overview is intended as a quick 'at a glance' view of the system, but when investigating details, the Advanced view is really the way to go.

If you would like to learn even more about how VRM works, and even to download the data point by point that we use to generate the graphs, you can do the VRM training at https://professional.victronenergy.com/online-training/

2 |3000

Up to 8 attachments (including images) can be used with a maximum of 190.8 MiB each and 286.6 MiB total.

Related Resources

Additional resources still need to be added for this topic