I would like to be able to see the how many kW I have bought from the grid compared to how many kW I have sold to the grid within a period I select. Is there a way in VRM to do this?
I have also been looking for a solution.
Let me state up front that I have 3rd party MPPT's, so I don't have some of the visibility that Victron MPPT's afford.
But, likewise I'd like to have a historical record and be able to view stats remotely. So I've being looking into this. I have come up with two probable solutions, neither of which I have finally installed, but for what it's worth:
Bi-directional kWh meters that have two independent pulses for export and import, these would feed into 2 "pulse meter" inputs of the Venus. You'll have to live with knowing that the chosen SI unit actually means kWh though. This would record import and export independently.
Alternatively, two cheap export pulse only meter could be used, and just reverse the current through one of them.
To that end, as far as bidirectional meters go:
Eastron do an off-the-shelf single phase meter that is capable, and can do a 3ph version if requested when ordering.
Then you'll get your stats by drilling into VRM.
However, I am trialing a 3ph meter from www.iammeter.com (No affiliation).
I have this hooked up to my WIFI at present, but it also has a GSM/GPRS modem attachment, (which I have but haven't tested yet).
Pretty rudimentary and limited app (in defence, it is very new), but I can see import/export stats per chosen time period on the web, and on my phone, (5min updates I think?).
Which is what I want.
There is very limited email consumption (only) alerts, but there are some nice historical graphics.
I think this is the route I am going to choose.
There are CT solutions a single phase solutions as well. There is a live demo running on the site for those that are interested.
As a footnote:
I think aggregating the numbers is more than a nice-to-have, I think it's a fundamental requirement.
After all metering and billing isn't done on a daily basis. It is an aggregate of usage/production over time.
Hi @Carlo,
There are some tools already in VRM that can help with what you are trying to do. Though I think with the right feedback and thinking, they could be further improved.
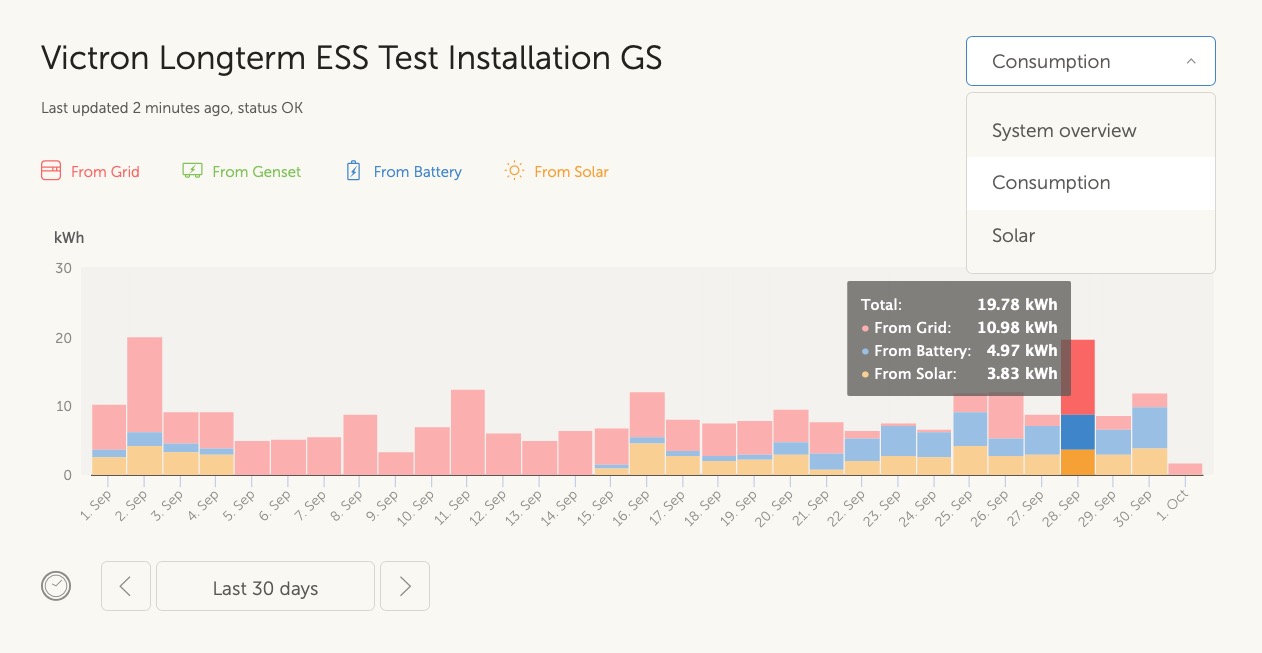
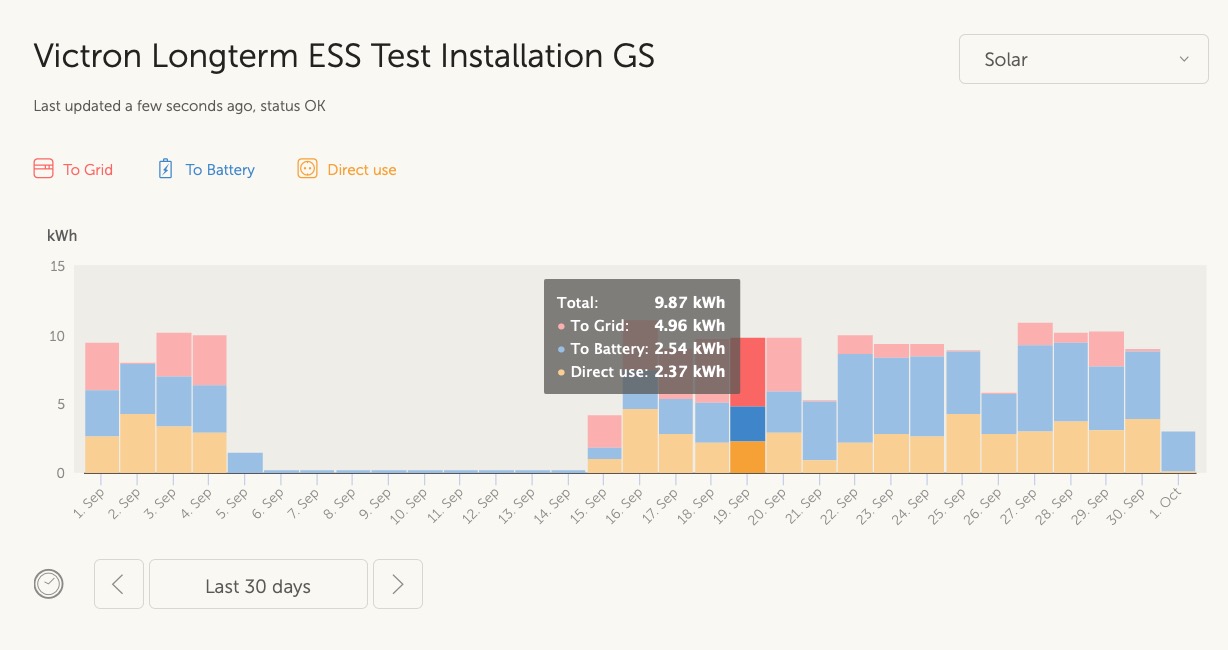
Firstly, selecting the Consumption and Solar pulldown menu's in the Overview section.
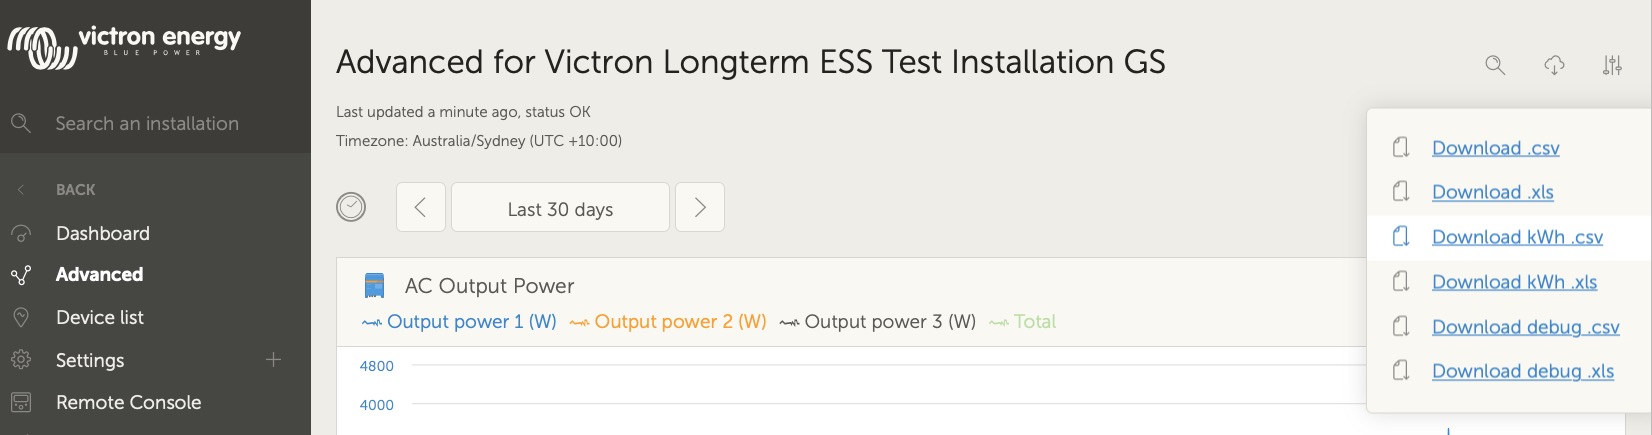
The other useful feature is the kWh export feature, this is located in the Advanced section, in the top right.