I have 4 temperature probes, displaying ok in VRM dashboard tab but no graph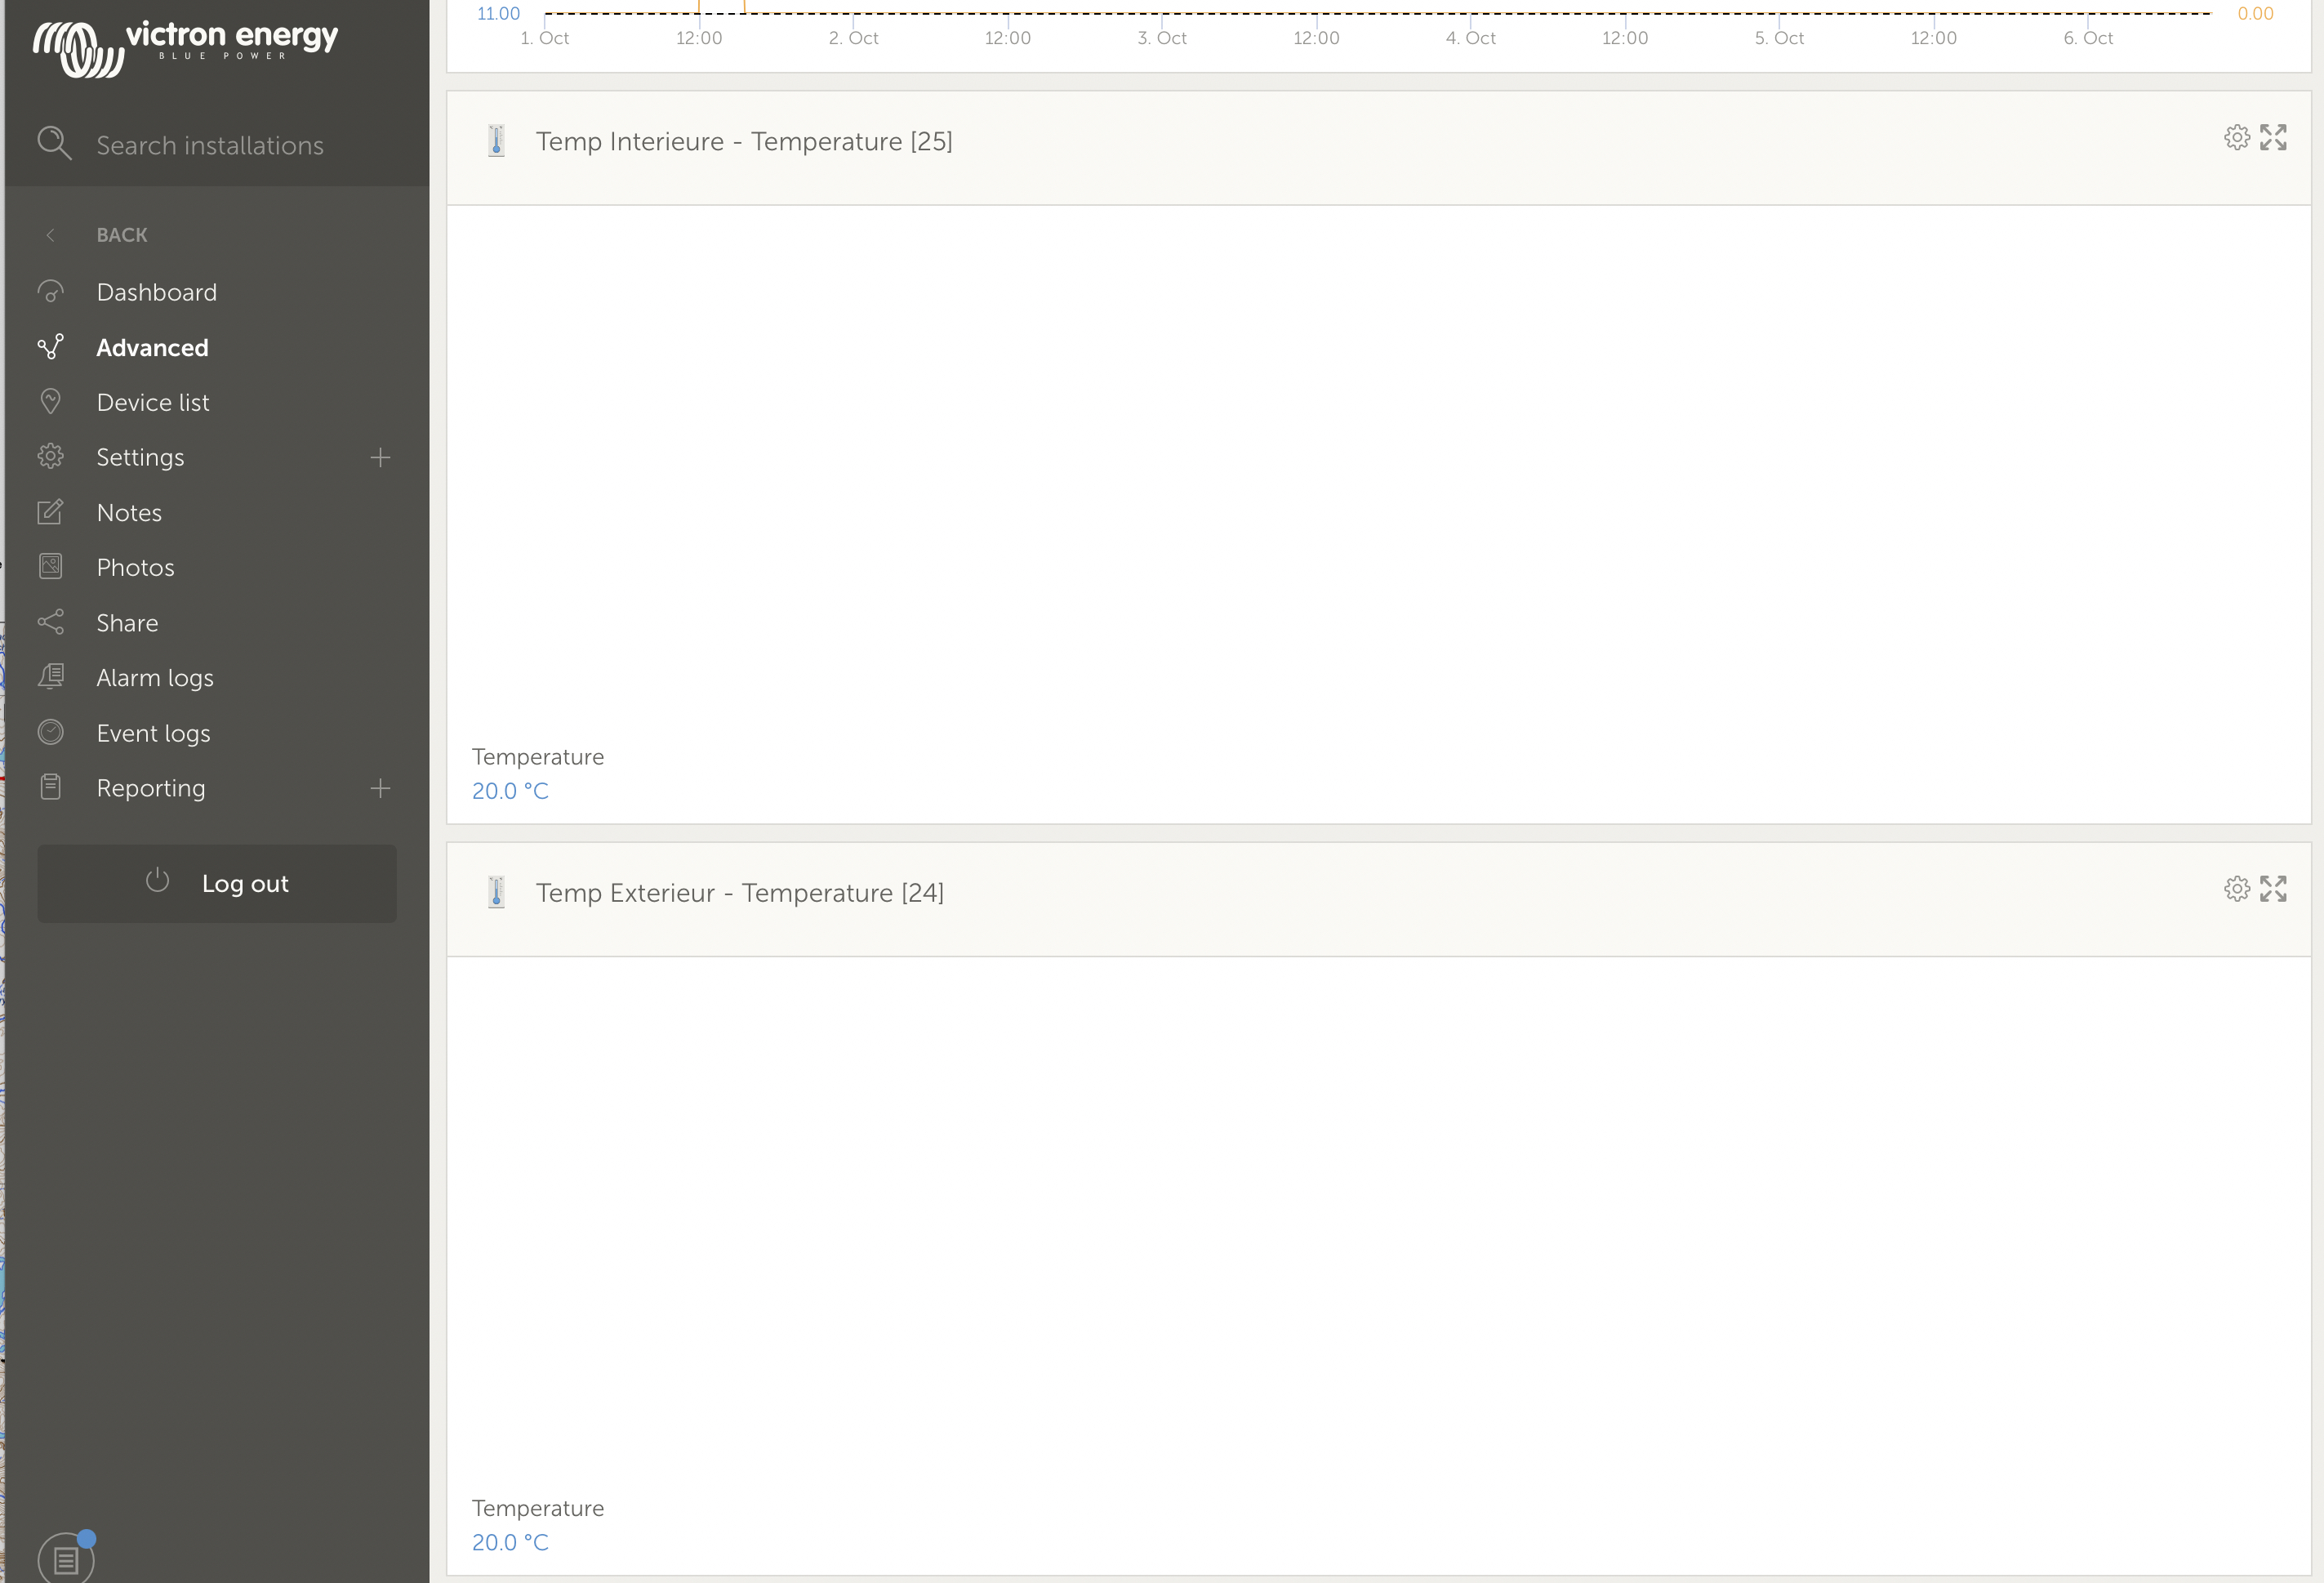 in VRM advanced tab
Used to work, but today nothing appear
Cerbo 3.10
thank you for your help
I have 4 temperature probes, displaying ok in VRM dashboard tab but no graph in VRM advanced tab
Used to work, but today nothing appear
Cerbo 3.10
thank you for your help
It was reported a few days ago
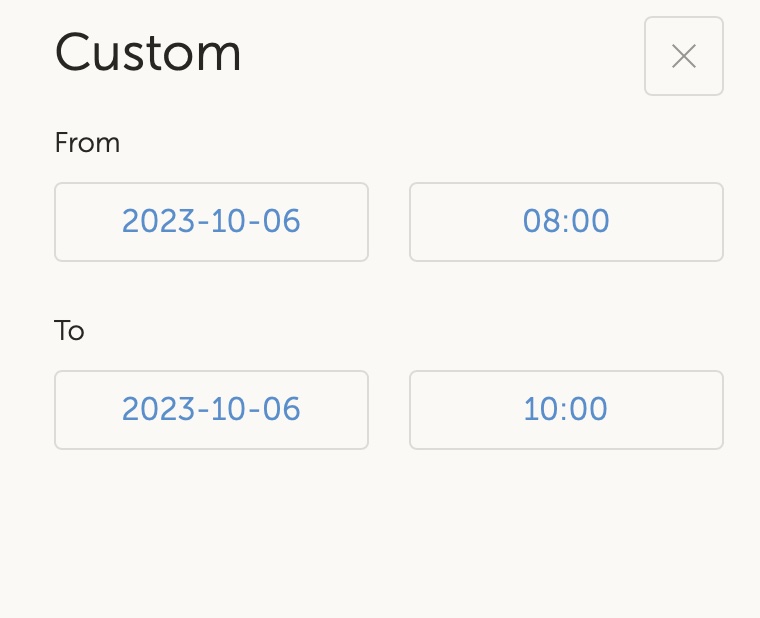
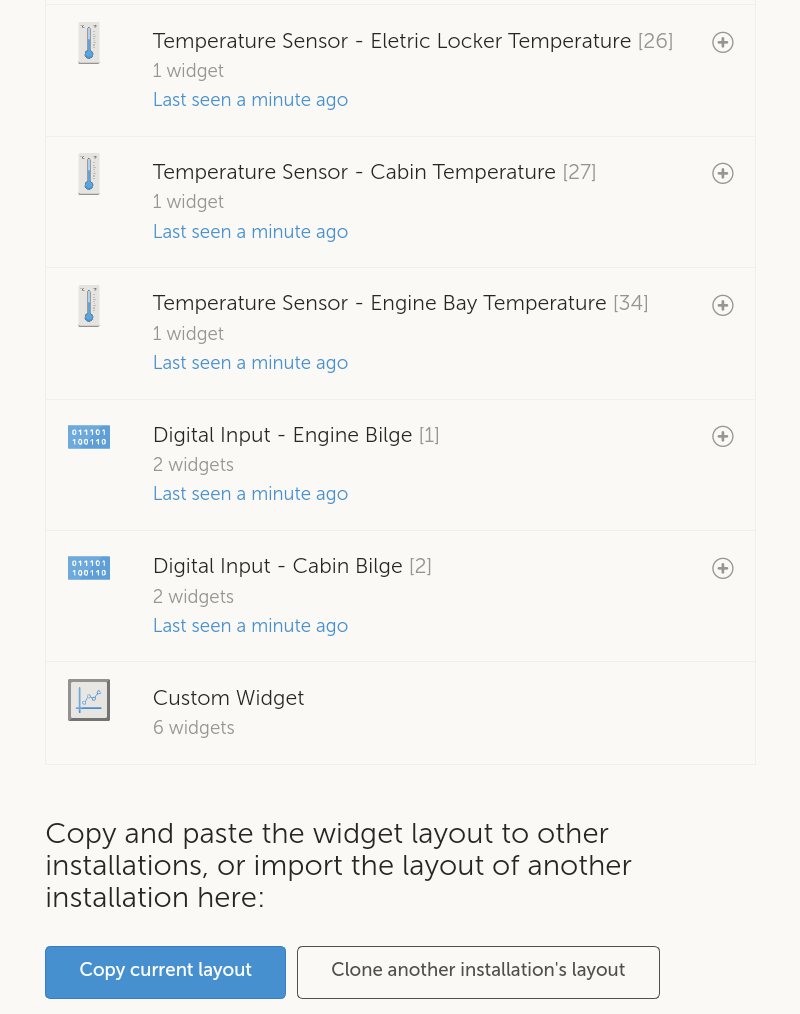
A work around right now is make a custom graph and the information appears there.