question

regan avatar image
regan asked

VRM Dashboard bug, values are stuck

Every few days, my VRM dashboard values get frozen in time showing the same values on the APP and on the browser dashboard.

If I refresh the screen, the correct values flash for an instant and then revert to the same stuck values. The little built in graphs under the values do change and reflect correctly (can see solar input through the day while the numerical value says 0 all day).


Advanced graphs and the Cerbo screen itself as well as remote console show the correct realtime data.


The only way I've been able to "fix" it is to restart the Cerbo, somehow that causes an update in VRM that clears out the stuck value.


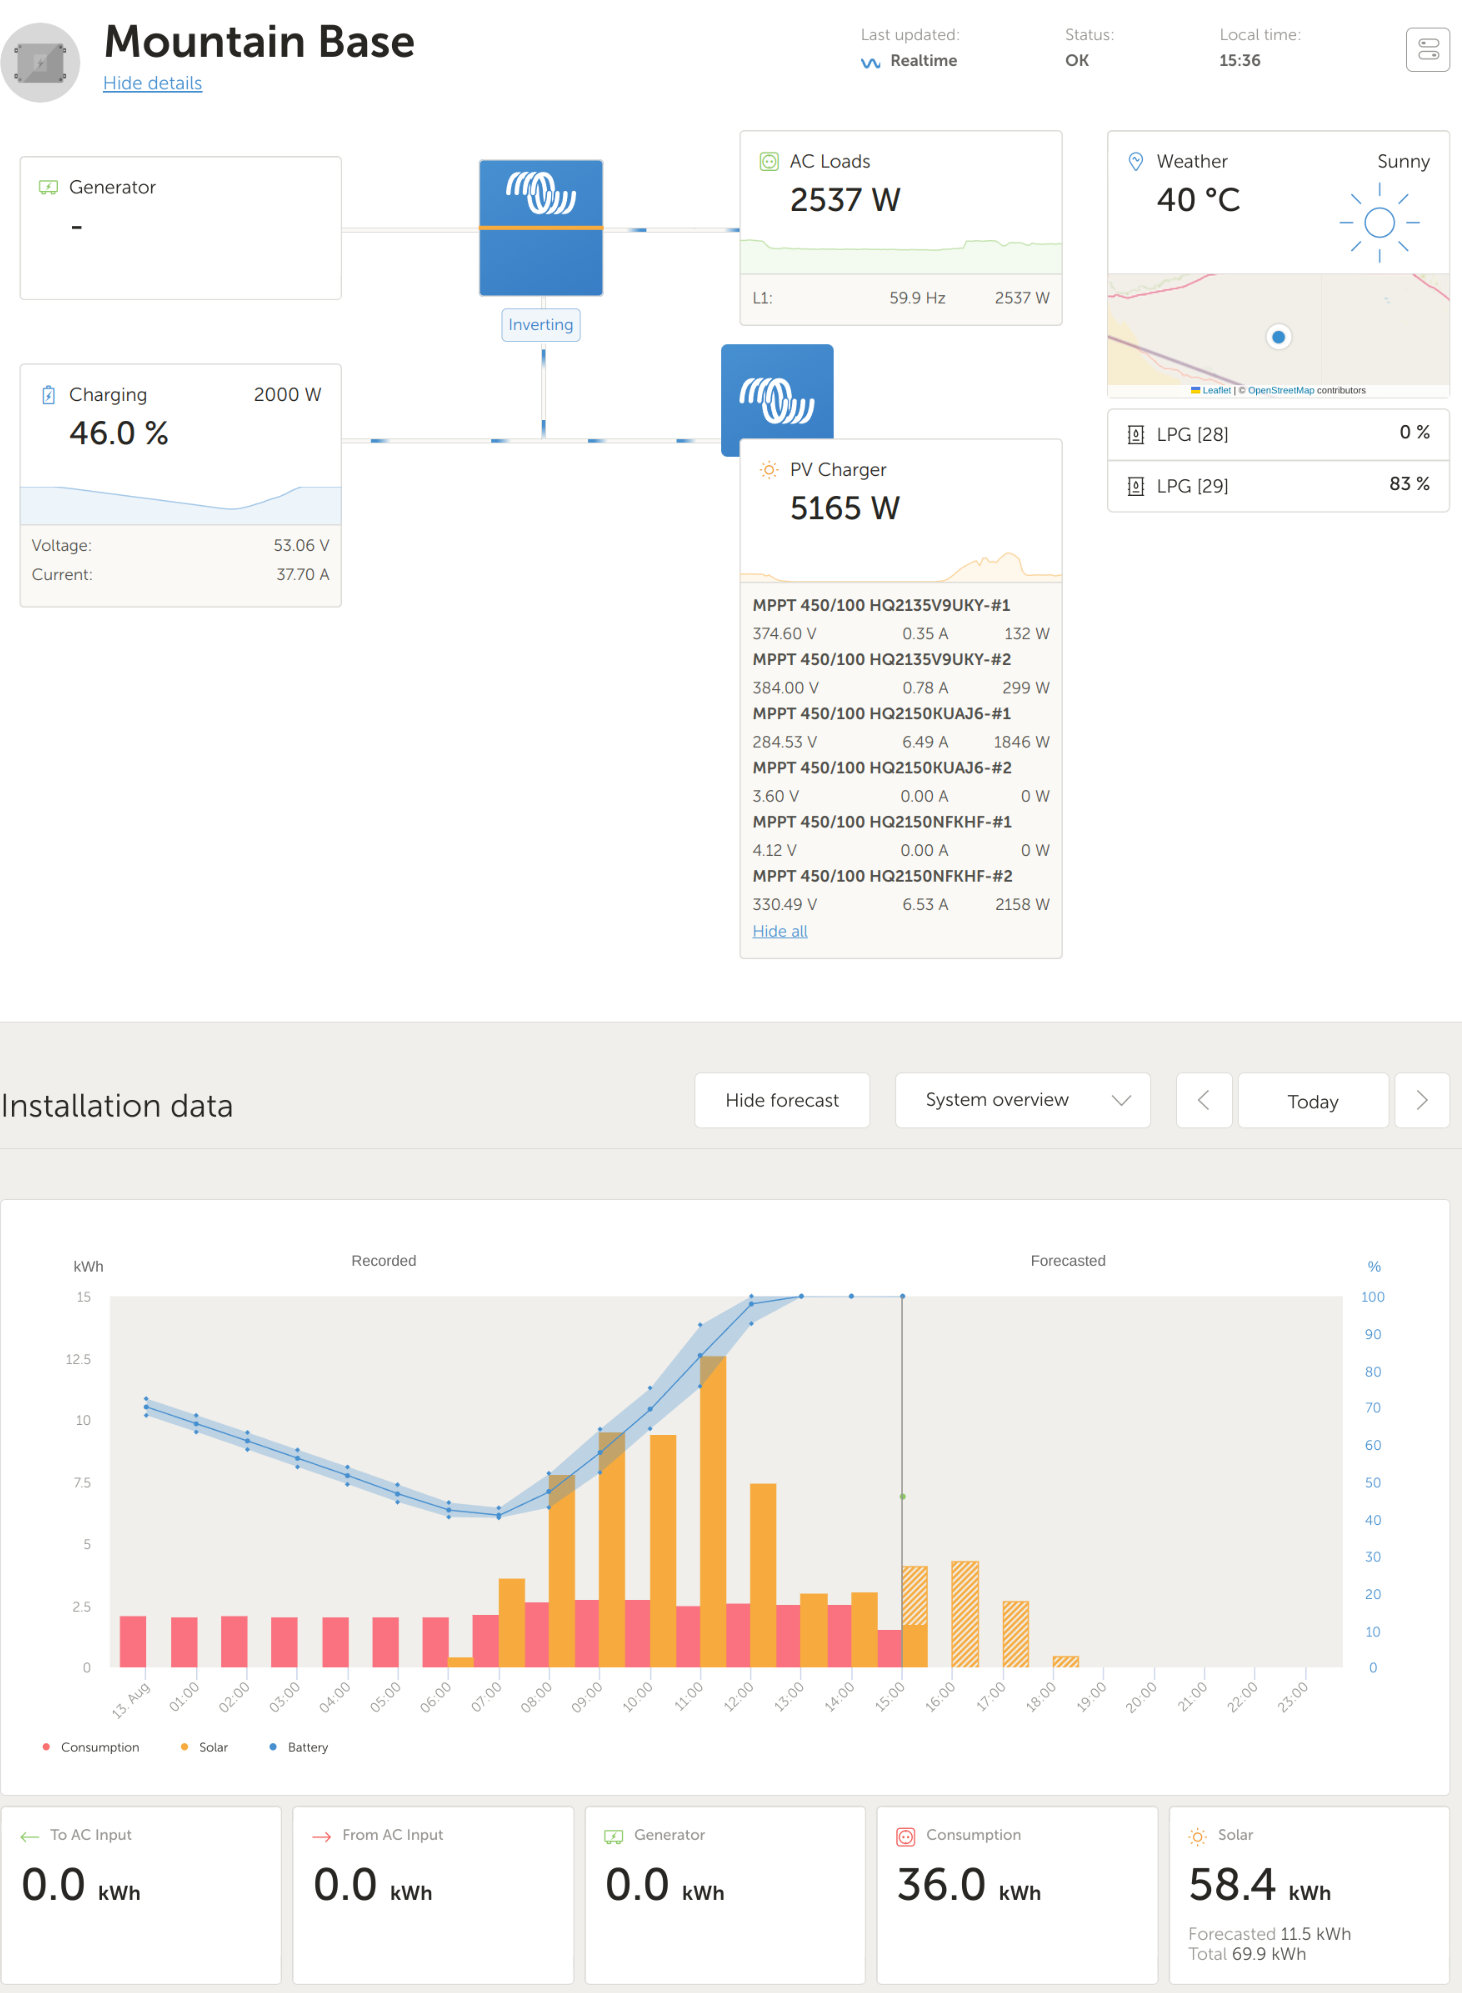
Here's a screen record of refreshing the dashboard, you'll see the initial load frame has the real values and then it reverts to the same stuck values.

Here's the "All installations" bar upon first logging in:

screenshot-from-2023-06-10-14-48-43.png


After I go to the home dashboard and go back to the All installations page, it always reverts to this identical value. Same battery SoC%, Voltage and Grid/Load valuesscreenshot-from-2023-06-10-14-49-13.png

VRMbug report
4 comments
2 |3000

Up to 8 attachments (including images) can be used with a maximum of 190.8 MiB each and 286.6 MiB total.

mvader (Victron Energy) avatar image mvader (Victron Energy) ♦♦ commented ·
Hi @regan , noted; will be/is being looked into.

What computer do you have and what browser?

0 Likes 0 ·
regan avatar image regan mvader (Victron Energy) ♦♦ commented ·
I am using Firefox on Linux, but it doesn't seem to be browser or OS dependent, as trying using Chrome and Firefox on a Windows PC yields the same results (and identical values).

The VRM app (and dashboard widget) on Android reports the same values as well.


Having left it alone for more than a day, I find it interesting that the frozen values updated to another value from overnight, same results as before with refreshing showing a split second of the correct value, but now the values it sticks to are different. Instead of 17688w grid and 39% battery, its now stuck on 17859w grid and 99% battery which occurred around 2am.

The 39% from the previous day occurred around 5am. I'm not seeing any other triggers for it.


0 Likes 0 ·
regan avatar image regan mvader (Victron Energy) ♦♦ commented ·
Hi @mvader (Victron Energy) , the issue is active now in my instance, would anyone on your team like to look into it in realtime before it gets reset?


I could do a remote desktop session if the issue is not present on your end of things.


Thank you


0 Likes 0 ·
mvader (Victron Energy) avatar image mvader (Victron Energy) ♦♦ regan commented ·
Hi @regan , Nicolae has diagnosed the system up to the point where someone else need to take over.


But that will be next week I'm afraid.


It would be great if you could leave it in the state that it is in now; and if not possible then we'll just see next week.


Thank you for the help in this and have a good weekend, Matthijs

0 Likes 0 ·
2 Answers
Nicolae Mihalache (Victron Energy Staff) avatar image
Nicolae Mihalache (Victron Energy Staff) answered ·

Hi @regan,

I could not reproduce the problem, it seems that the mqtt connection disconnects out.

Could you please share with us a screenshot of the console? https://balsamiq.com/support/faqs/browserconsole/#mozilla-firefox

2 comments
2 |3000

Up to 8 attachments (including images) can be used with a maximum of 190.8 MiB each and 286.6 MiB total.

regan avatar image regan commented ·
I surely can once it becomes stuck again, I had restarted the Cerbo so I could monitor usage during a thunderstorm last night. (or would it be of any use when it's working normally?)


I think the best action would be to have you log into my instance while it's stuck. It takes anywhere from 1 day to 5 days to occur again. I'll post an update once it happens again.


To clarify though, it's understood that the stuck values remain consistent (exact same wattage values and such) across vrm app, vrm widget, browser dashboard on any browser on any OS and even after logout/login of vrm. And the "fix" is rebooting the CerboGX itself even though the Cerbo screen shows accurate values.

All graphs in Advanced show up-to-date values and are accurate. As well as the initial load (the first frame) is accurate and during the first value refresh it reverts to the old value.

In the case of my video clip the other day, the Grid wattage of 17688w gets shown to me on the android app and dashboard after it refreshes and is always 17688w until I restart the Cerbo. And goes back to 17688w even on a new browser that has never connected to VRM before.


The key thing for me is what is different from the little graphs under each Grid/Load/PV/Battery box on the dashboard and the initial page load vs the value updates?


0 Likes 0 ·
regan avatar image regan commented ·

Hi, it is finally stuck again. Please let me know how we can investigate this in realtime.


My browser console remains empty when I refresh the page with the vrm dashboard.


VRM Portal ID 48e7da869b45

0 Likes 0 ·
alexdrean avatar image
alexdrean answered ·

Same problem here. Values are ok when first refreshing, but immediately get stuck to some previous value. Restarting the cerbo fixes the issue temporarily.
VRM id 102c6b860e70

1691966298980.png

1691966254826.png


1691966254826.png (333.1 KiB)
1691966298980.png (239.2 KiB)
1 comment
2 |3000

Up to 8 attachments (including images) can be used with a maximum of 190.8 MiB each and 286.6 MiB total.

regan avatar image regan commented ·
Staff from victron connected to my Cerbo remotely and was able to diagnose and fix the issue. From what I understand, the fix will be in the next firmware update.

I have not had a single glitch with it getting stuck since they applied their fix.


1 Like 1 ·

Related Resources