question

mija avatar image
mija asked

VRM showing incorrect live data on dashboard

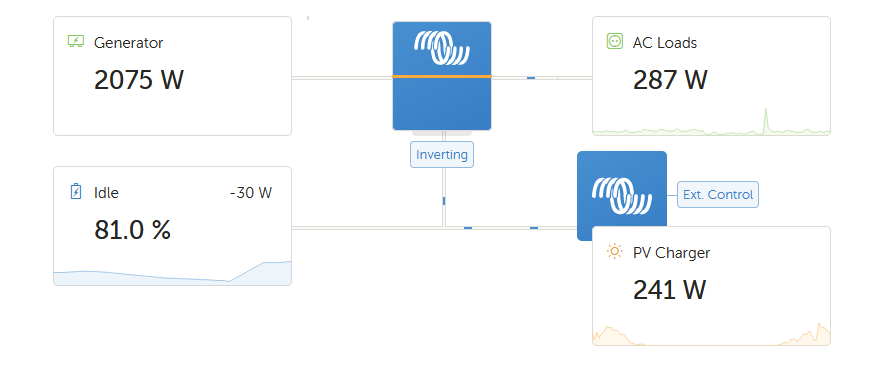
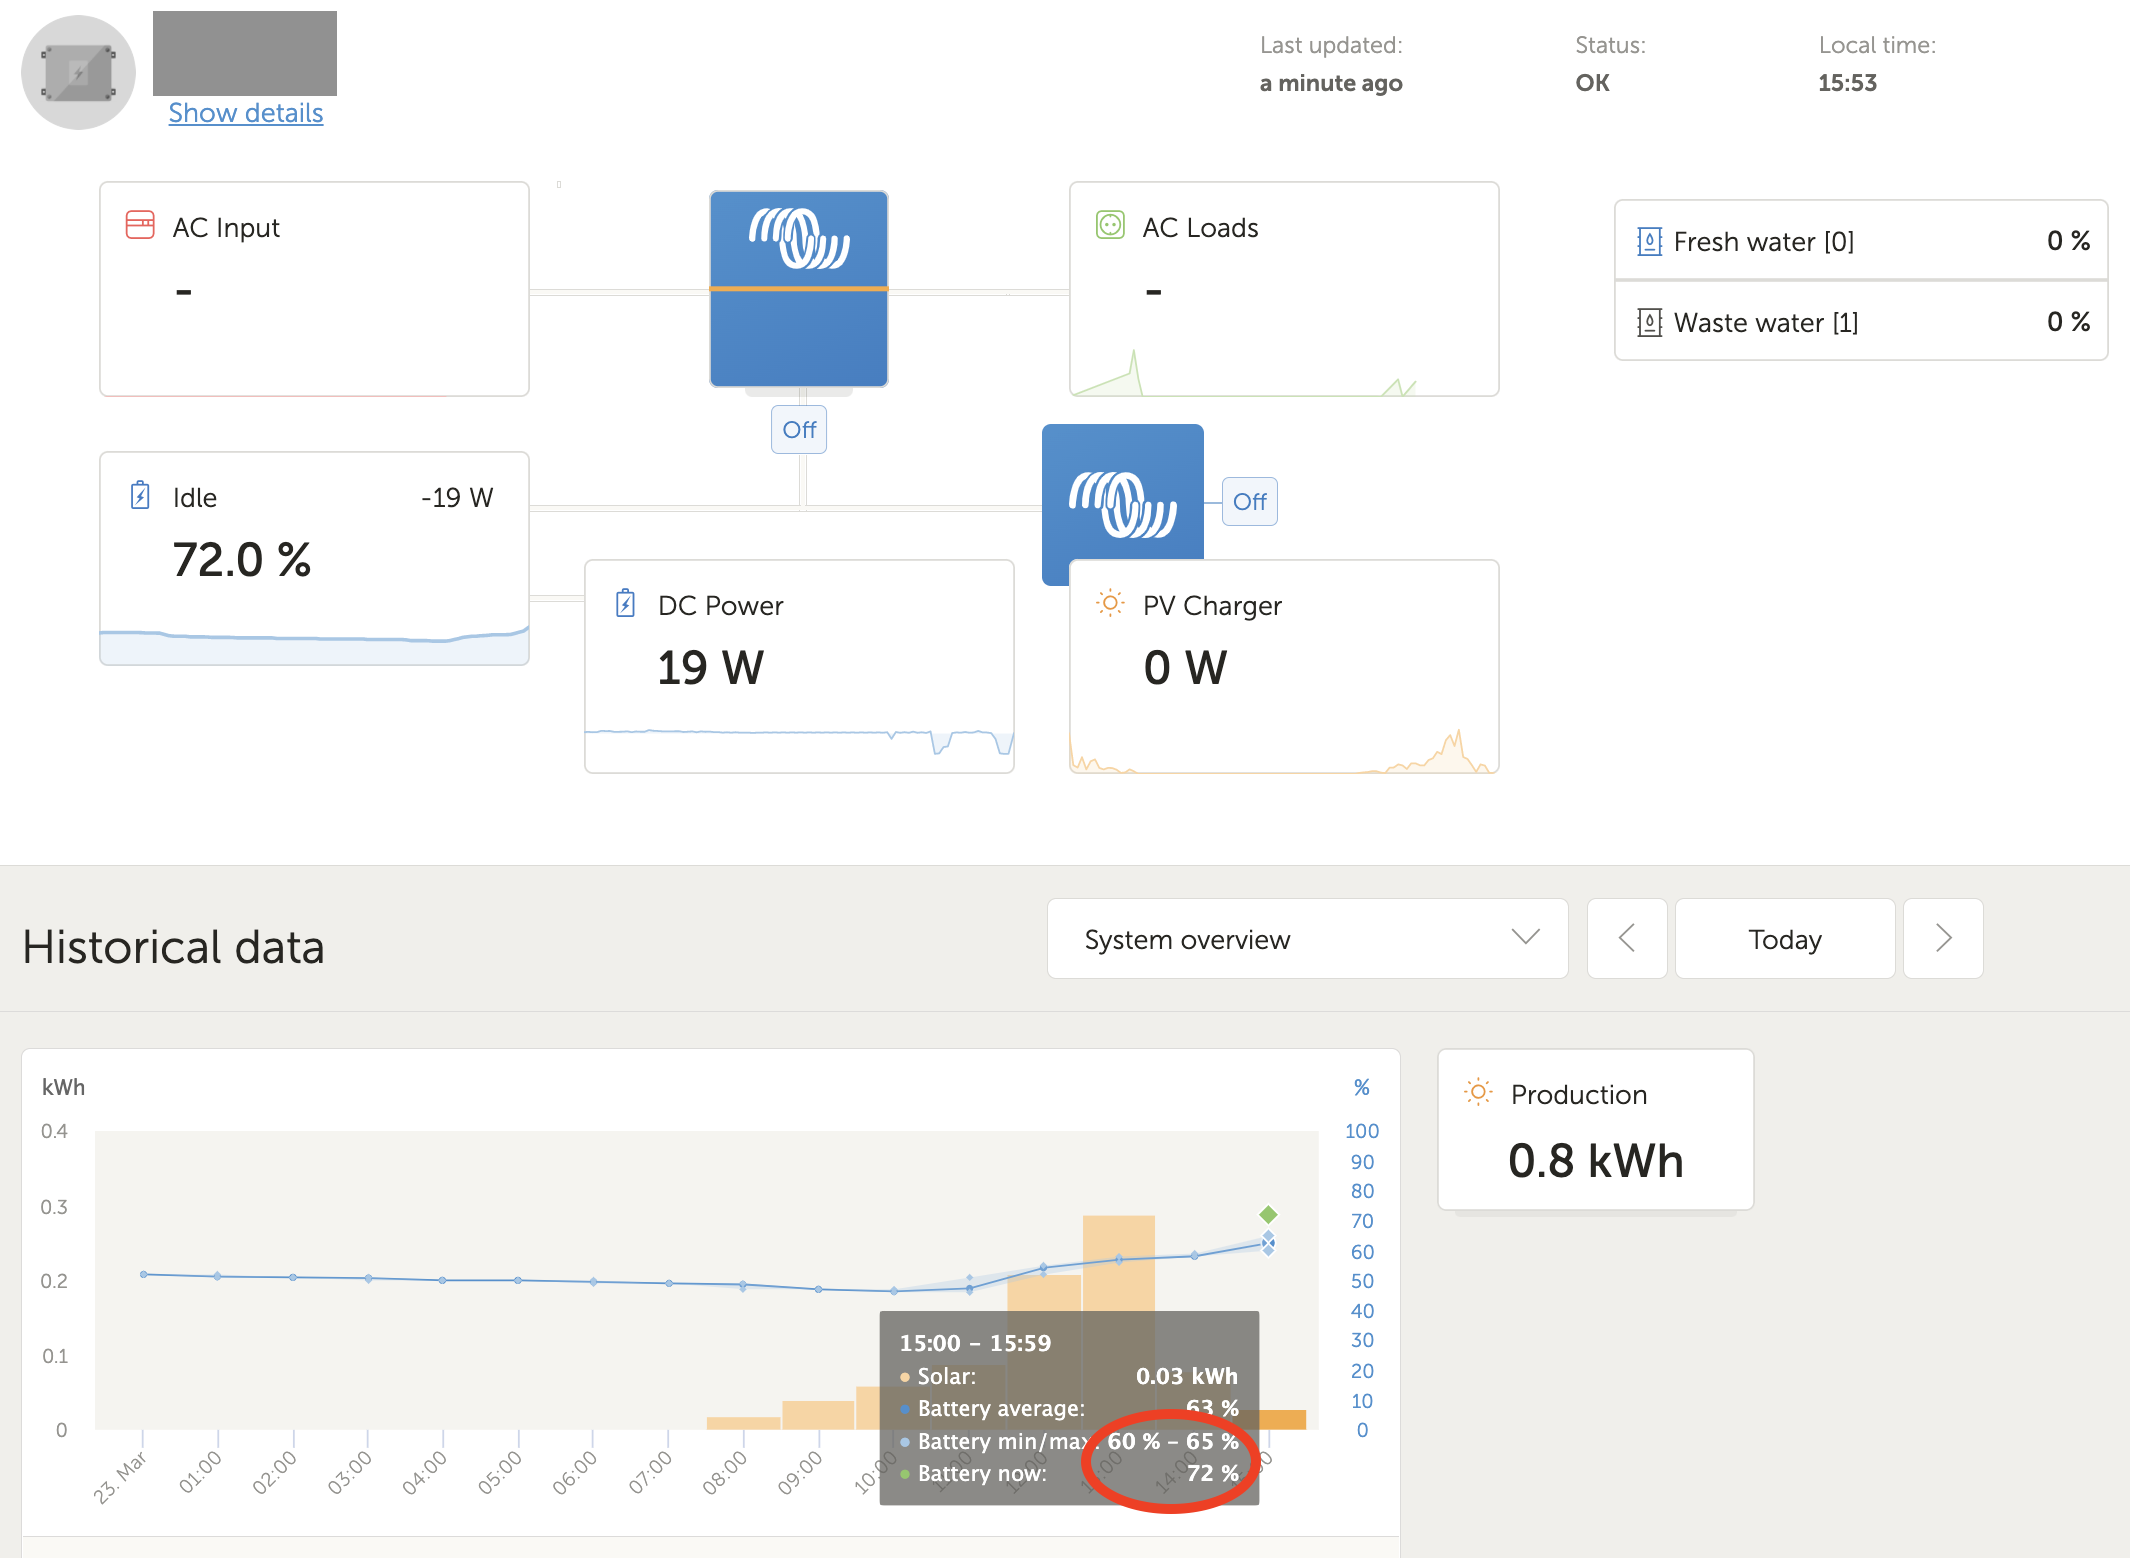
I have a CCGX (v2.73) configured to log data to VRM every 5 minutes over HTTPS. When loading the installation via the VRM website, the dashboard very briefly shows current data:

1648004548973.png

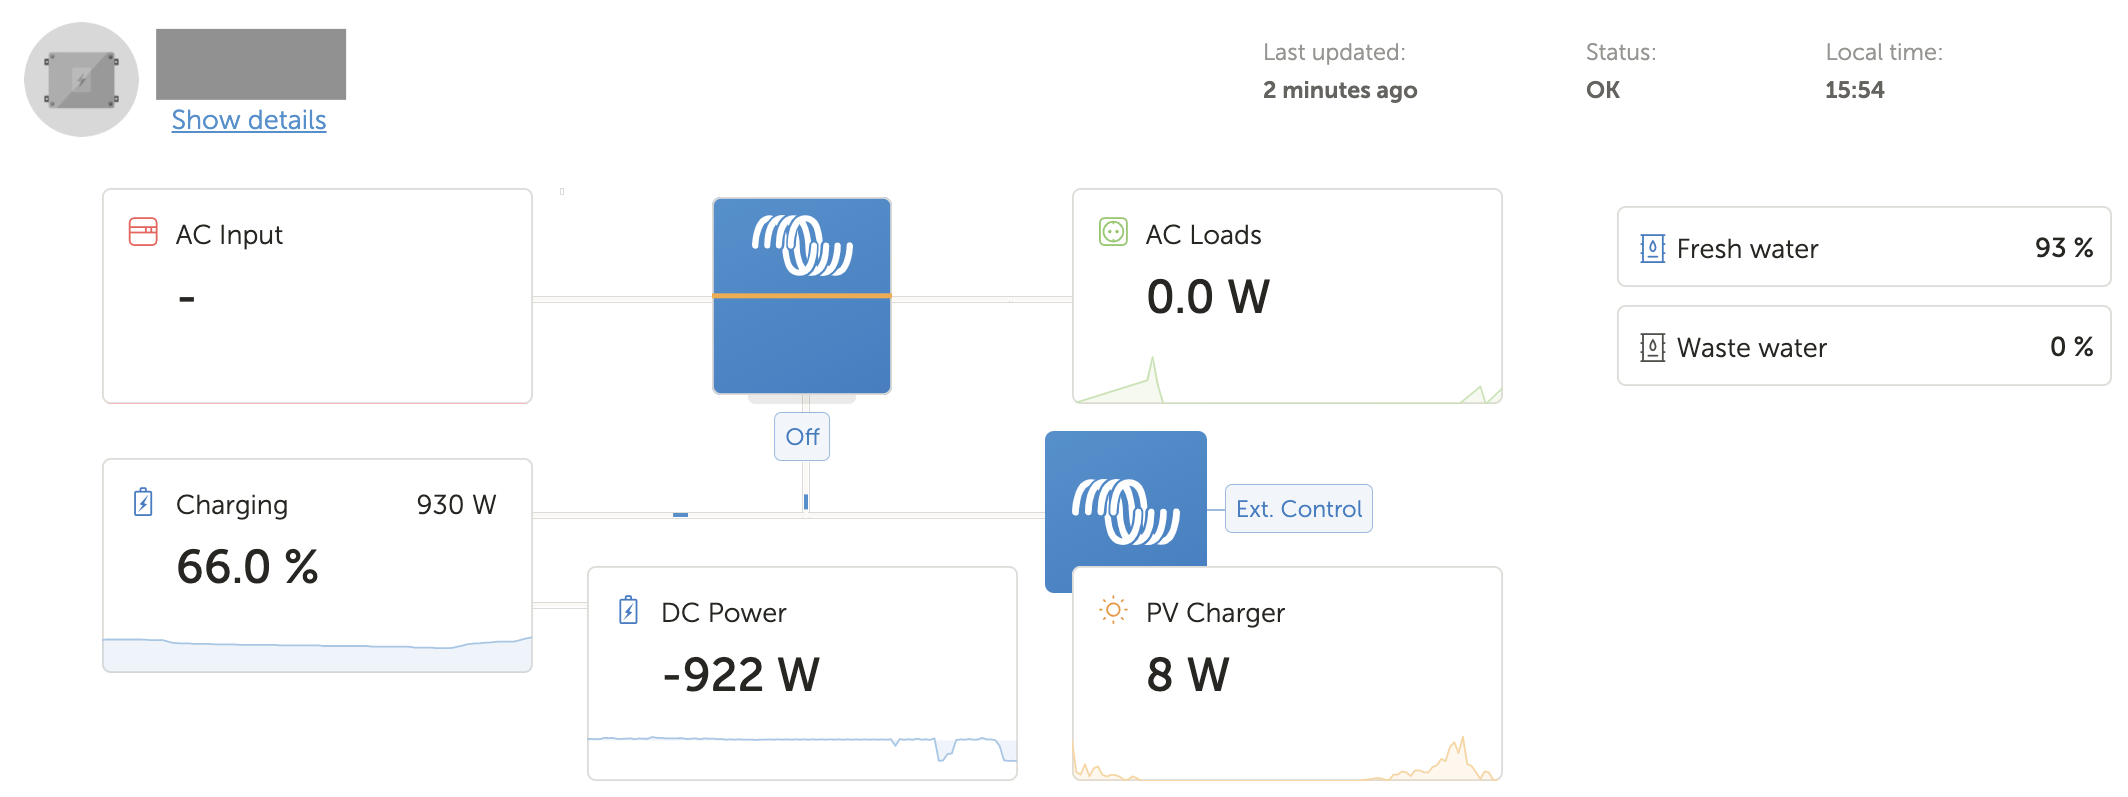
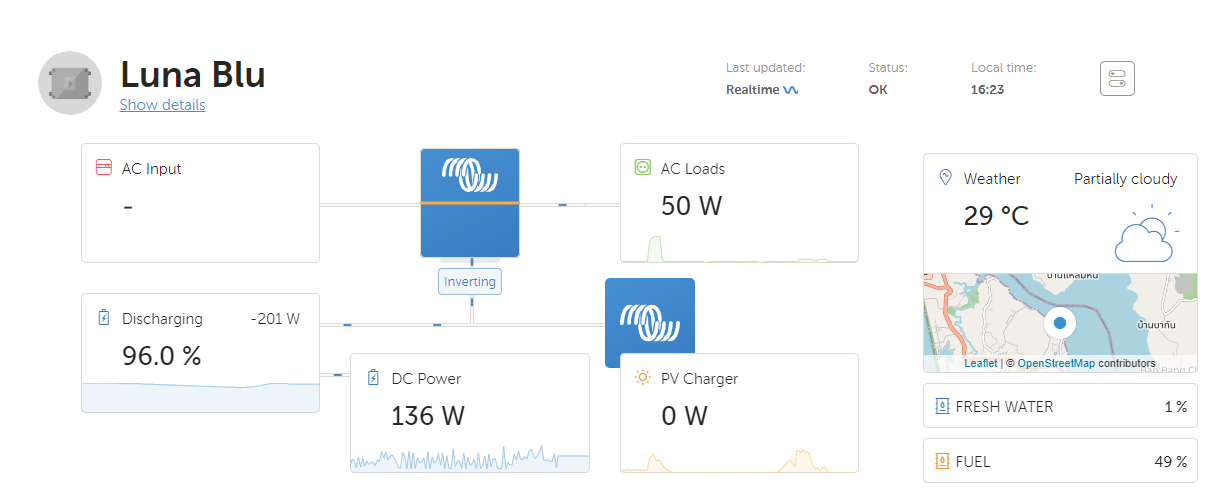
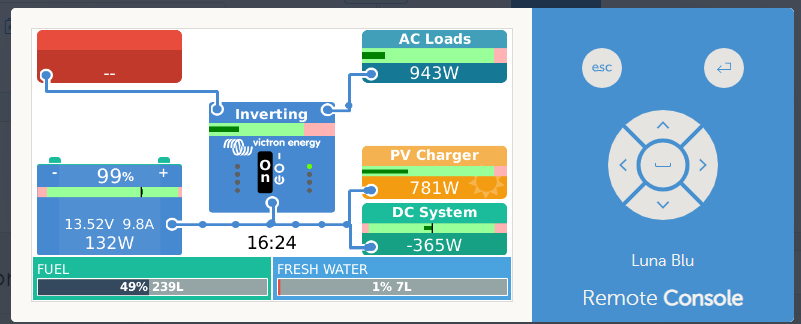
But a few seconds after loading, it reverts to showing something else. I guess this might be previous data, or some example data? For example SOC shows 72%, but the historical data graph below the dashboard shows correct SOC:

1648004615442.png

All the graphs/data in the Advanced section of the VRM portal show correct data. I see the same behaviour via the VRM iOS app. I have checked the GX's timezone and clock, and both are correct.

It seems like something is "stuck" with the installation in VRM; is someone from Victron able to check VRM for my installation? Thanks!

VRMCCGX Color Control
1648004548973.png (184.6 KiB)
1648004615442.png (305.4 KiB)
1 comment
2 |3000

Up to 8 attachments (including images) can be used with a maximum of 190.8 MiB each and 286.6 MiB total.

pieter-janson avatar image pieter-janson commented ·
I have this exact same problem. How do I fix it?
0 Likes 0 ·
4 Answers
steve-smith avatar image
steve-smith answered ·

I am having a similar problem, due to bad weather I started my generator and, of course, it showed up on my dashboard and via the API. The problem is that even after the generator is switched off it is still showing on the dashboard and via the API

This has only been happening for the last few days

You will see that the system knows the generator is not active but it does not get cleared from the dashboard


1648040361864.png


1648040361864.png (41.5 KiB)
2 |3000

Up to 8 attachments (including images) can be used with a maximum of 190.8 MiB each and 286.6 MiB total.

kevgermany avatar image
kevgermany answered ·

There have been quite a few enhancements recently. You might have found a bug. I'll report it for you. Please update the thread in a new post if anything changes.

2 |3000

Up to 8 attachments (including images) can be used with a maximum of 190.8 MiB each and 286.6 MiB total.

lunablu avatar image
lunablu answered ·

Not an answer, but in recent days (June 2022) i've faced the very same problem.

Dashboard showing incorrect data (Same data for weeks) whereas my remote console screen is showing live accurate data.

Has there been a fix offered yet for this "bug"?

1655889834014.png


1655889896837.png


1655889834014.png (92.2 KiB)
1655889896837.png (47.1 KiB)
2 |3000

Up to 8 attachments (including images) can be used with a maximum of 190.8 MiB each and 286.6 MiB total.

mija avatar image
mija answered ·

I've just upgraded the CCGX to v2.89 after being in the same location for long enough to deal with any issues. After the upgrade, I also deleted the installation from VRM which said all data in the database would be deleted. Adding the CCGX back to VRM looked like it had solved the problem, but now the SOC is reverting to 72% again.

This is quite frustrating - does anyone know what the cause might be?

2 |3000

Up to 8 attachments (including images) can be used with a maximum of 190.8 MiB each and 286.6 MiB total.