question

Mike avatar image
Mike asked

Cerbo over reading grid export.

img-1056.png

I have a AC coupled solar system.

It was all working well until I did an update..

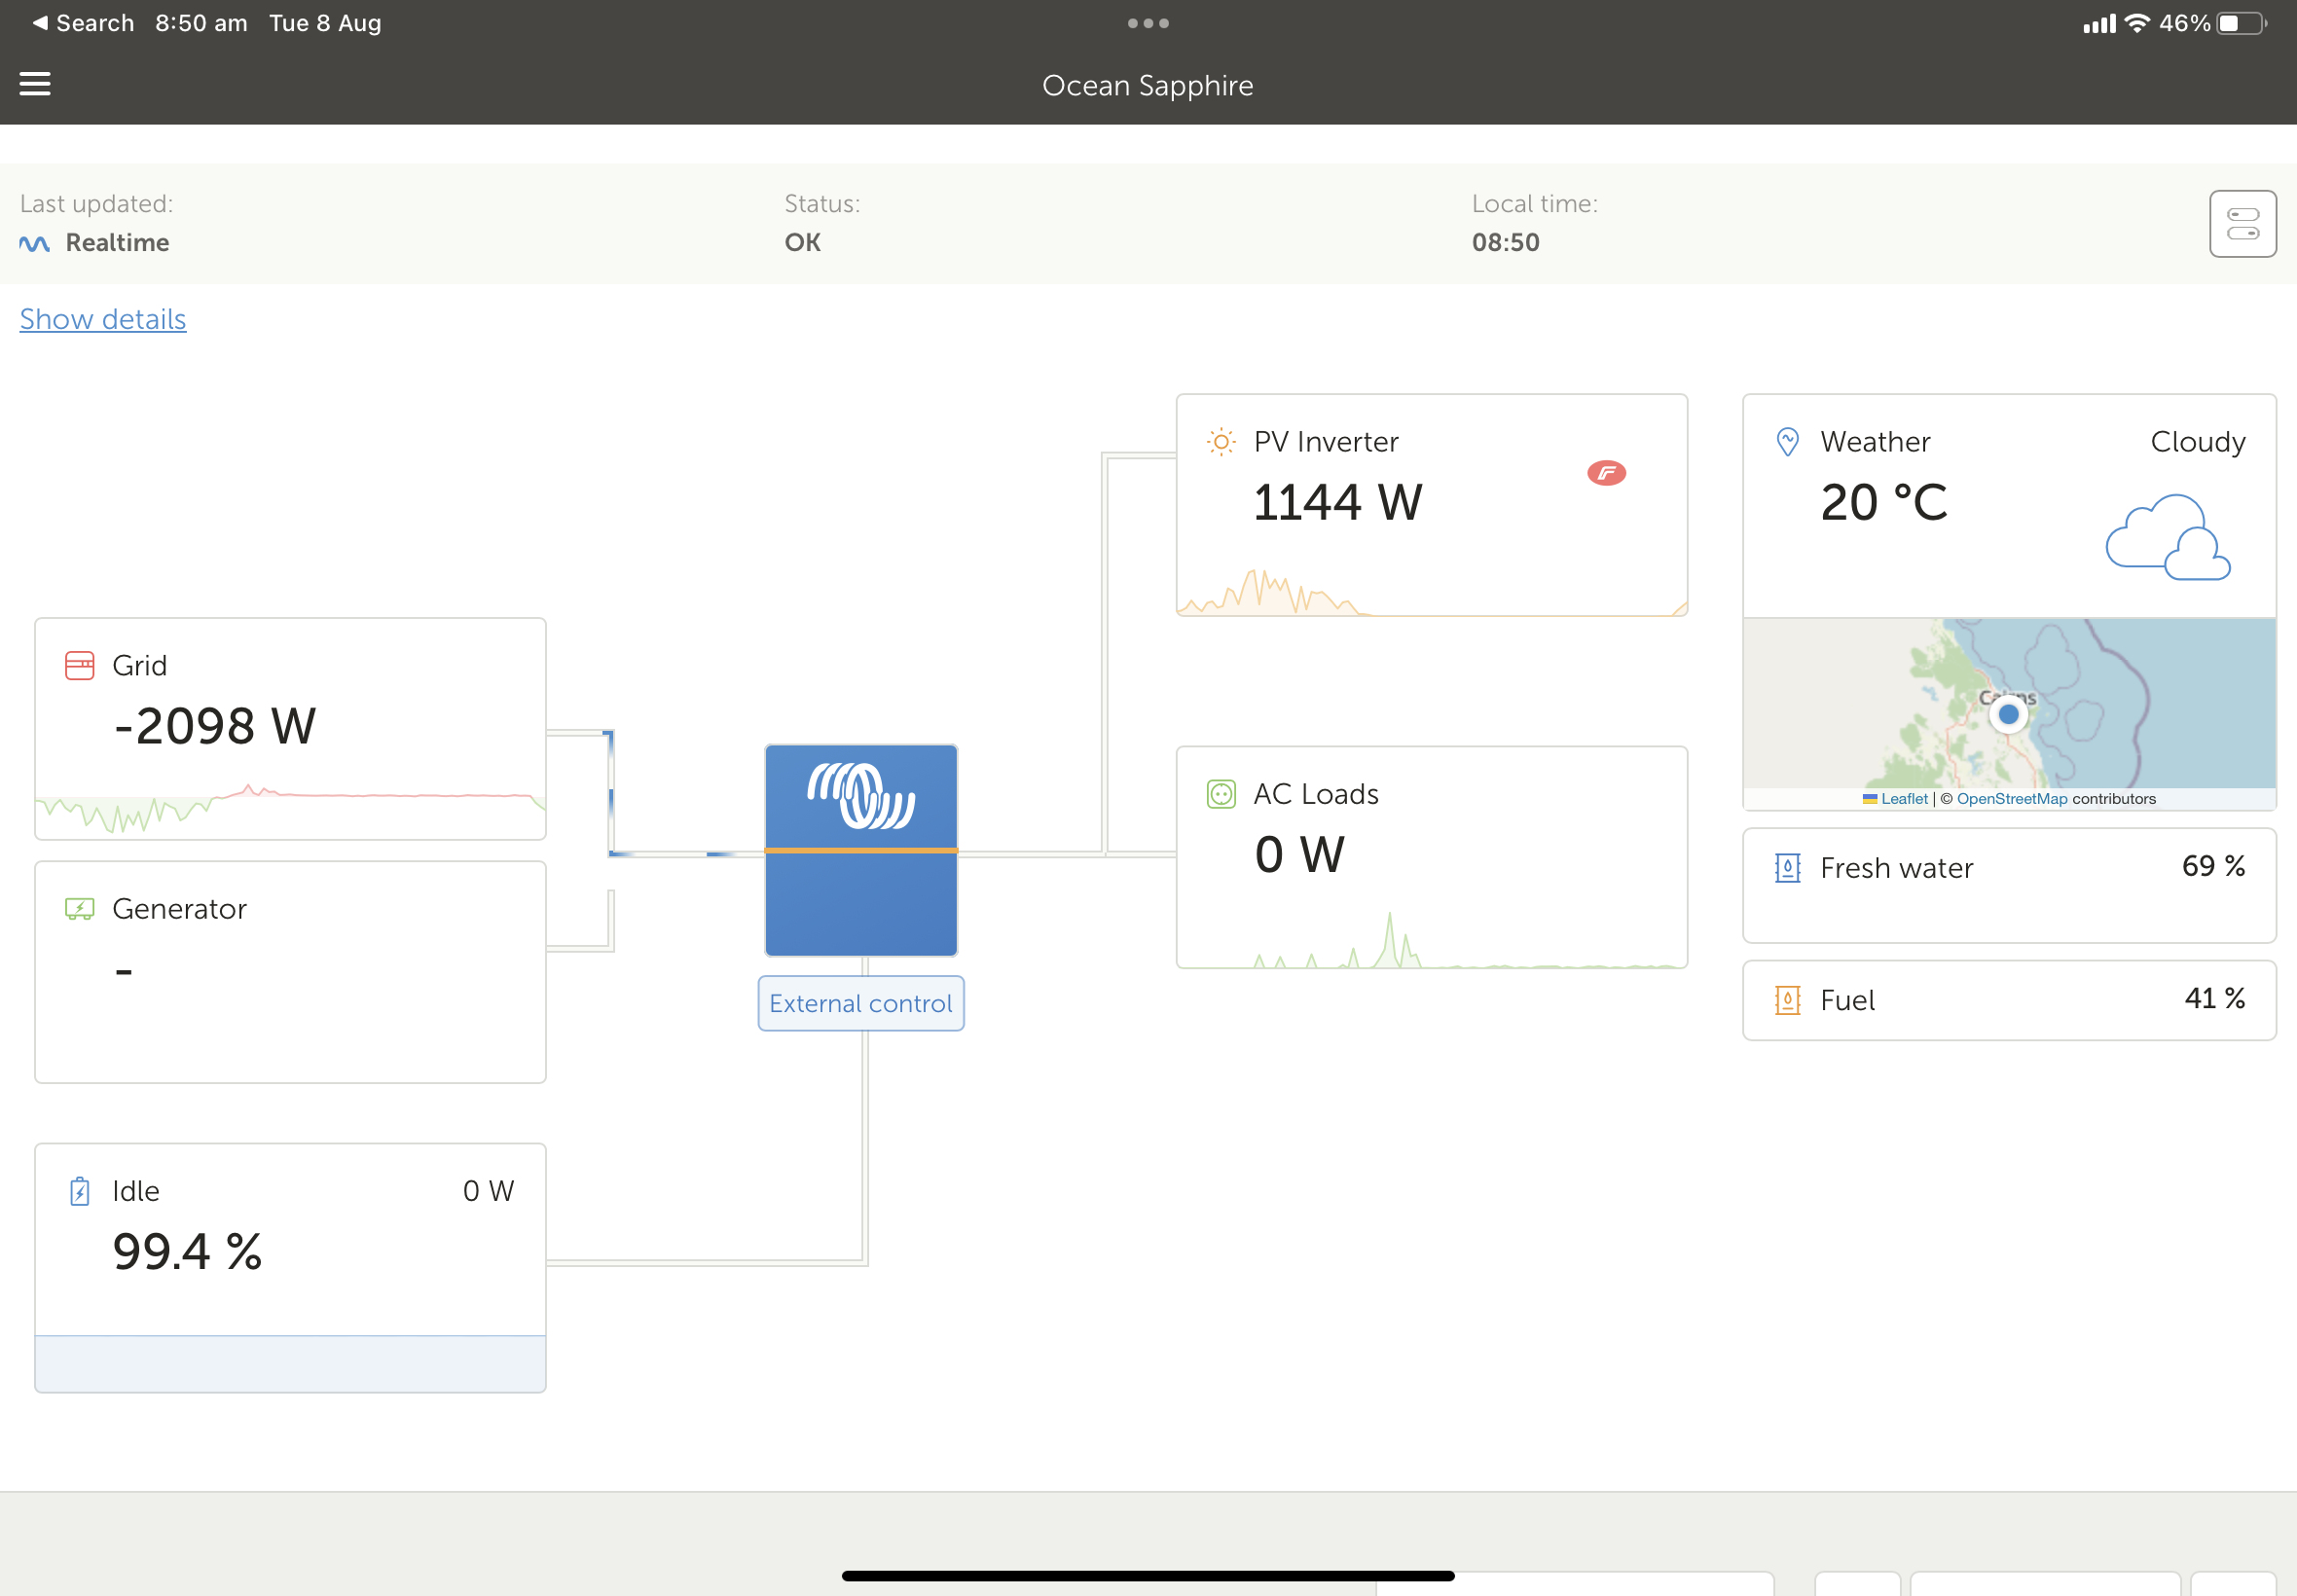
Now loads on the AC side don’t show until they are greater than the power being produced by the Fronius inverter..

And the power being sent to the grid is almost twice the power being produced.


I have no externally meters, it is all being computed from internal measurement from the Quattro and the being sent by the fronius.

interestingly, the overall graphs are correct…

It’s not effecting anything apart from the display…

any idea? Thanks

cerbo gxEnergy Meter
img-1056.png (441.0 KiB)
2 |3000

Up to 8 attachments (including images) can be used with a maximum of 190.8 MiB each and 286.6 MiB total.

3 Answers
matt1309 avatar image
matt1309 answered ·

Hi @Mike

That's an add one. Is everything configure in gx device on the correct side (ie ACOUT1, ACOUT2 vs ACIN etc), maybe one of those settings got reset during an update?


Is the AC coupled PV on a energy meter or is it integrated/fronius?

May be worth checking it's configured to the correct location (ACOUT1 or 2 I'm guessing given you've noted you have no external meters). That's my guess anyway

2 |3000

Up to 8 attachments (including images) can be used with a maximum of 190.8 MiB each and 286.6 MiB total.

Mike avatar image
Mike answered ·

Ok, problem is solved. It’s an AC coupled system. Some how, on the Cerbo, the Fronius was listed as connected to the AC 1 input, not the AC 1 output. I change this setting on the Cerbo, and now the display is back to normal.

Thanks.

2 |3000

Up to 8 attachments (including images) can be used with a maximum of 190.8 MiB each and 286.6 MiB total.

Mike avatar image
Mike answered ·

It’s interesting that regardless of the incorrect setting, the graphic still showed the Fronius on the AC1 output.

2 |3000

Up to 8 attachments (including images) can be used with a maximum of 190.8 MiB each and 286.6 MiB total.