question

Ingo avatar image
Ingo asked

VRM Dashboard AC Loads vs Critical Loads Graph?

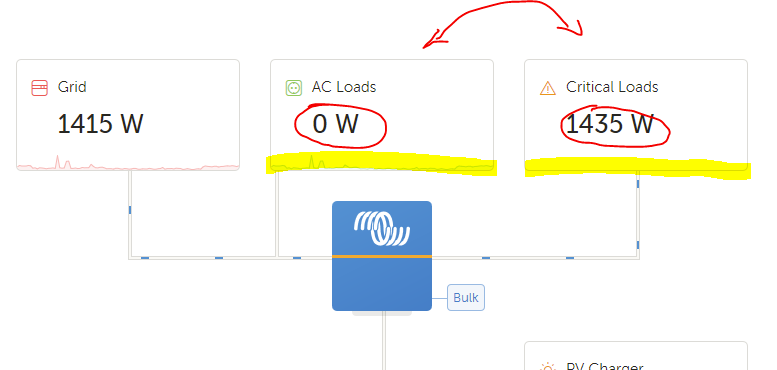
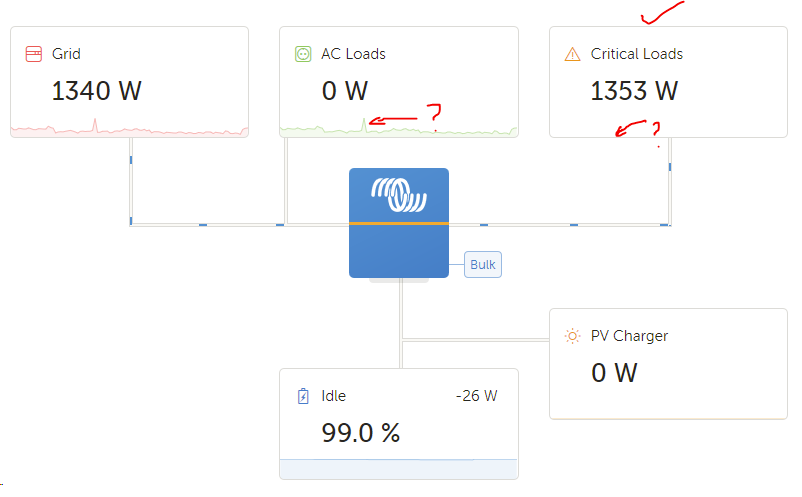
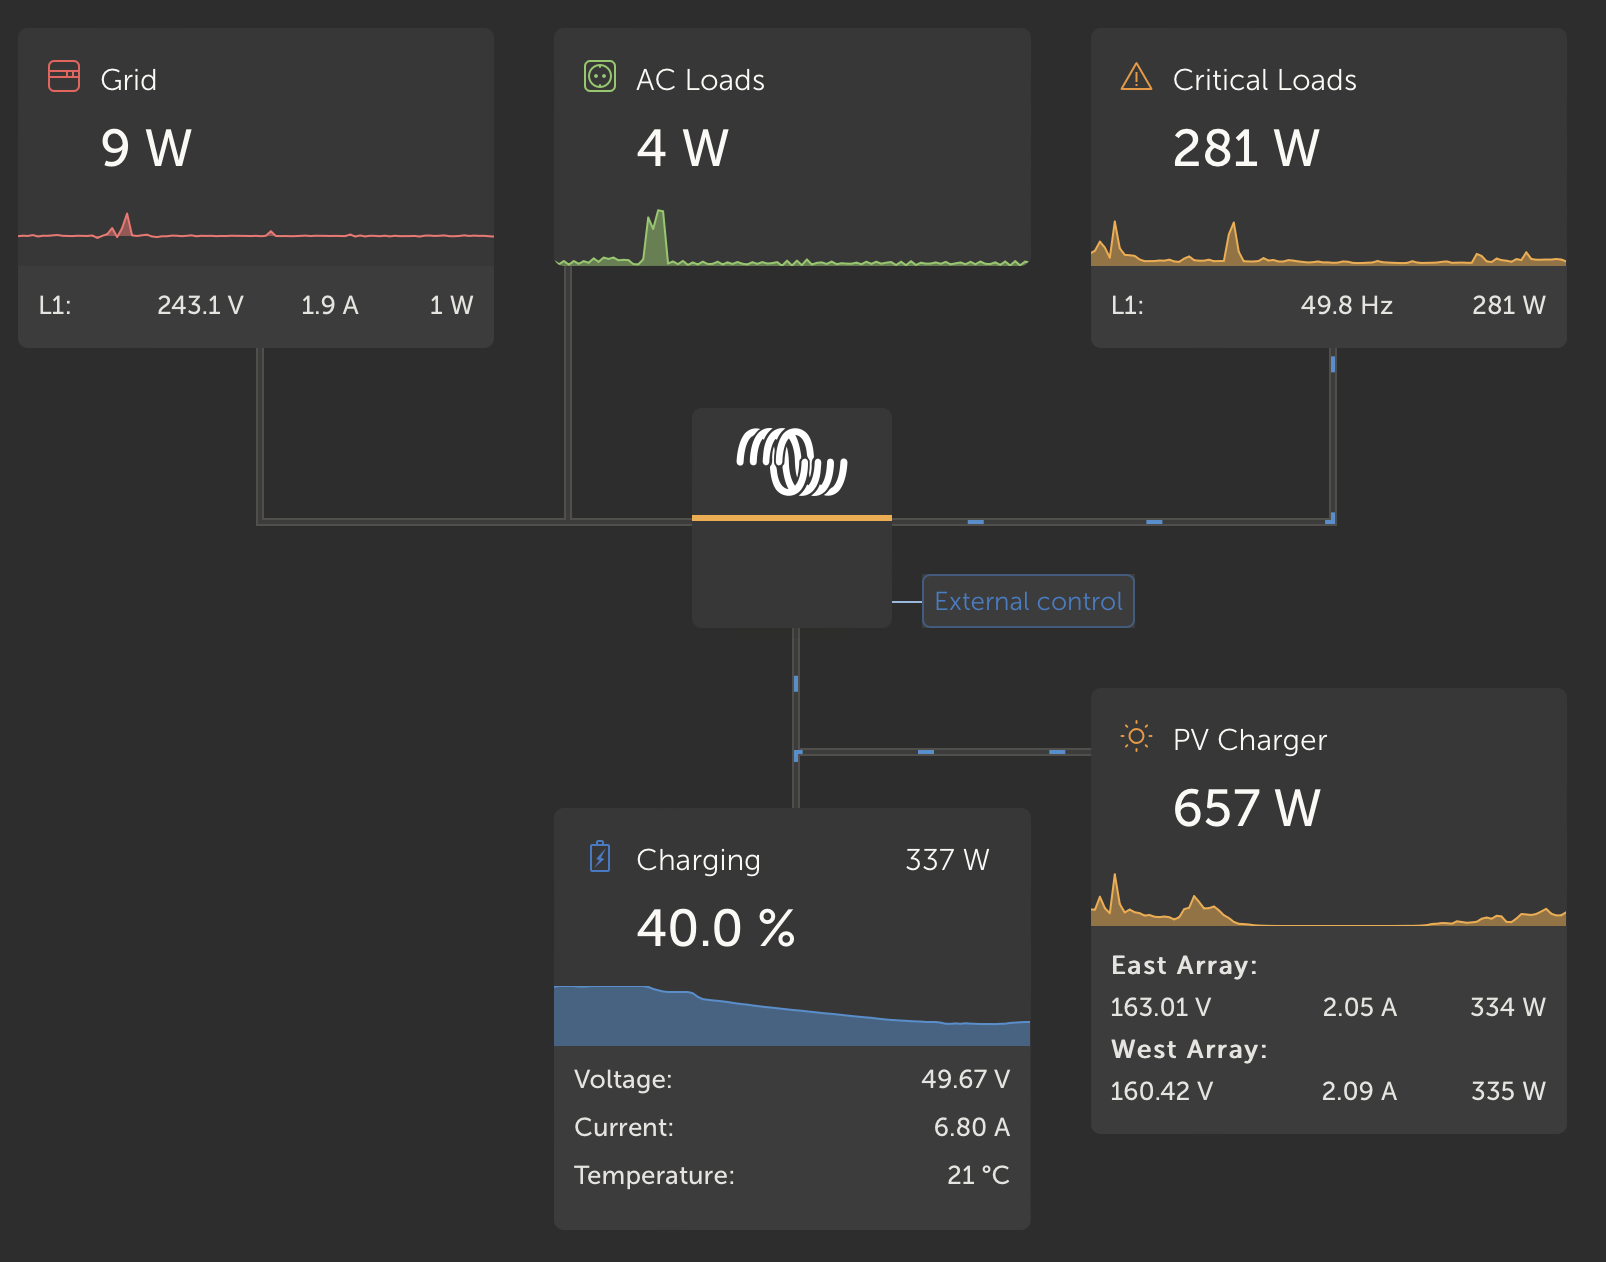
I am slightly confused by the below capture. Should there not be a little graph displaying Critical Loads as well? Perhaps the AC Loads and Critical Loads graphs are swapped around somewhere in the code.

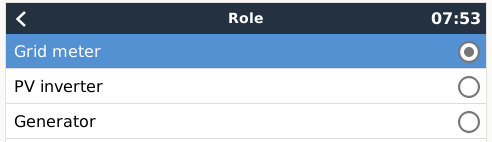
My System consists of a Quattro and ET112 Grid Meter (selected as active).

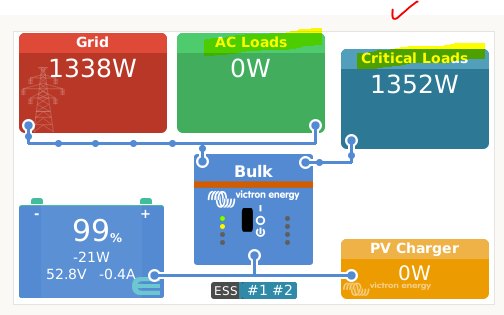
If I select the Internal meter then the AC Loads and Critical loads become one and displays correctly as a single box with the correct graph. With the external meter the below is shown.

I've also checked other VRM images on the Net and they are all the same from what I can find.

1608804231739.png

VRM
1608804231739.png (22.0 KiB)
6 comments
2 |3000

Up to 8 attachments (including images) can be used with a maximum of 190.8 MiB each and 286.6 MiB total.

Ingo avatar image Ingo commented ·

Any comments from @Victron Staff supporting the VRM portal?


0 Likes 0 ·
Paul B avatar image Paul B commented ·

Under the energy meter settings have you got them all set correctly. Please send screen shots of your GX creen settings for all relavant screens.


1610165672129.png

0 Likes 0 ·
1610165672129.png (11.0 KiB)
Ingo avatar image Ingo Paul B commented ·

Under Settings I only see Setup and Device, none of those gives me an option for Position. The only option is the Role.

Under General Setting the Grid meter is again set as Grid 'role' and Single Phase.

1610171618039.png

Just to clarify, my system consists of a Quattro, Venus GX and ET112 Grid Meter.

Edit: Adding venus and VRM graphs

1610172748350.png

1610172938066.png

0 Likes 0 ·
1610171618039.png (8.2 KiB)
1610172938066.png (25.8 KiB)
1610172748350.png (29.0 KiB)
Ingo avatar image Ingo Ingo commented ·

So is no one finding this interesting that the graph for AC Loads is actually the graph that should be in the Critical Loads box? And the missing graph in the Critical Loads box should be in the AC Loads box where it currently is 0W?

Can anyone else post one of their screenshots so I can see that I am not losing my mind and imagining things?

Is there anyone from the VRM Portal team that can respond to this?

0 Likes 0 ·
Matthias Lange - DE avatar image Matthias Lange - DE ♦ Ingo commented ·

I can confirm that behavior and forwarded it to the devs.

0 Likes 0 ·
Ingo avatar image Ingo Matthias Lange - DE ♦ commented ·

Excellent!! Vielen dank.

0 Likes 0 ·
2 Answers
freddyuk avatar image
freddyuk answered ·

Is there any update on this condition?

1 comment
2 |3000

Up to 8 attachments (including images) can be used with a maximum of 190.8 MiB each and 286.6 MiB total.

Craig Chamberlain avatar image Craig Chamberlain commented ·

It seems to be working fine for me currently. My AC Loads are generally minimal as they only represent my cooker, shower and garage/EV whereas everything else goes through my critical loads DB. I only a few days ago installed my ET112 as a grid meter in place of the CT clamp I was using and so having the split between AC Loads and Critical Loads is relatively new to me. But the graphs and figures are matching as far as I can tell.

screenshot-2023-06-30-at-130635.png

0 Likes 0 ·
ppr avatar image
ppr answered ·

I dont understand the problem. Everyhing connetced on the AC-Out-1 is "Critical Load"
If you uncheck the grid meter and tell the Multis to sum everything up and display what there current load is, it is obvious that Critical Loads and AC Loads are the same.

AC-Load can also have other loads what are not connected behind the Multi and that delta is shown.

2 |3000

Up to 8 attachments (including images) can be used with a maximum of 190.8 MiB each and 286.6 MiB total.

Related Resources

Additional resources still need to be added for this topic