question

Rune Eilertsen avatar image
Rune Eilertsen asked

VRM load history gives false presentation and data.

Hi, Anyone other than me think this is a (huge) problem?

is VRM a tool for presentation of history?

I think yes, and a greate tool for system monitoring... BUT...
all data logged when cames to history and peak loads are close to useless...

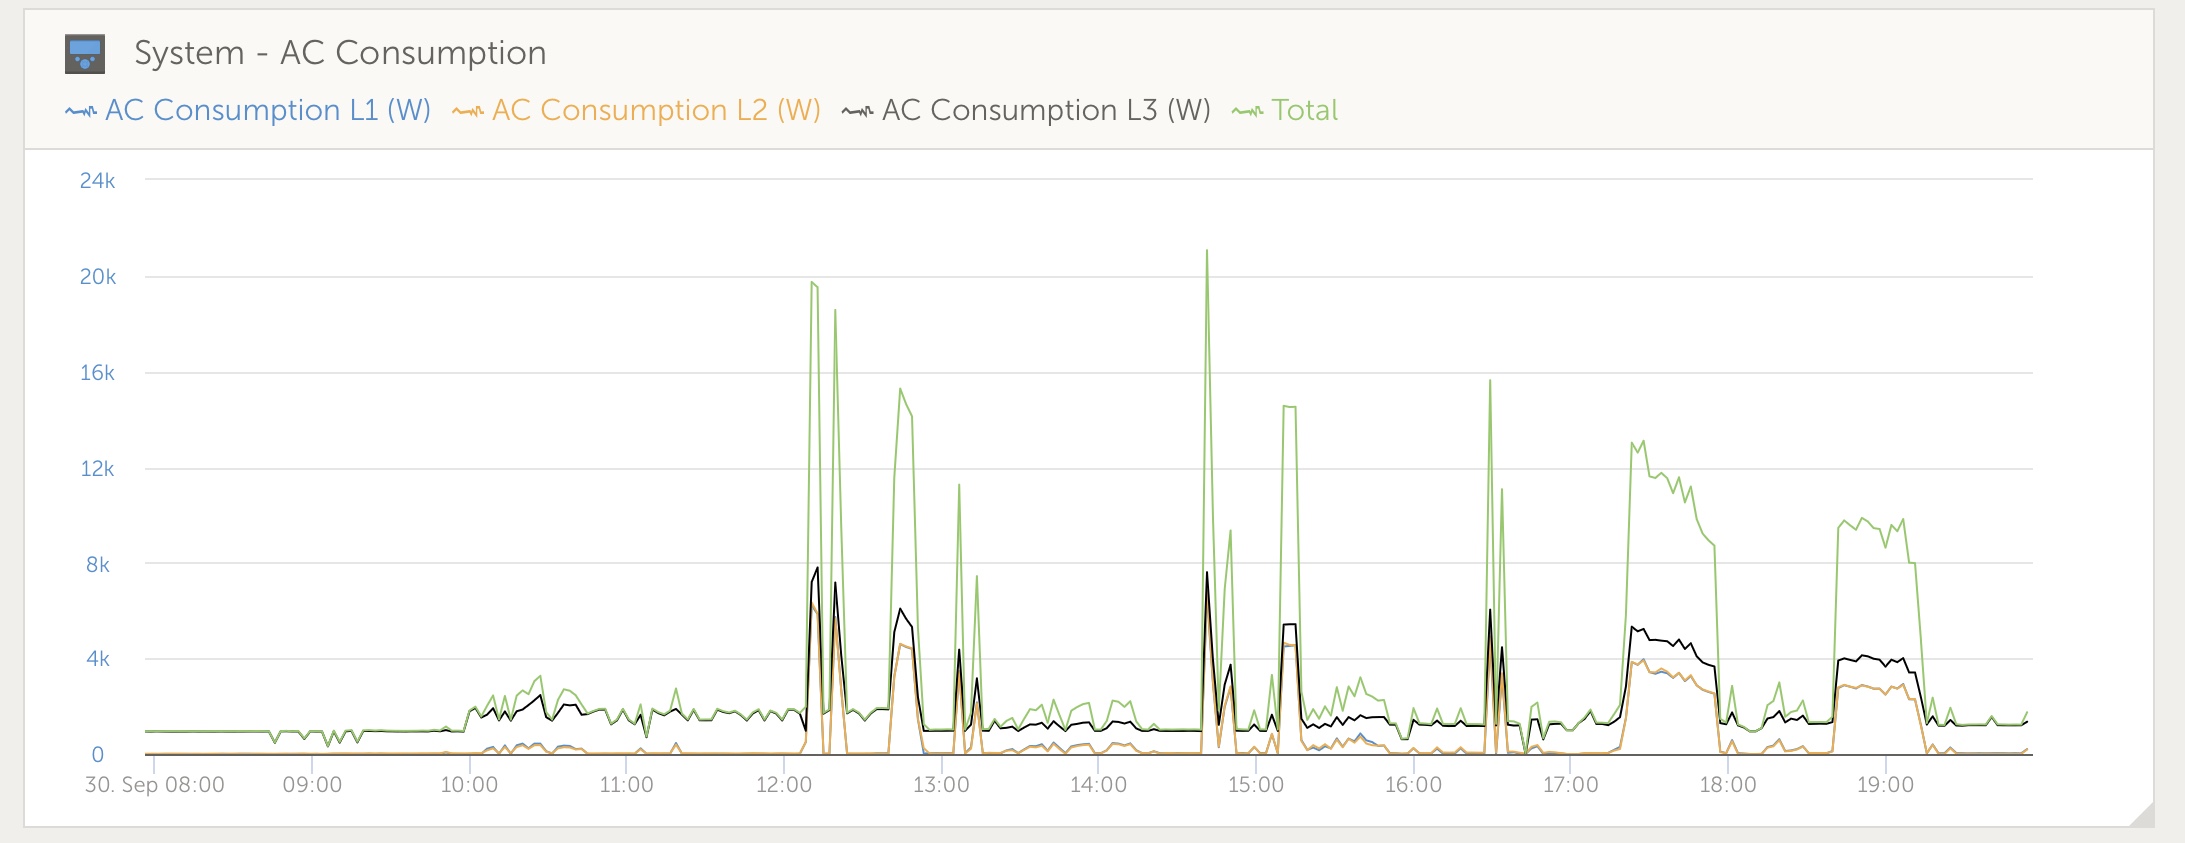
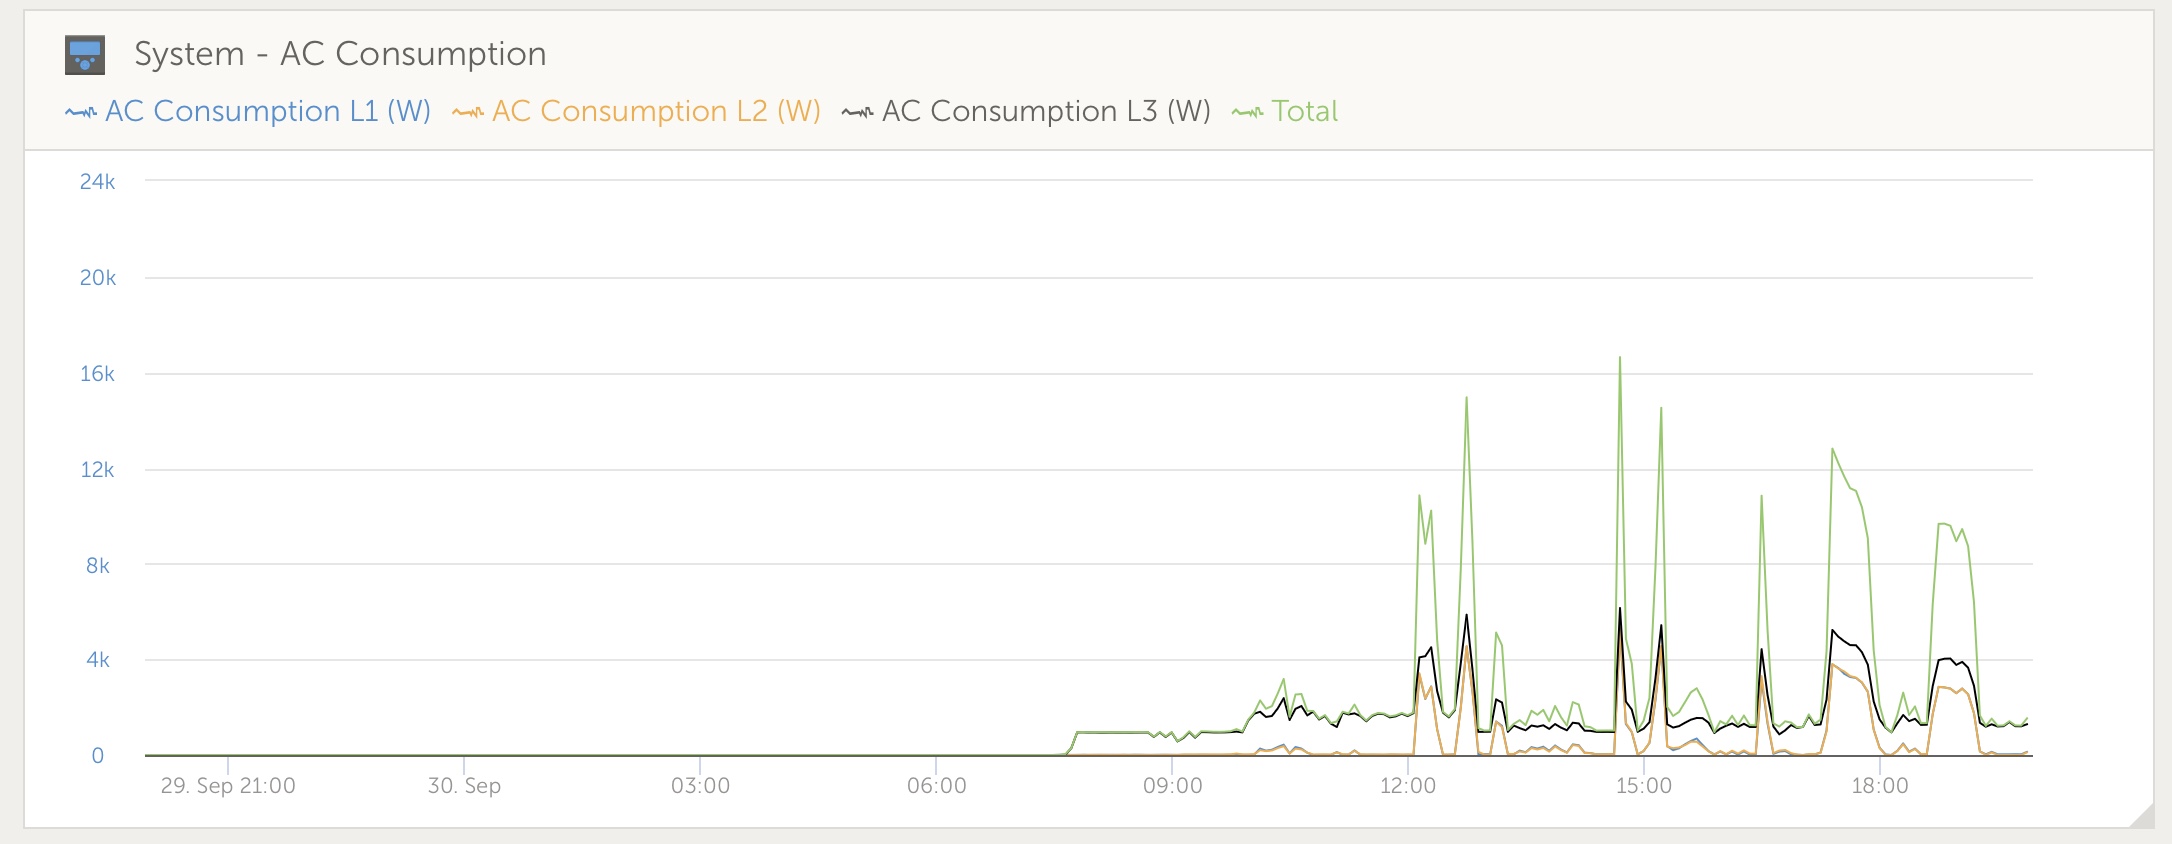
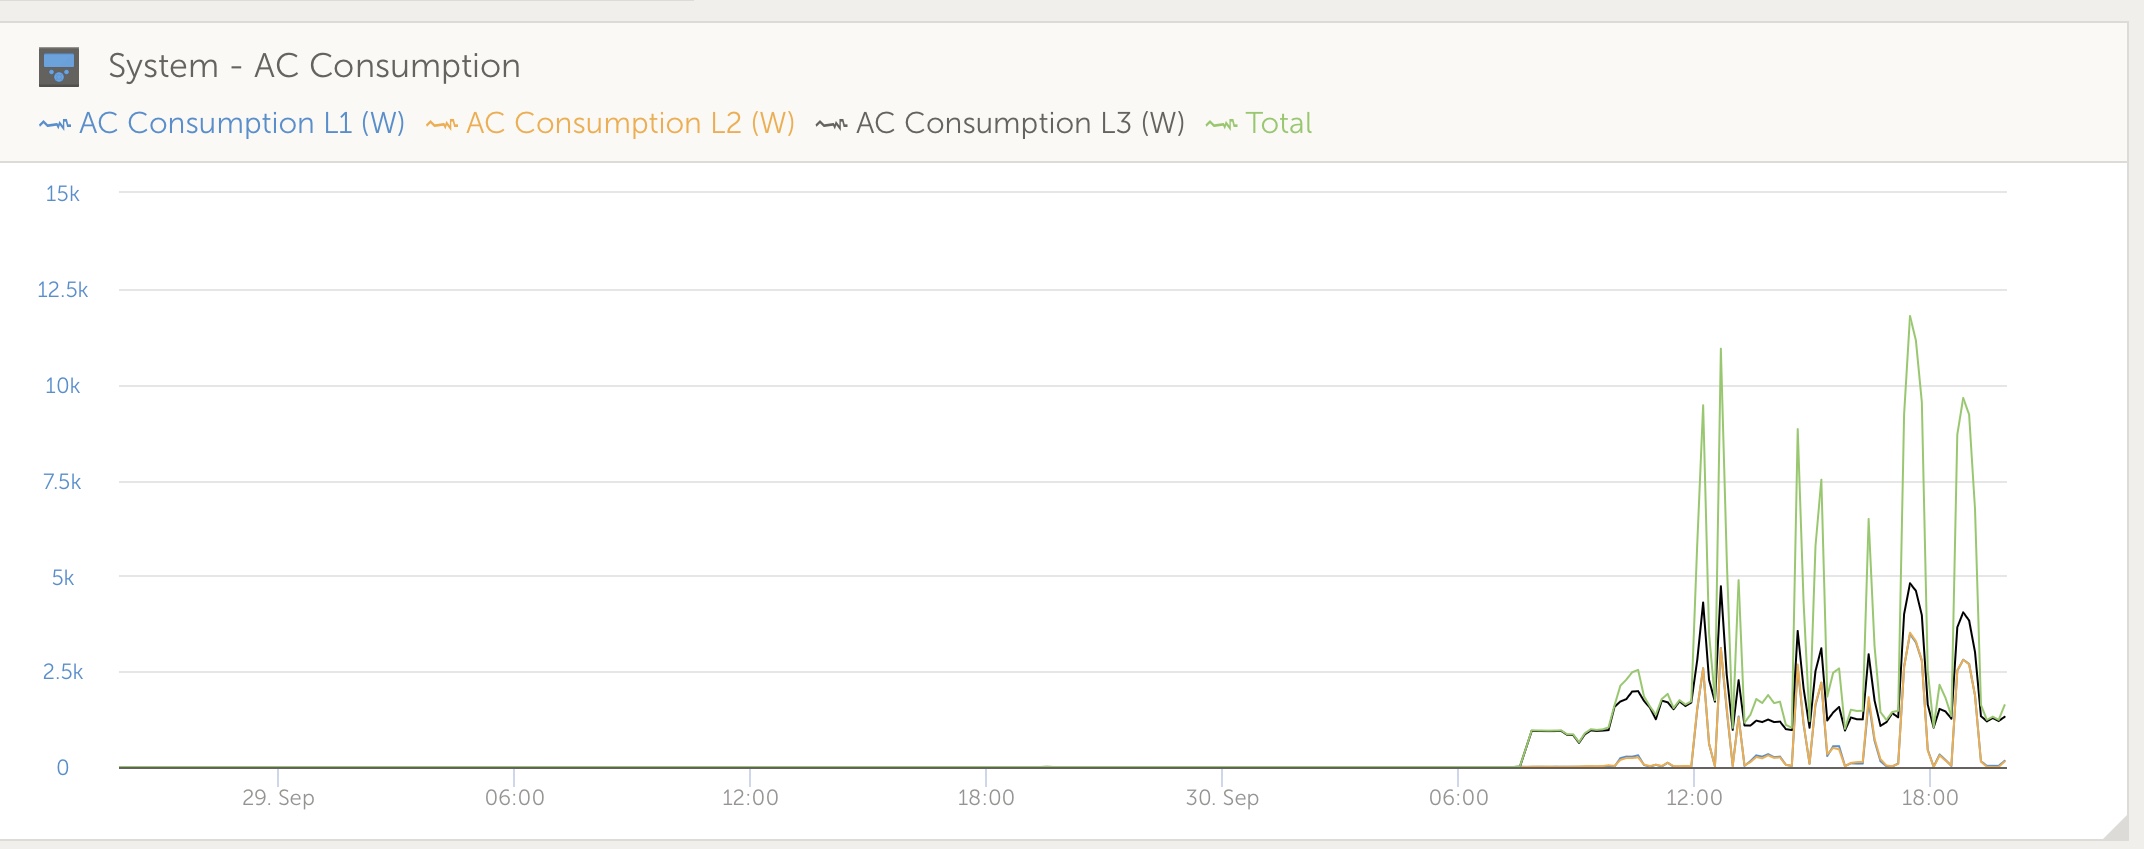
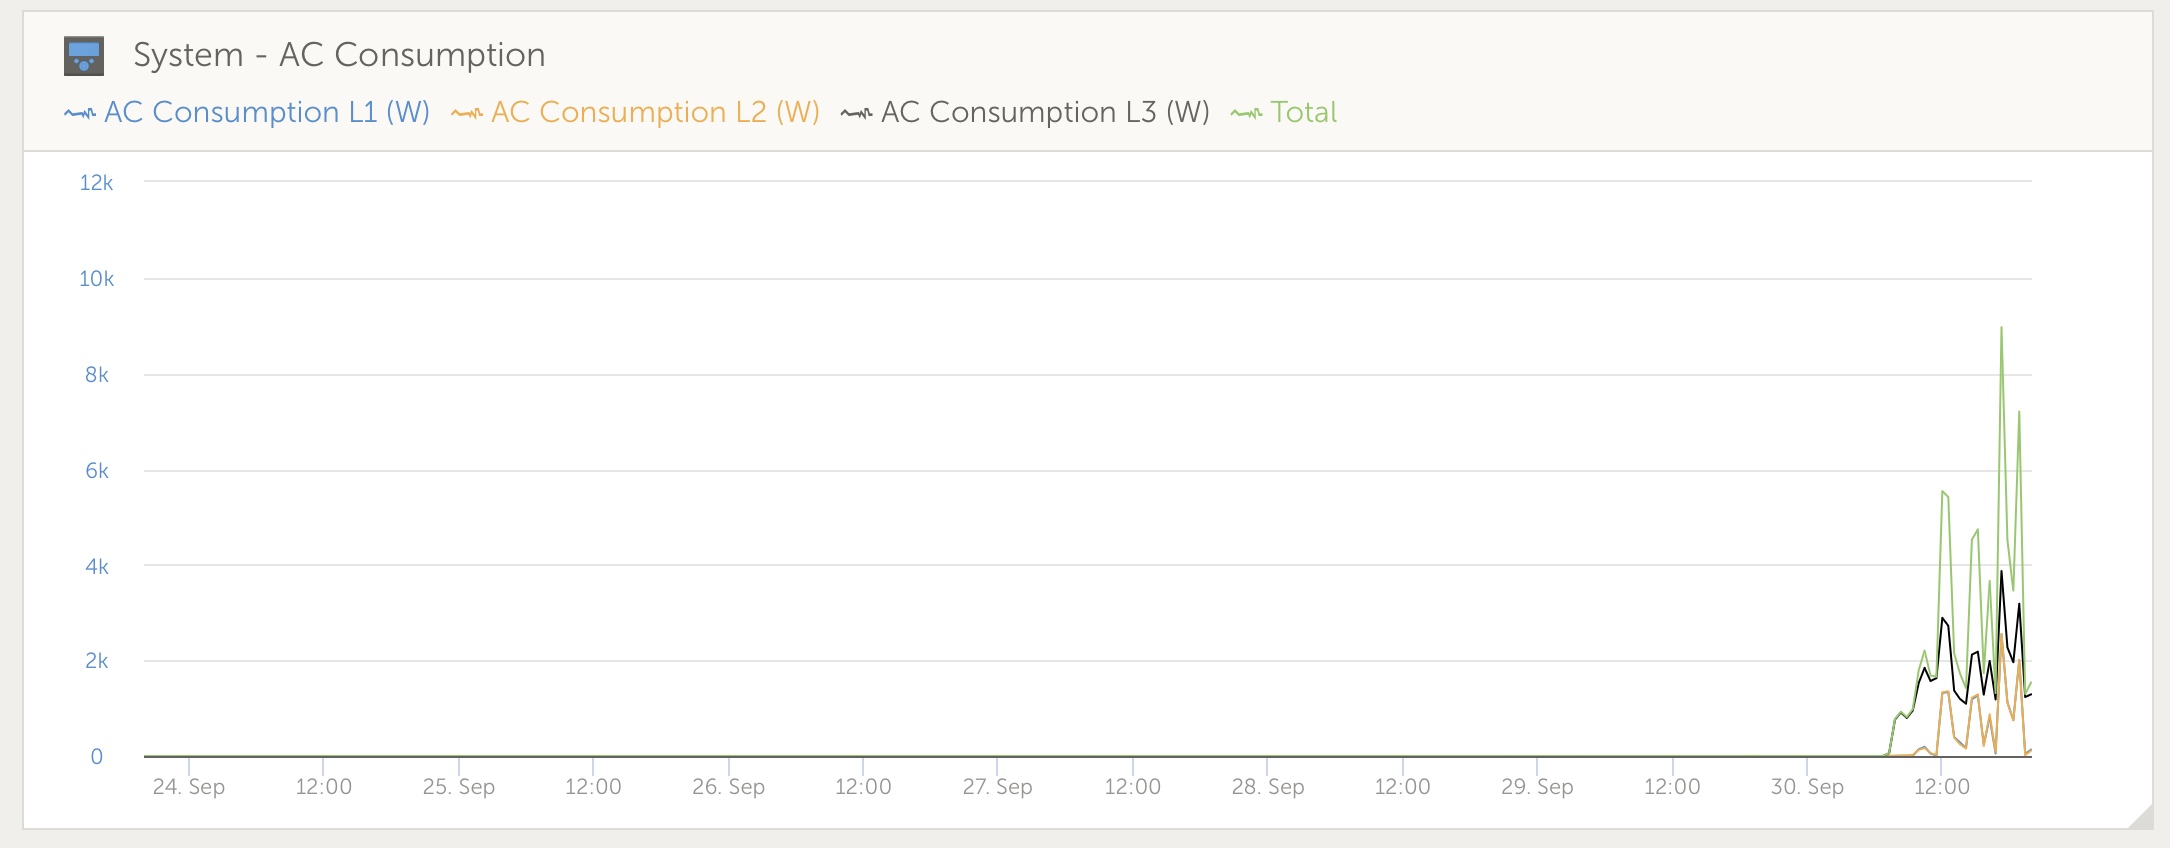
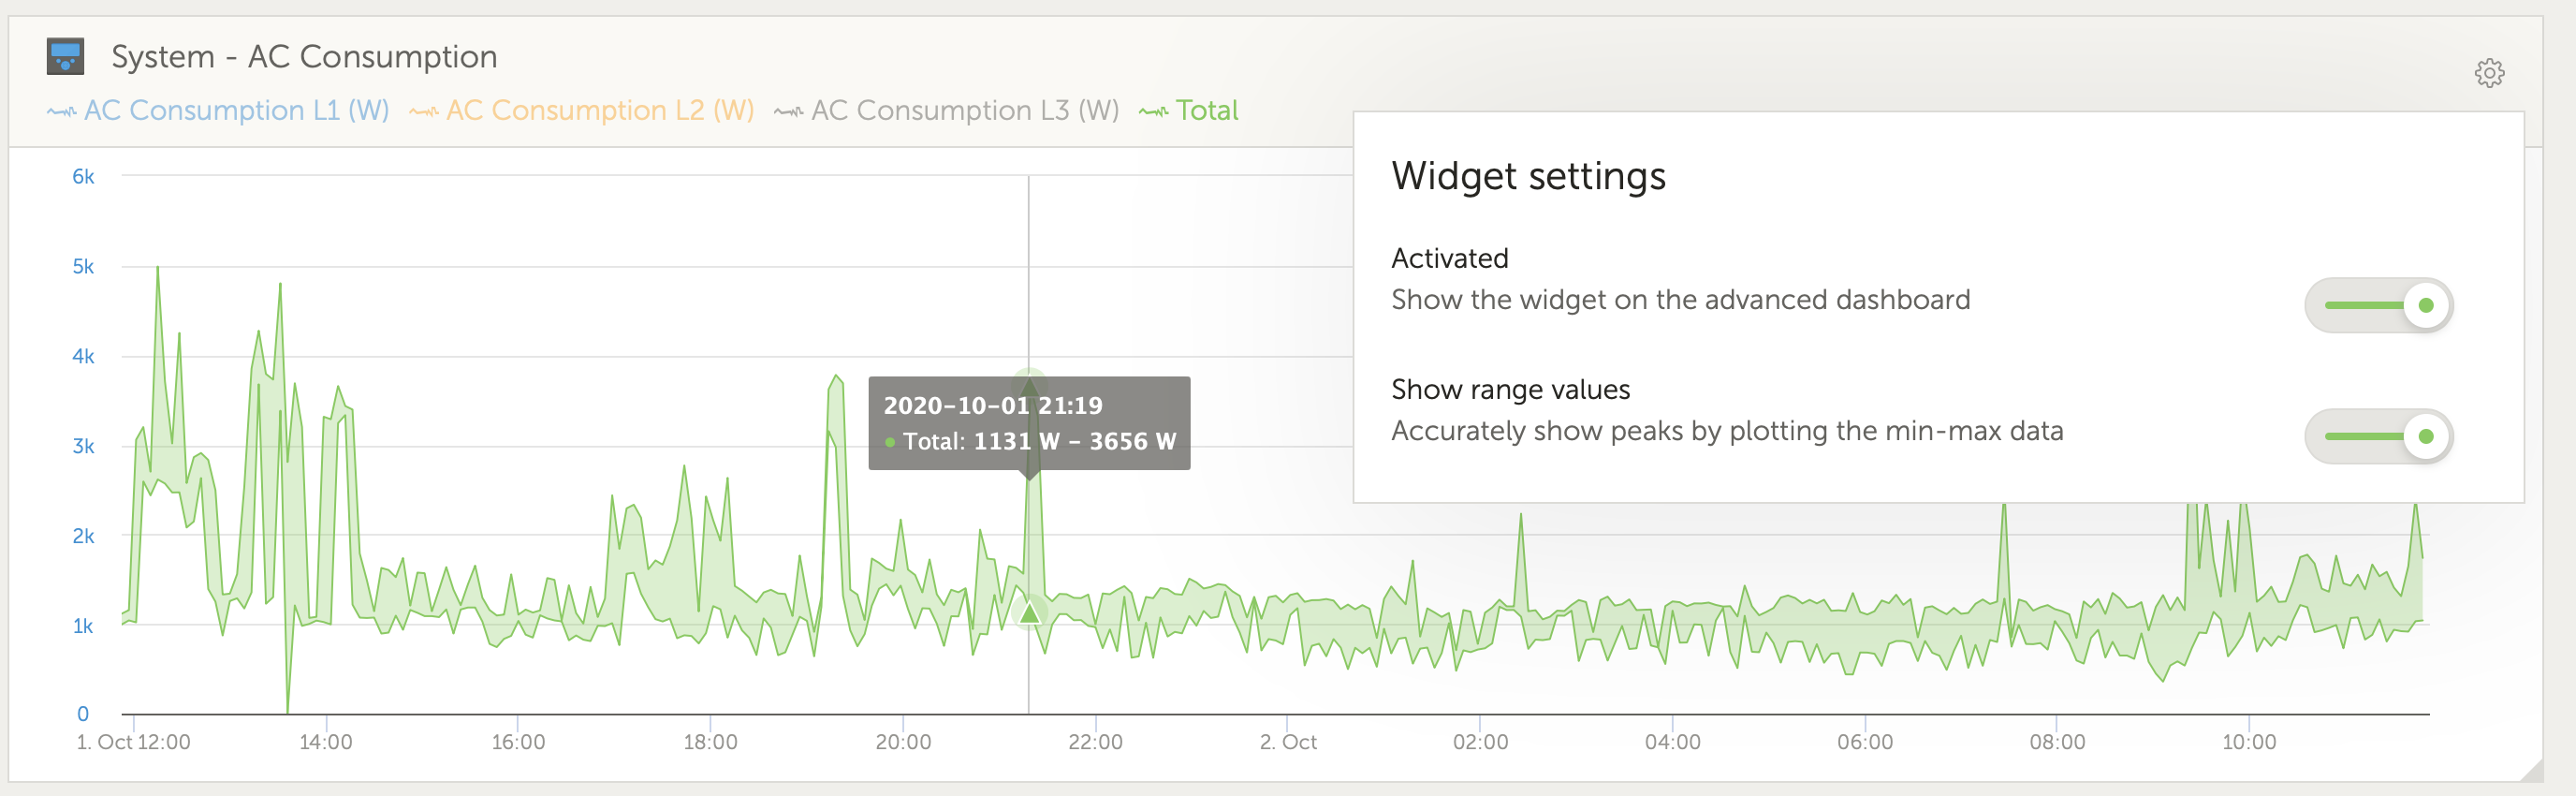
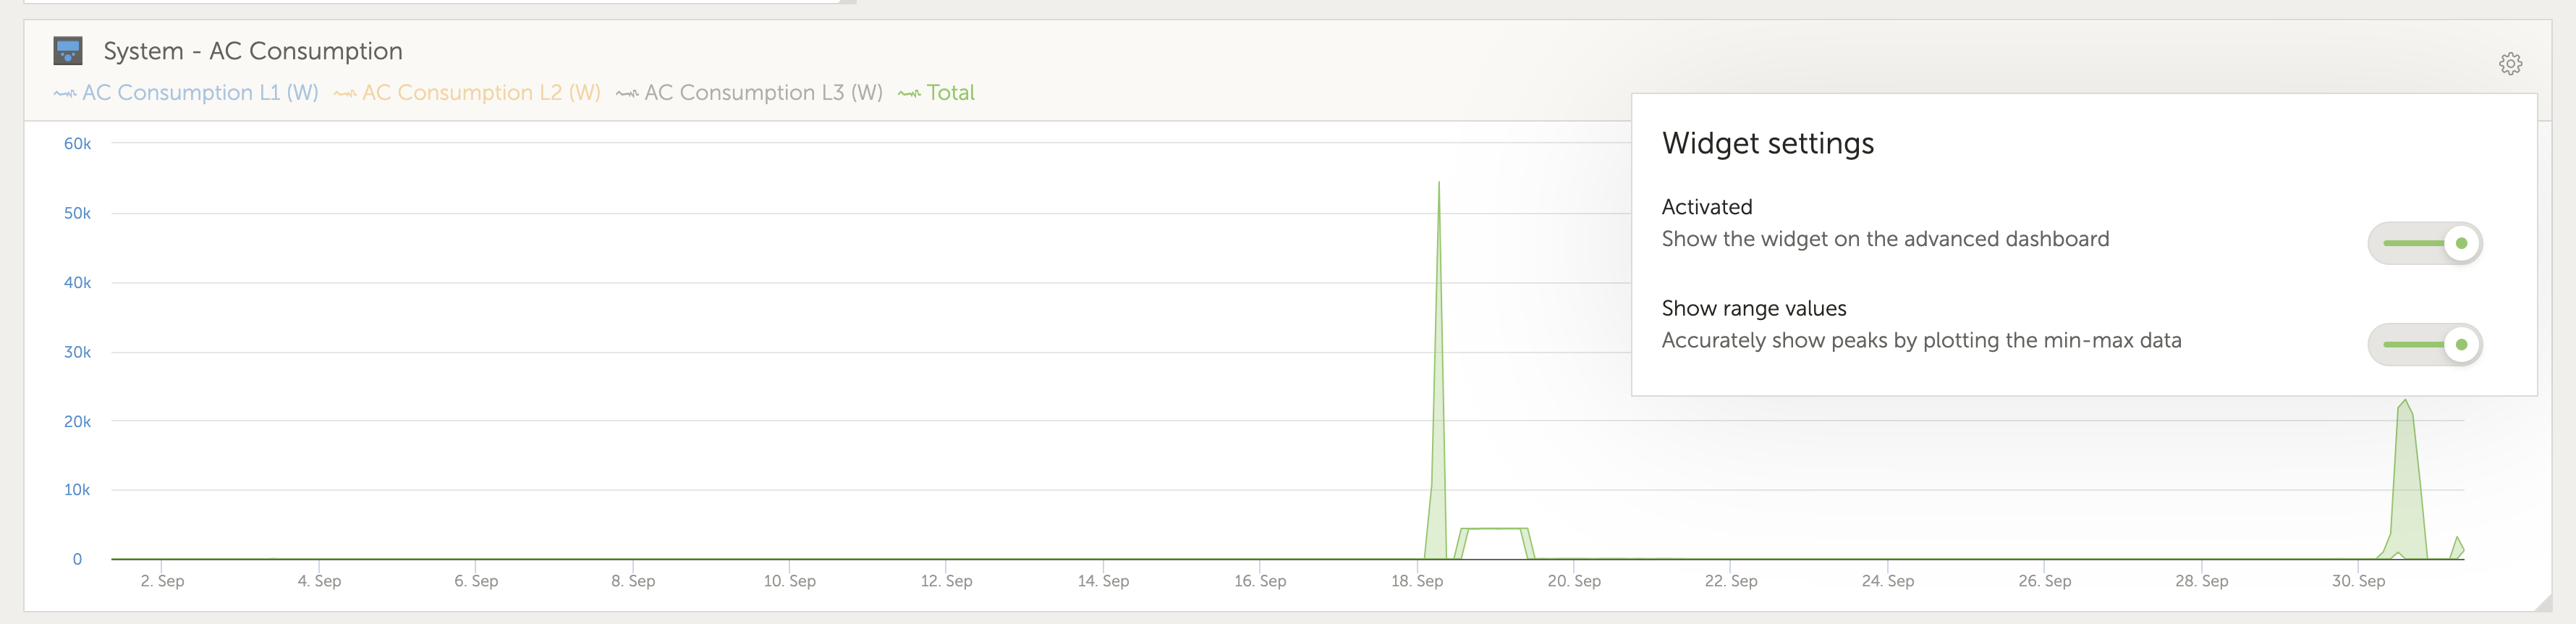
The pictures below show a overload on a 90 kVA Inverter system!

Tell me... what can we use this pretty pictures for other than it fals give an impression that system has only a 10% of its max load ? :-)

Is it a feature? A bug? Even a analog, 1980 home entertainment system had Vue meters with peak hold function........ Most cheap multimeter has the function as well.

(And actually.,, the year 2013 Color control gx was able to log peak loads down to a secound peak easy. And also show it on the excel download.
we used it that time as documenting peak load ability. Not any more..
now days not even close to real load data is logged in venus devices...

yes, i know i have posted once before about it.That time on soc view.
But no more information about what is concluded.. Only recognised it may be a problem....

is it an design feature? A bug? if recognise its a fail, what is the plan?

the tool has been broken now for years. If use api to pull data, the data will be false, and not show actual loads and therefore not showing actual problems for a system.

Today we need 3. Part dataloggers to give a any realistic presentation of load to our customers.

any info from Victron ? Is it a recognised problem? If so, what is the plan, and when...


VRMVenus OS
2 |3000

Up to 8 attachments (including images) can be used with a maximum of 190.8 MiB each and 286.6 MiB total.

1 Answer
Teun Lassche avatar image
Teun Lassche answered ·

@Rune Eilertsen I get your problem, and it for sure is a limitation on the current graphs.

Some good news, this morning we launched a feature to show the peaks / ranges on VRM. Example:

This helps a bit, it shows the most detailed min/max VRM has available. However, right now those are limited to 1min intervals - VRM simply does not have more fine grained data available. We are aware of this, and might find improvements in that area, but I cannot give any timeline on it.

The other good news that there is another solution available to get more fine grained data out of your GX device, it has more fine grained data (up to two seconds intervals), but is a little more work to get up and running. You can find the details over here: https://github.com/victronenergy/venus-docker-grafana


1 comment
2 |3000

Up to 8 attachments (including images) can be used with a maximum of 190.8 MiB each and 286.6 MiB total.

Rune Eilertsen avatar image Rune Eilertsen commented ·

ok, thanks. Yes, my old day with CC GX in 2013 was able to logg thse short peaks.

Hopefully Venus can get some cind of ability to record peak loads to VRM in maybe own colomb eventuelly.

Anyway, the smooting of digram is very frustrating to work with.

So I really hope a bettery way for it in generaic can be implemented.

Because it looks to be generic VRM problem, not only load, but also SOC and other measurements as well.

Peakloads mostly are only secounds, and that is the one that define what inverter power is needed. I will take a look at the link.

But any beta or 3. part software that may influence stability is not an option.

Also it demands a logging computer, as I understand it.. with a great internet connection, or local hosted. Not an option for our machines :-)
So what need is a way the Venus can logg peak values, and that VRM is receive those key data. It does not need to be part of the calculated dataset. ( I guess that is the reason its smoothed already to one minue "RMS" value ? to use it for calculation.

But if was able to logg those peak loads in parallel.. and put it as an secound graf on the chart. (or points.. if peak load is more than x procent over the nominel measurement, so user can see that they have high peakload going on.

0 Likes 0 ·

Related Resources