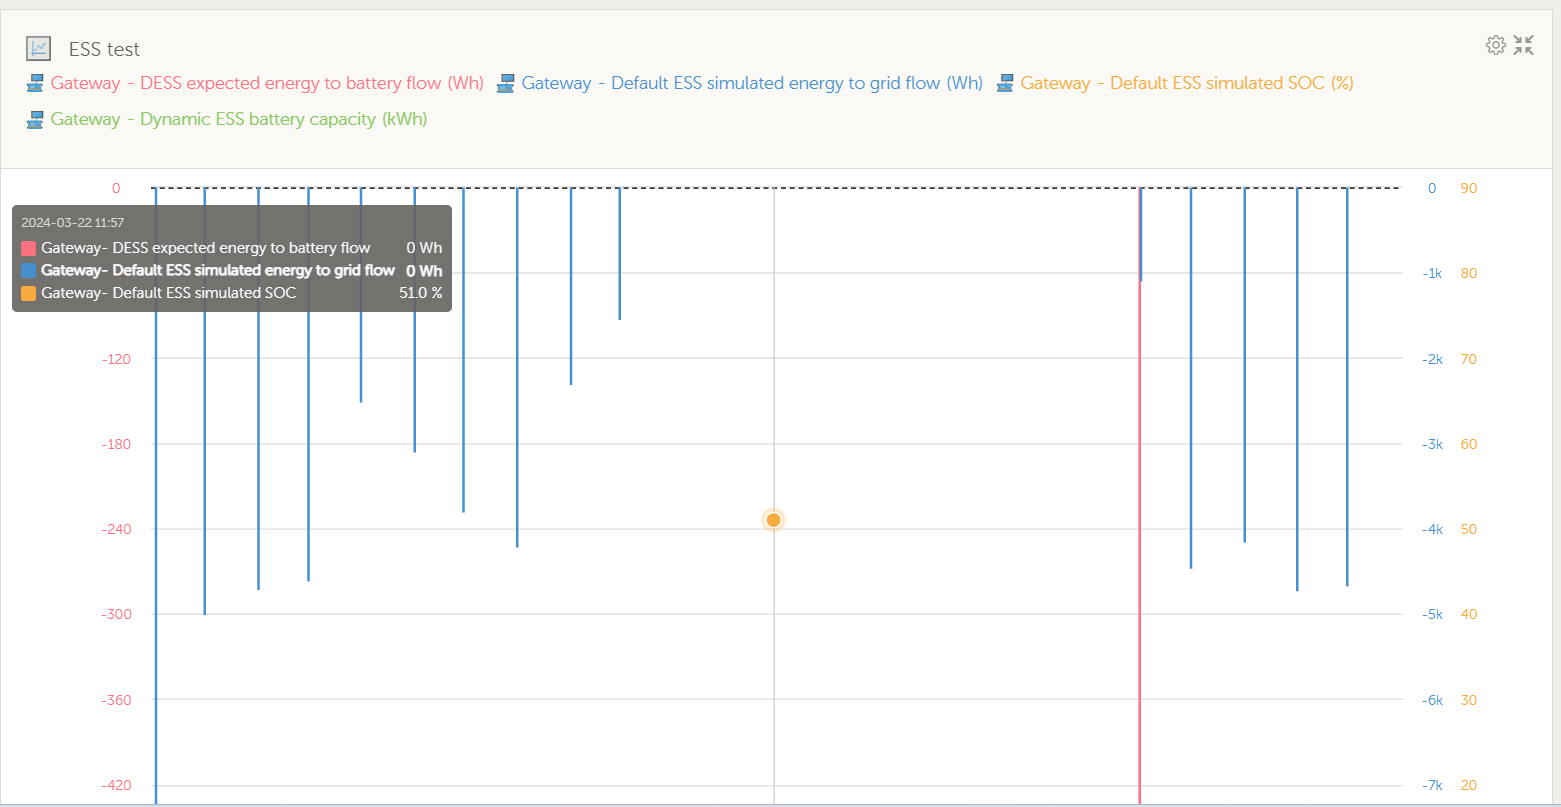
Some graphs are missing trend lines, like this "Gateway - Default ESS simulated SOC (%)".
Also, when a graph is maximized, it minimizes by it selft about every minute.
Some graphs are missing trend lines, like this "Gateway - Default ESS simulated SOC (%)".
Also, when a graph is maximized, it minimizes by it selft about every minute.