question

Pavel Richter avatar image
Pavel Richter asked

bad value of daily production and consumption.

1.pngHello, I have a problem with the values on the VRM

old configuration:
Octo GX
3-phase MPII 3000/48
Battery, 12kwh lifepo4
MPPT 150/60 2.4kwp
MPPT 150/45 2.6kwp
MPPT150/35 2.1kwp
SYMO 4.5 at output; 4.5kwp communication sunspec ok
SYMO 6 at input; 7.36kwp communication sunpsec ok
Measurement by external current transformers to MPII on the supply from the grid.

Everything works ok, measurements ok, values on VRM ok.

New configuration.
Octo GX
3-phase MPII 3000/48
energy meter VM3P-75CT on the supply from the grid
Battery, 12kwh lifepo4
MPPT 150/60 2.4kwp
SYMO 4.5 at output; 4.5kwp communication sunspec ok
SYMO 6 at input; 7.36kwp communication sunspec ok
SUN200-12KTL-M2 + ET340 at input; 12.9kWp

In the ESS, the "external meter" measurement, the position (input, output) of the PV inverters are set correctly, and the electrical connections are also correct.

It works fine in the remote console. on VRM "realtime" values OK.

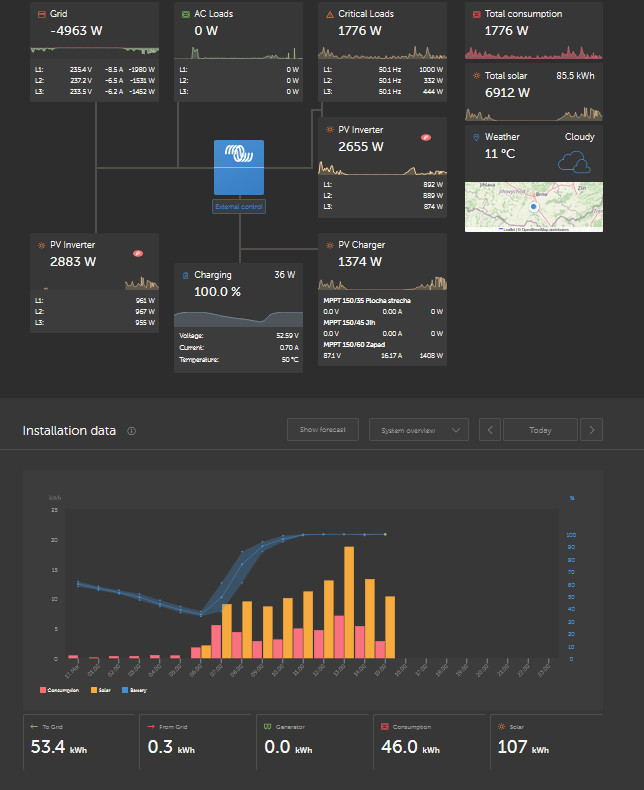
But total production and consumption are absolute nonsense.
in the picture the production is 107kwh, but the real production is 74kwh at that time. Consumption is also bad. During production, it shows a consumption of around 5kwh per hour, which is also nonsense. I sit with it all day, looking at the consumption. For an hour the consumption is 700W+-200W, everything looks ok and in that hour the VRM shows me a consumption of 5kwh.

Since the configuration change it shows this nonsense and destroys my data. Tried factory reset OCTO GX, reload ESS.

I'm constantly checking everything, but I'm running out of ideas on what to do with it.
Can anyone advise?

thank you very much
Pavel

VRM
1.png (72.5 KiB)
2 |3000

Up to 8 attachments (including images) can be used with a maximum of 190.8 MiB each and 286.6 MiB total.

3 Answers
Pavel Richter avatar image
Pavel Richter answered ·

I counted again now.

107kwh on VRM - 74kwh real production = 33kwh which is exactly the production of the SUN2000 at that time.

But the energy meter role is set as "PV inverter" position "AC input 1"

when I subtract 33kwh from production - it is real production
if I subtract 33 kwh from the consumption, it is a consumption that could be close to reality.

Why?

2 comments
2 |3000

Up to 8 attachments (including images) can be used with a maximum of 190.8 MiB each and 286.6 MiB total.

Alexandra avatar image Alexandra ♦ commented ·
Under installation data the 107kwh is the total energy produced for the day, not referring to the current production.


Current production will be what is on the dashboard above. Not sure where you got the 74kwh you refer to in your answer above. May have missed it.

2,883+1,374+2,655 = 6912kw (pv production) so that looks good.

0 Likes 0 ·
Pavel Richter avatar image Pavel Richter Alexandra ♦ commented ·

Thank you for answer.

I know how it works.


Dash board - realtime values are fine. It exactly corresponds to the current performance, the consumption corresponds to the current performance. It's OK


But below as stated 107kwh. That's bullshit. Real production is 74kwh. I totaled the production of SYMO on in + SYMO on Out + MPPT + ET340 for huawei on in. and the result is 74kwh.


Another mystery is one day it shows senseless consumption that copies solar power. He doesn't do it the next day. (I'm not changing anything).

But since the time of the question, I have been monitoring the production on individual devices every day, adding it up, and there is still a difference between what the vrm portal shows.


power kw, W fits, the amount of kwh is nonsense.

At the same time, the victron does not measure anything, all values of solar production are read out after communication.

0 Likes 0 ·
Pavel Richter avatar image
Pavel Richter answered ·

Hello,

does anyone have any ideas?

Lots of production yesterday - values almost corresponding. difference in production of 6kwh compared to reality. Consumption values correct.

Today. Large production again (about the same). the values on the dashboard are ok but the graphs and values for the whole day are absolute nonsense. Both production and consumption are bad.

I did nothing, nothing changed.

2 |3000

Up to 8 attachments (including images) can be used with a maximum of 190.8 MiB each and 286.6 MiB total.

Pavel Richter avatar image
Pavel Richter answered ·

still bad solar production values every day after configuration change. Víctron shows about 6 kwh more on the VRM portal than the reality.

Where can the error be? I wrote 5 days ago where is any of the victron stuff?

1 comment
2 |3000

Up to 8 attachments (including images) can be used with a maximum of 190.8 MiB each and 286.6 MiB total.