question

mvader (Victron Energy) avatar image
mvader (Victron Energy) asked

RS shade performance testing - v1.16-beta-02

Hello all!


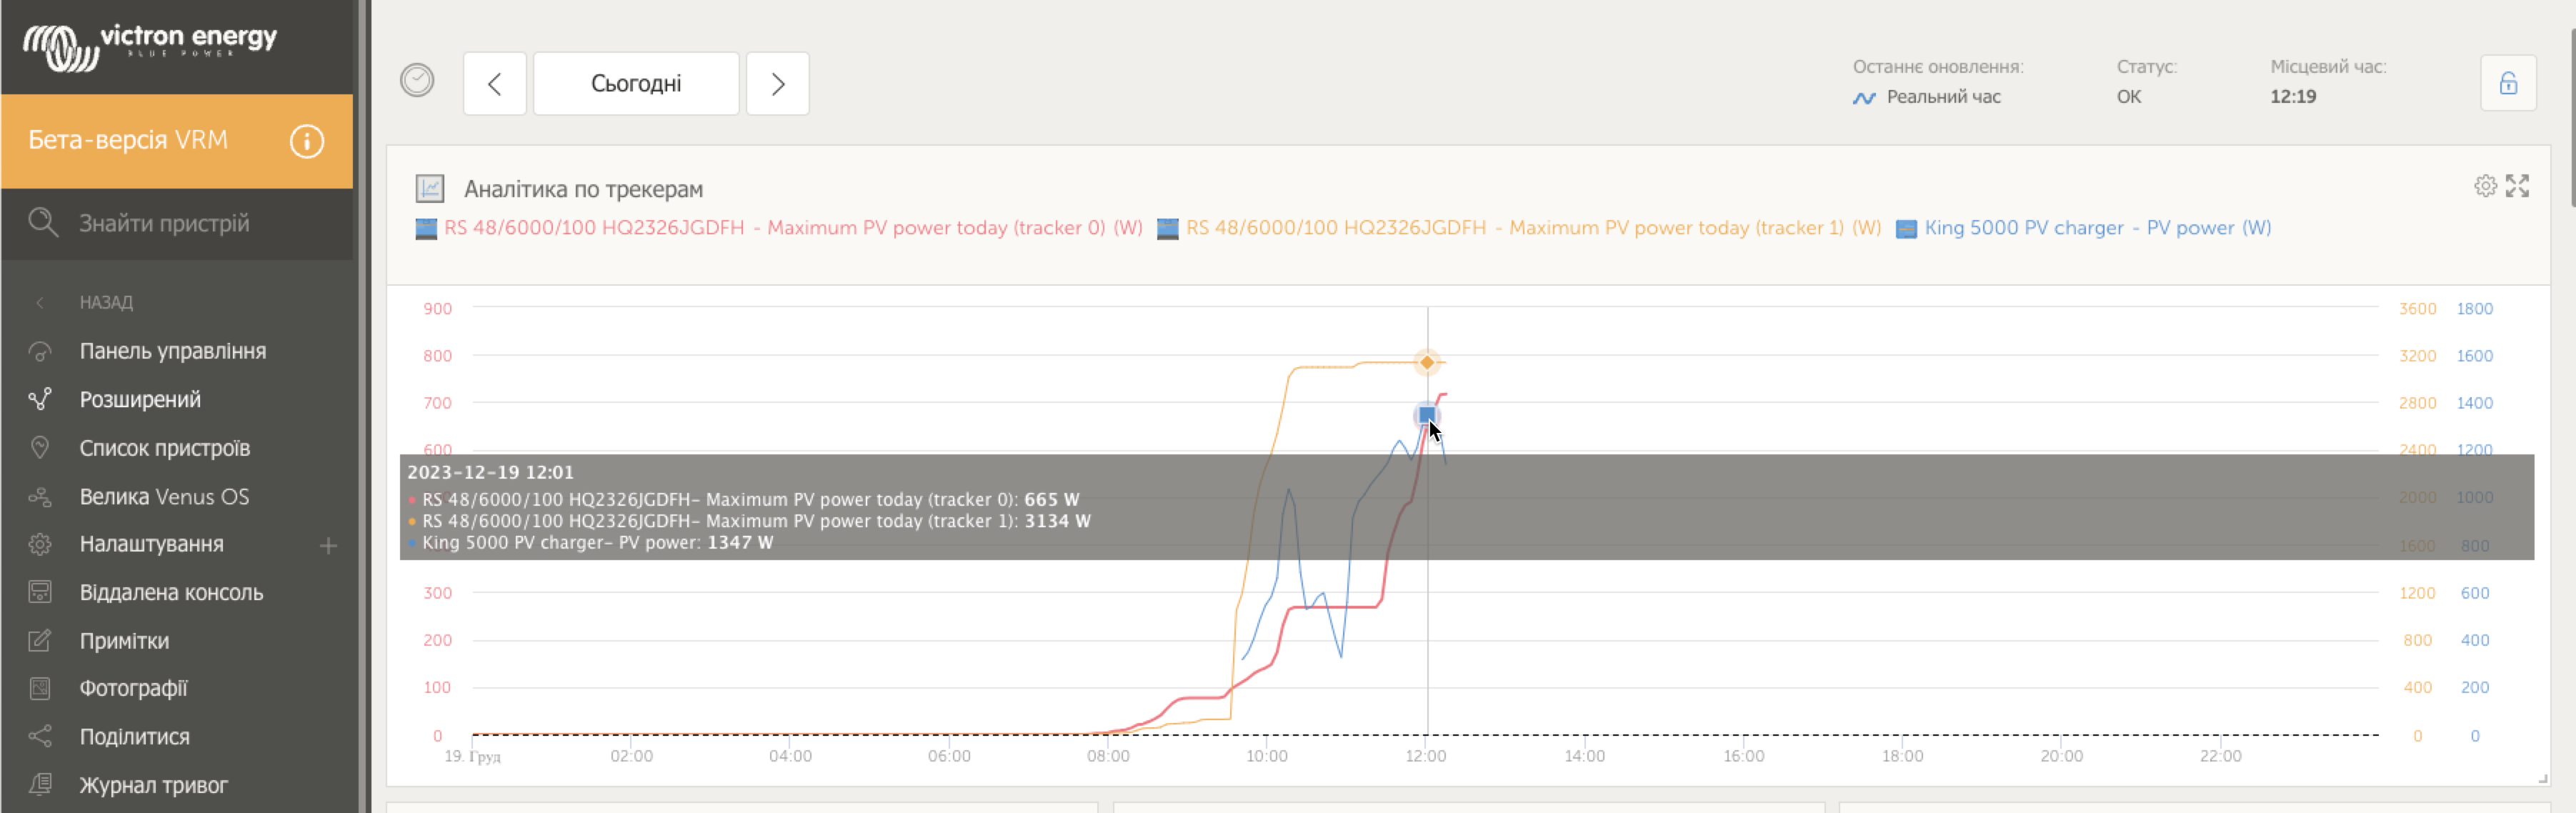
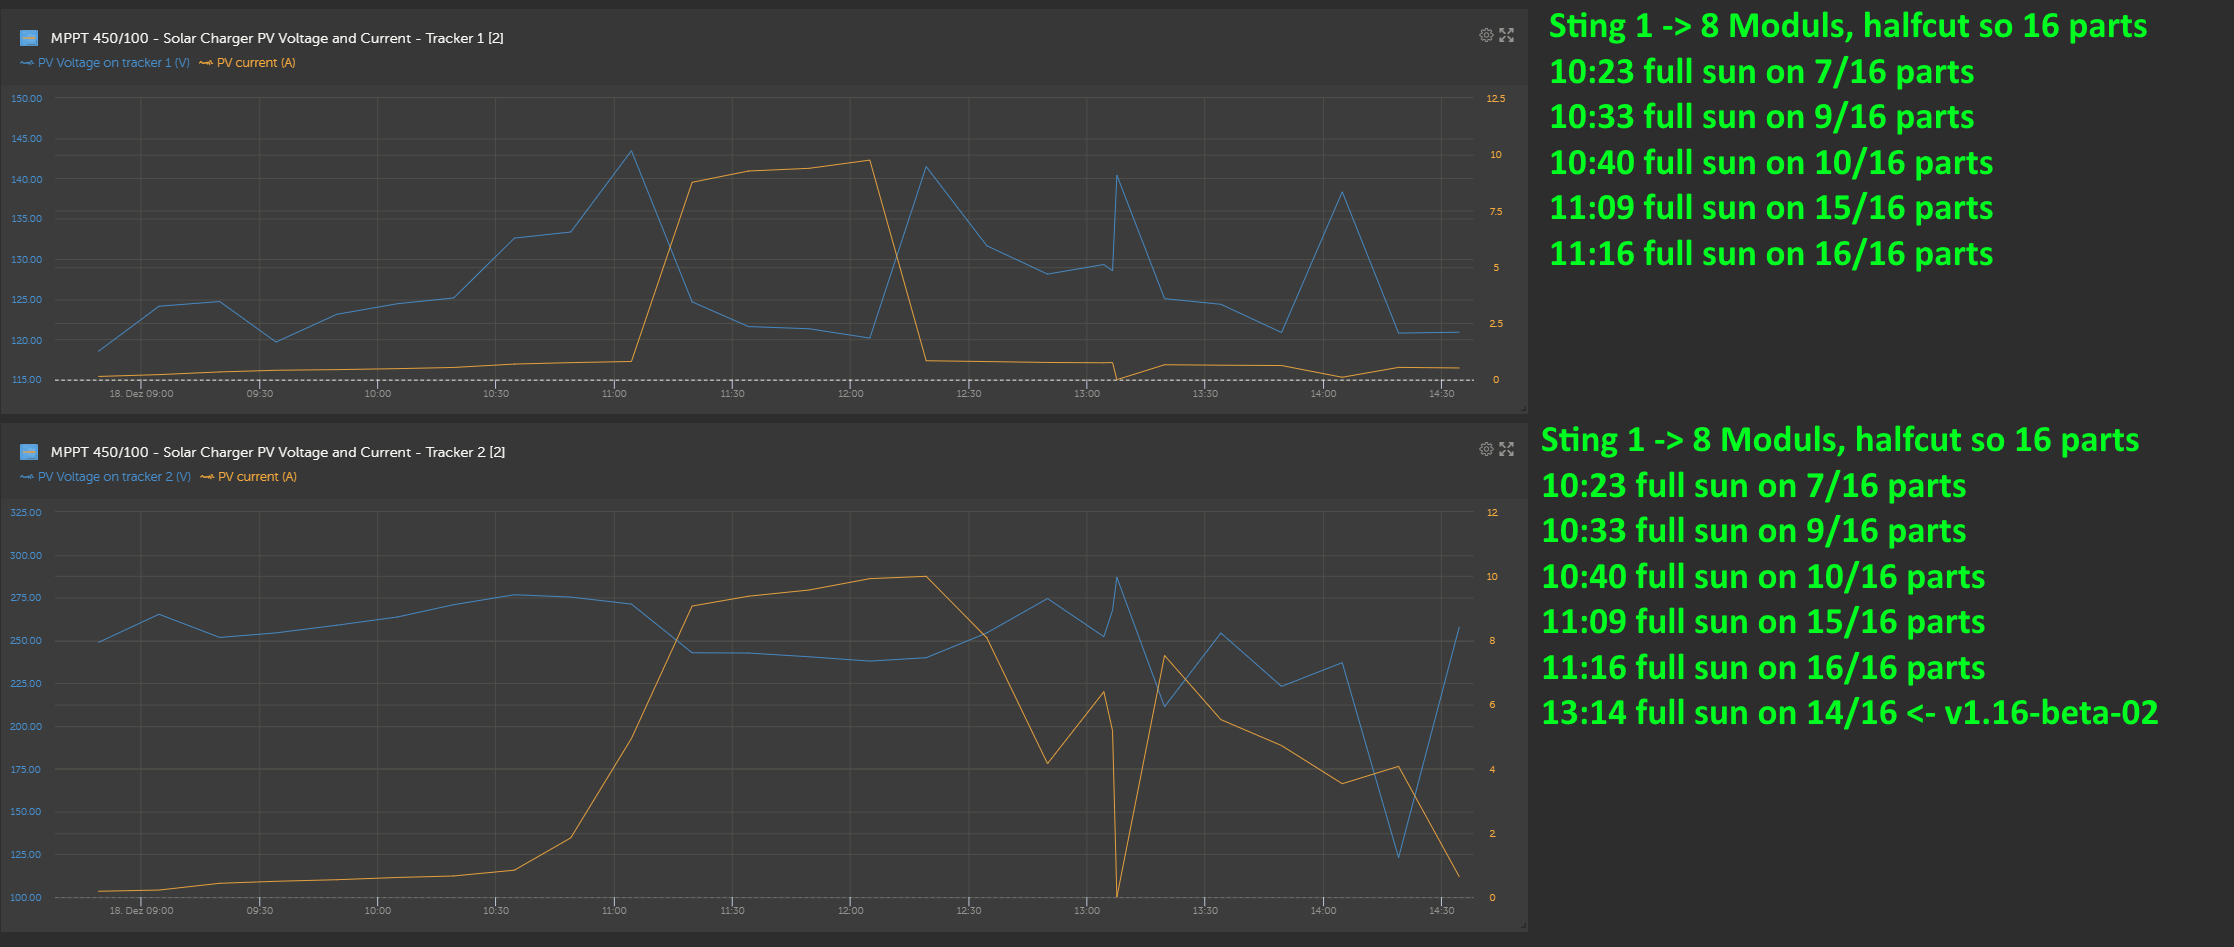
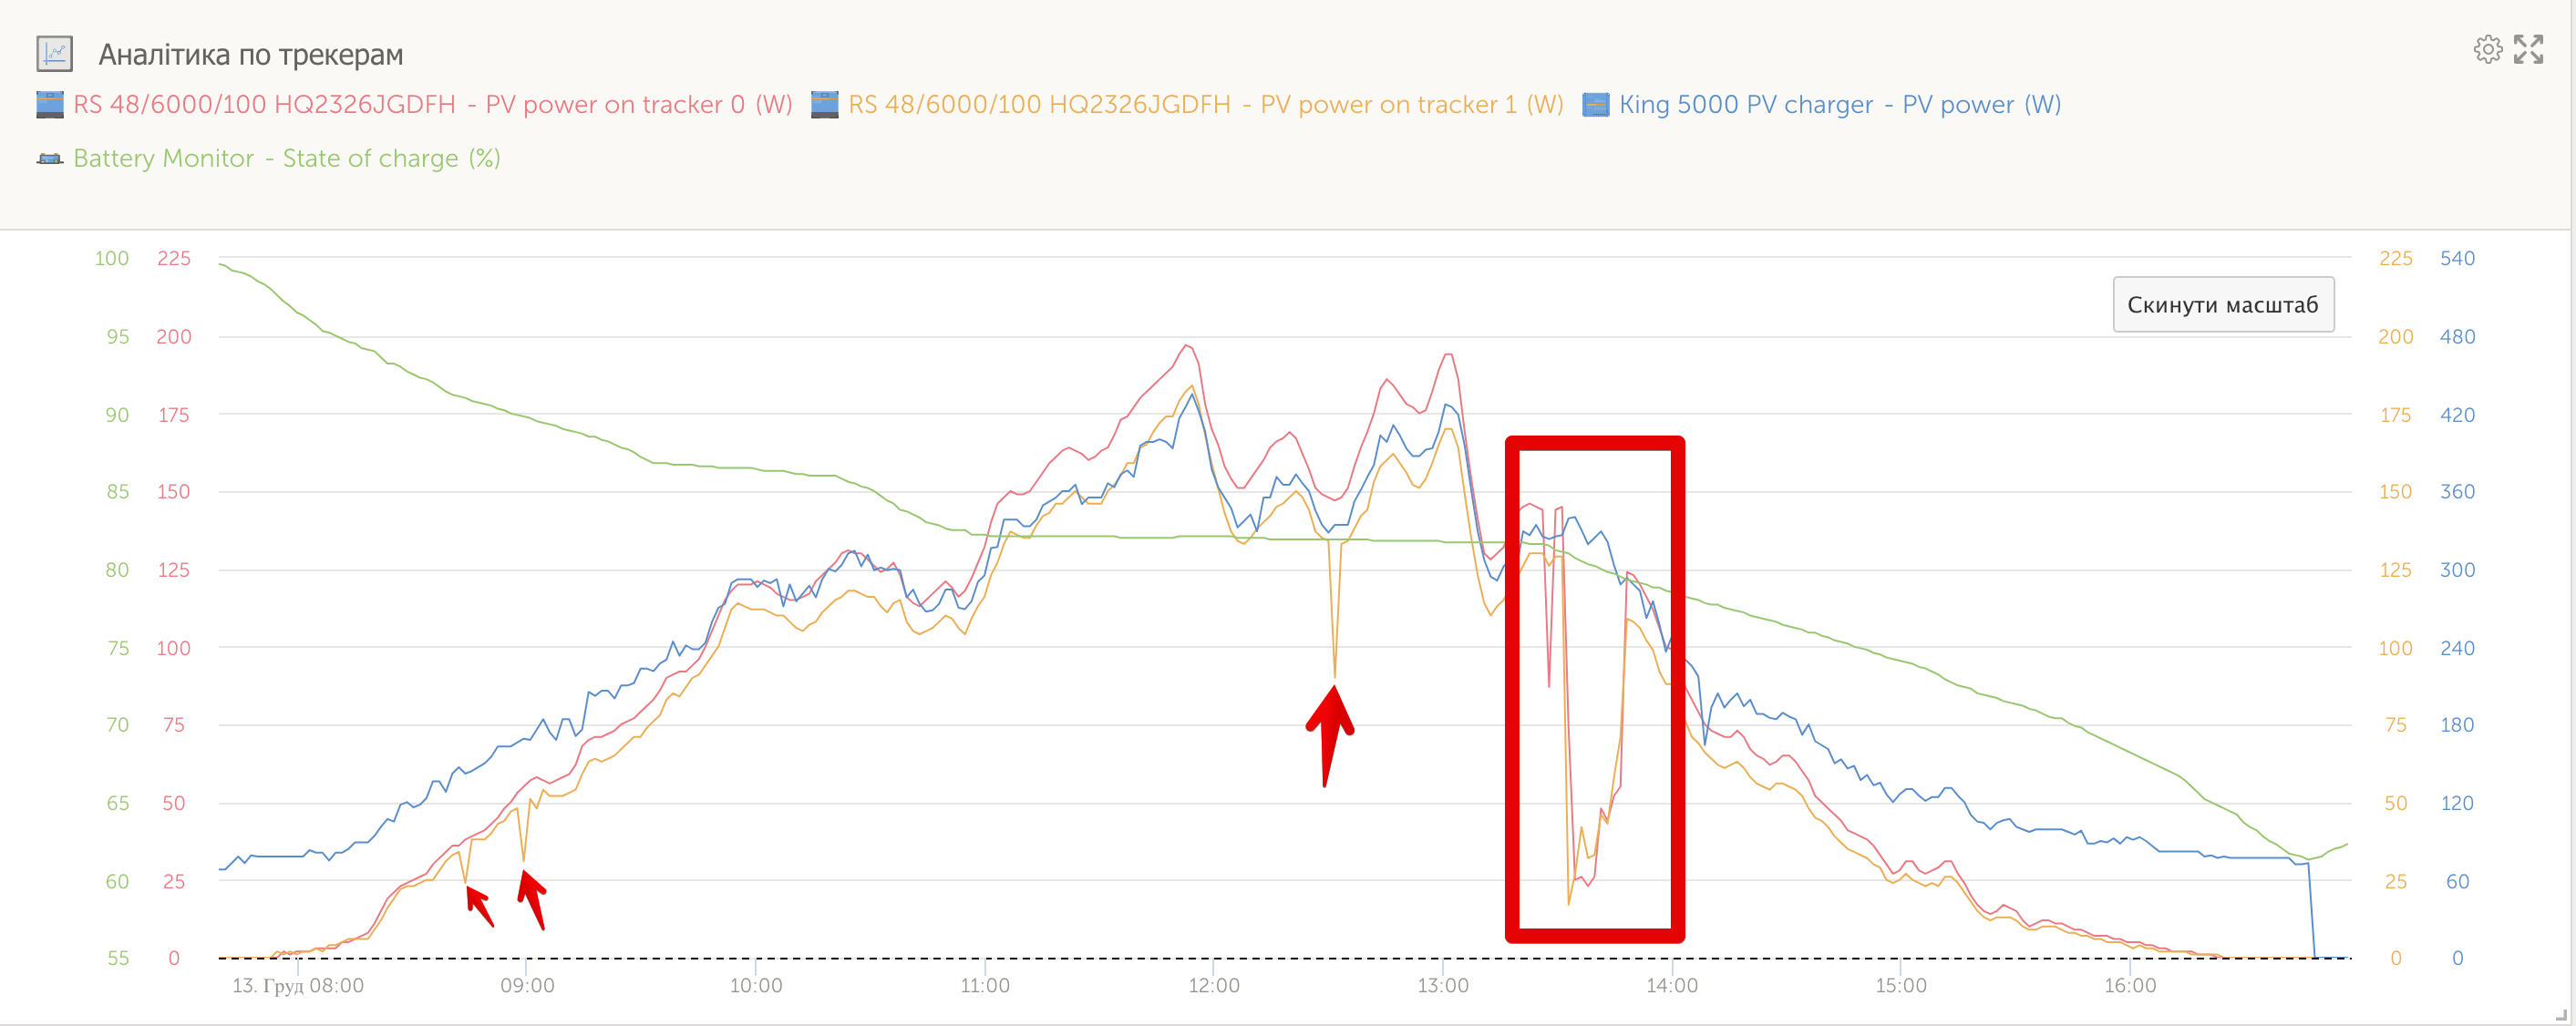
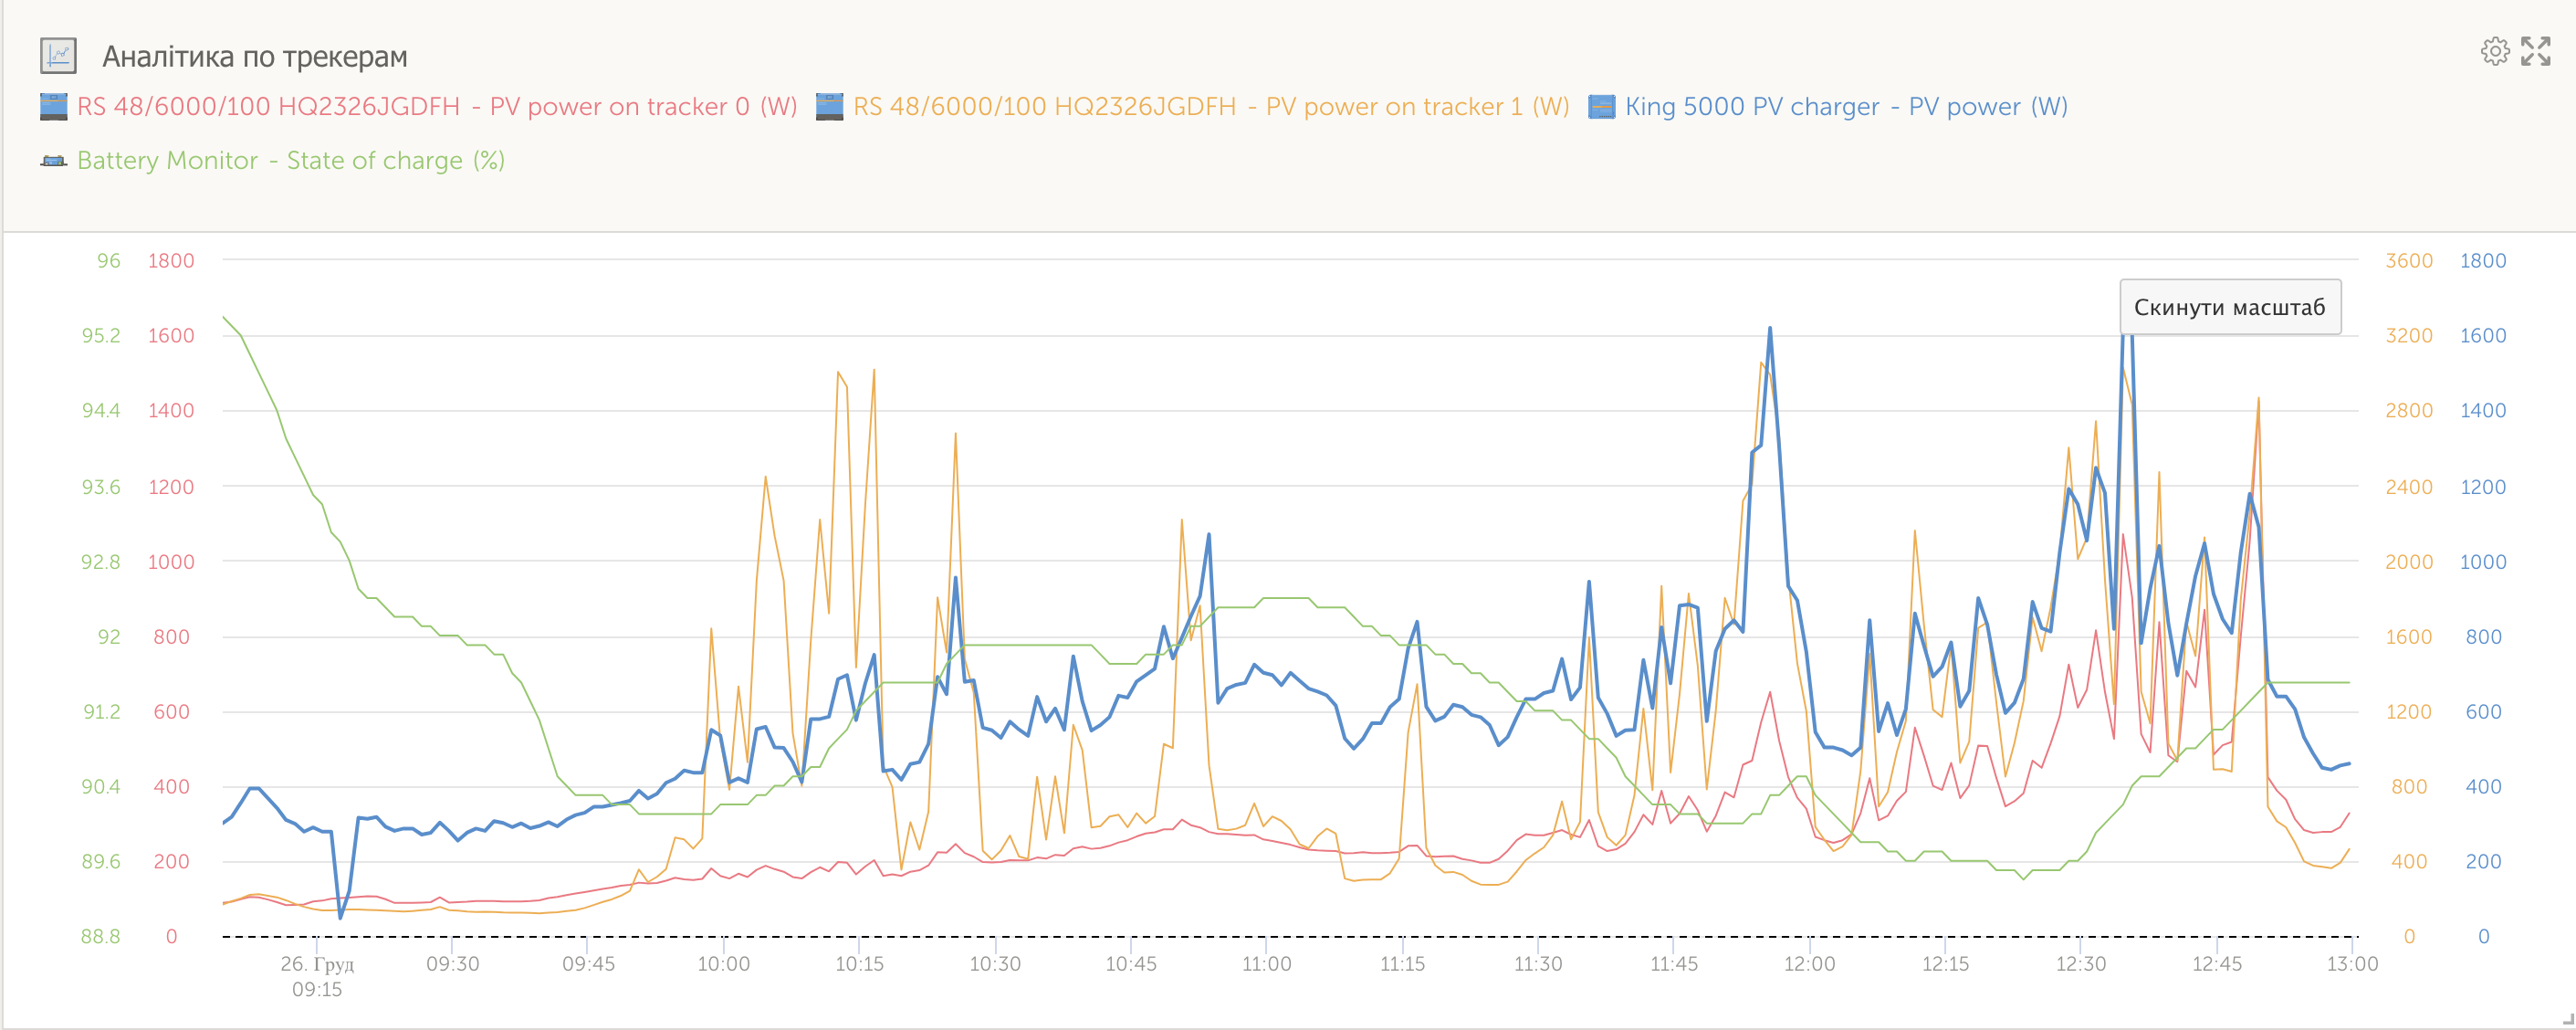
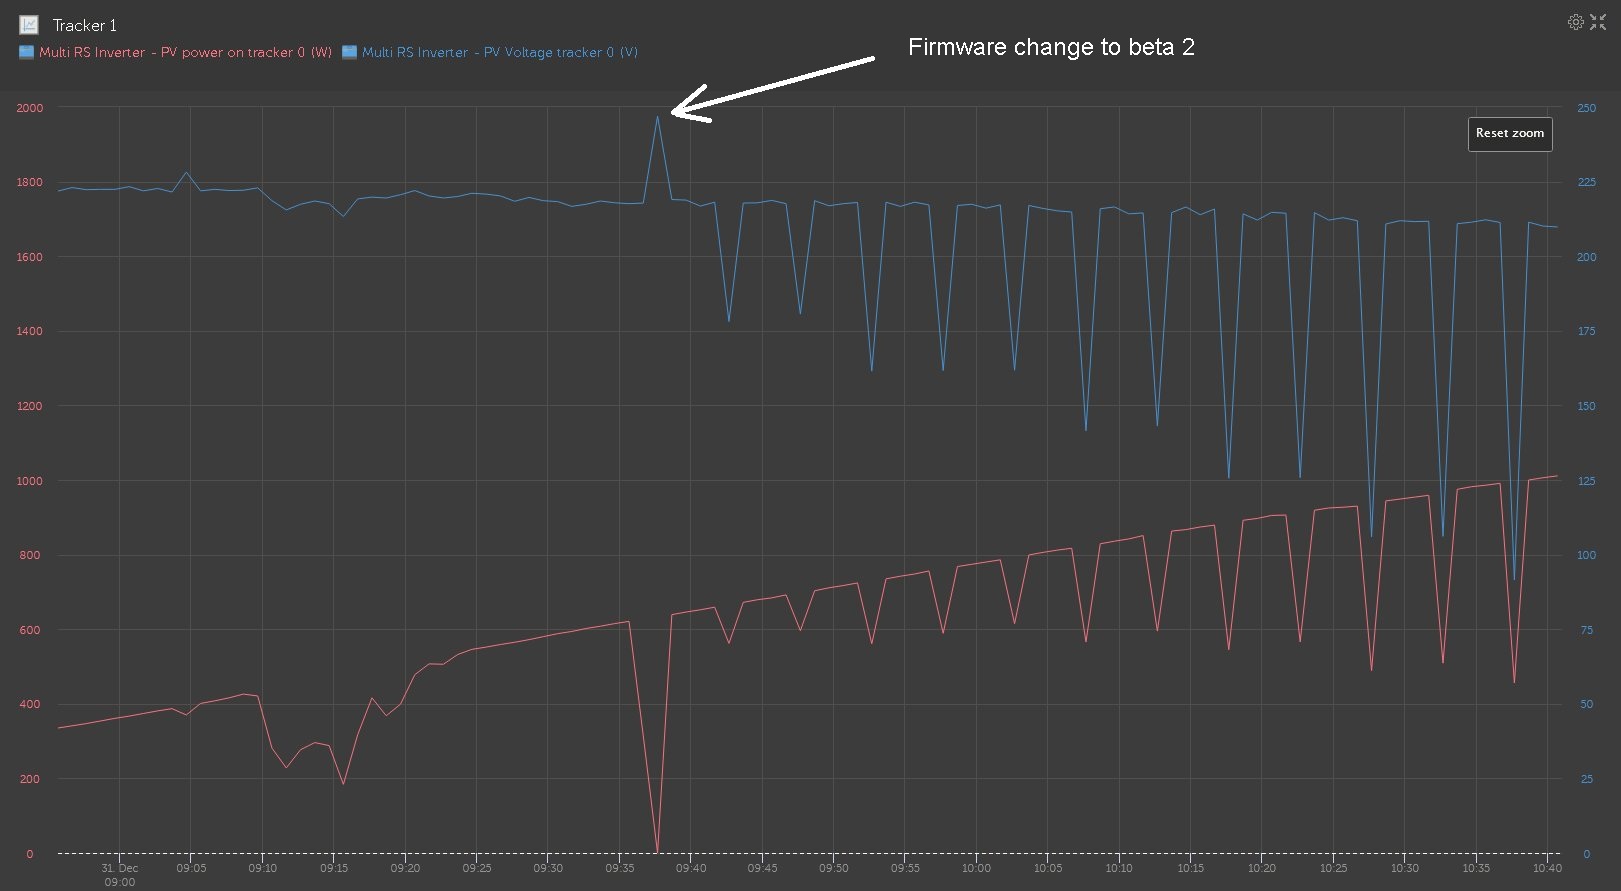
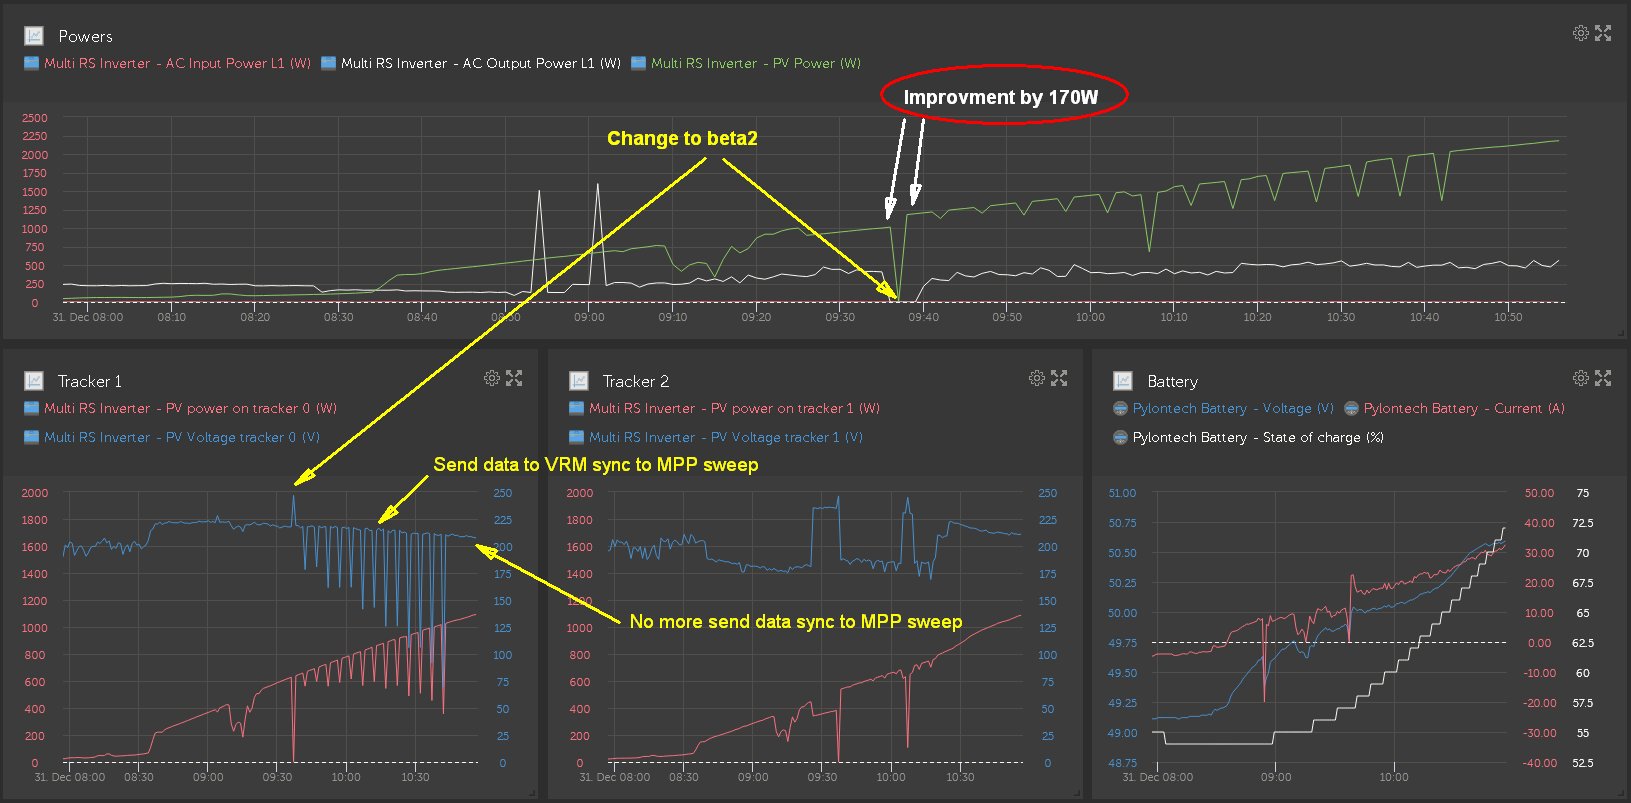
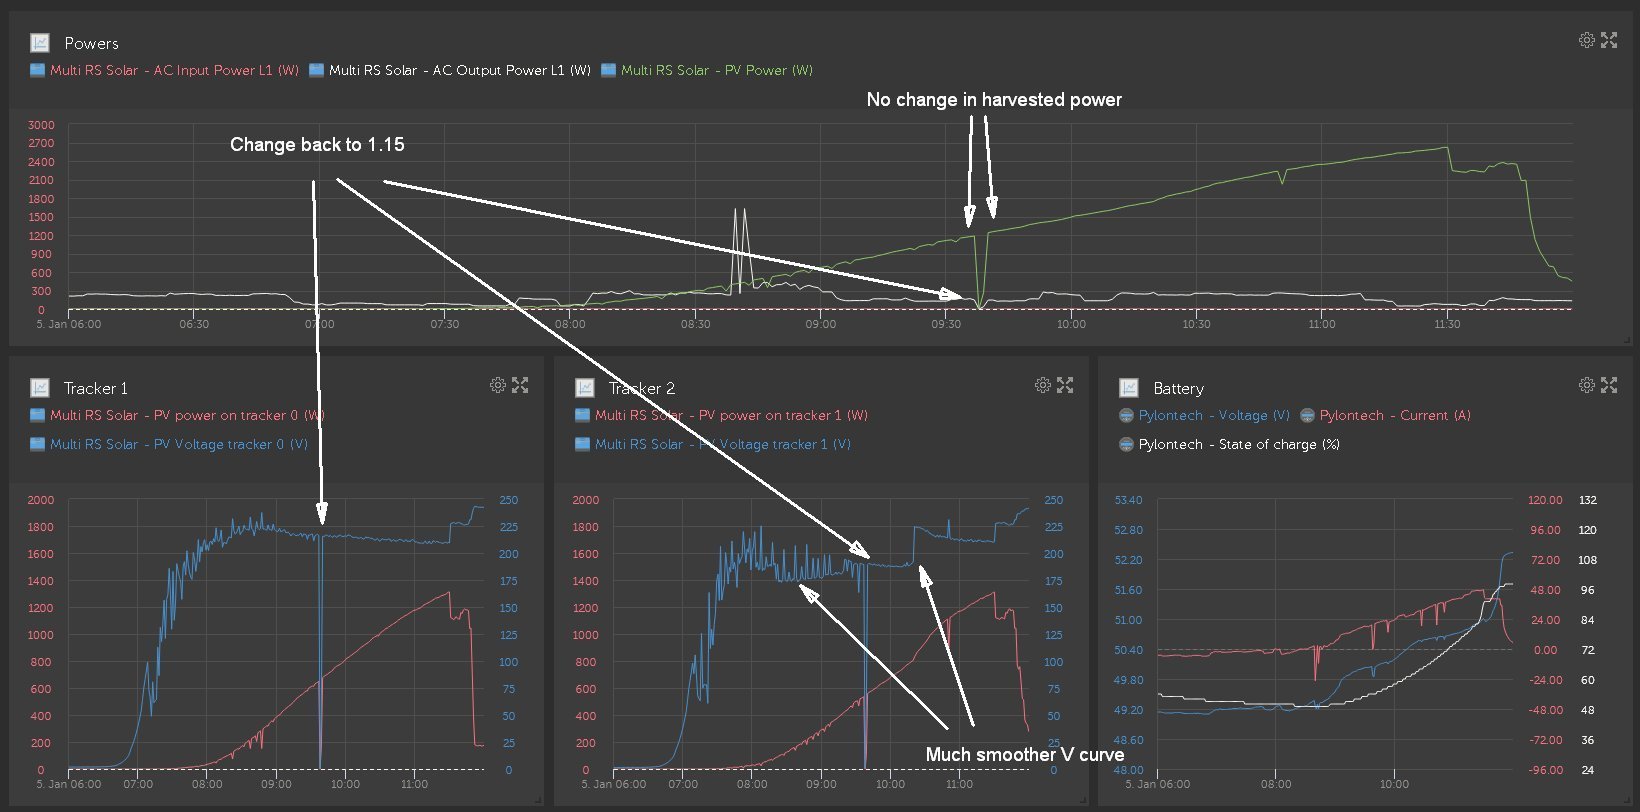
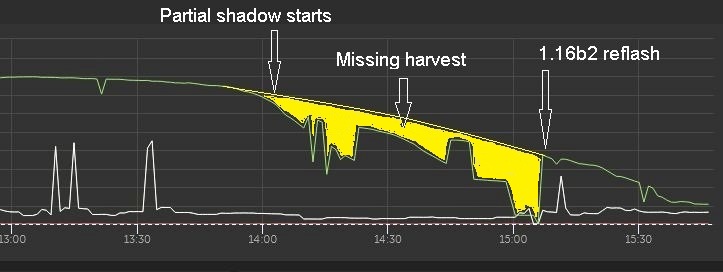
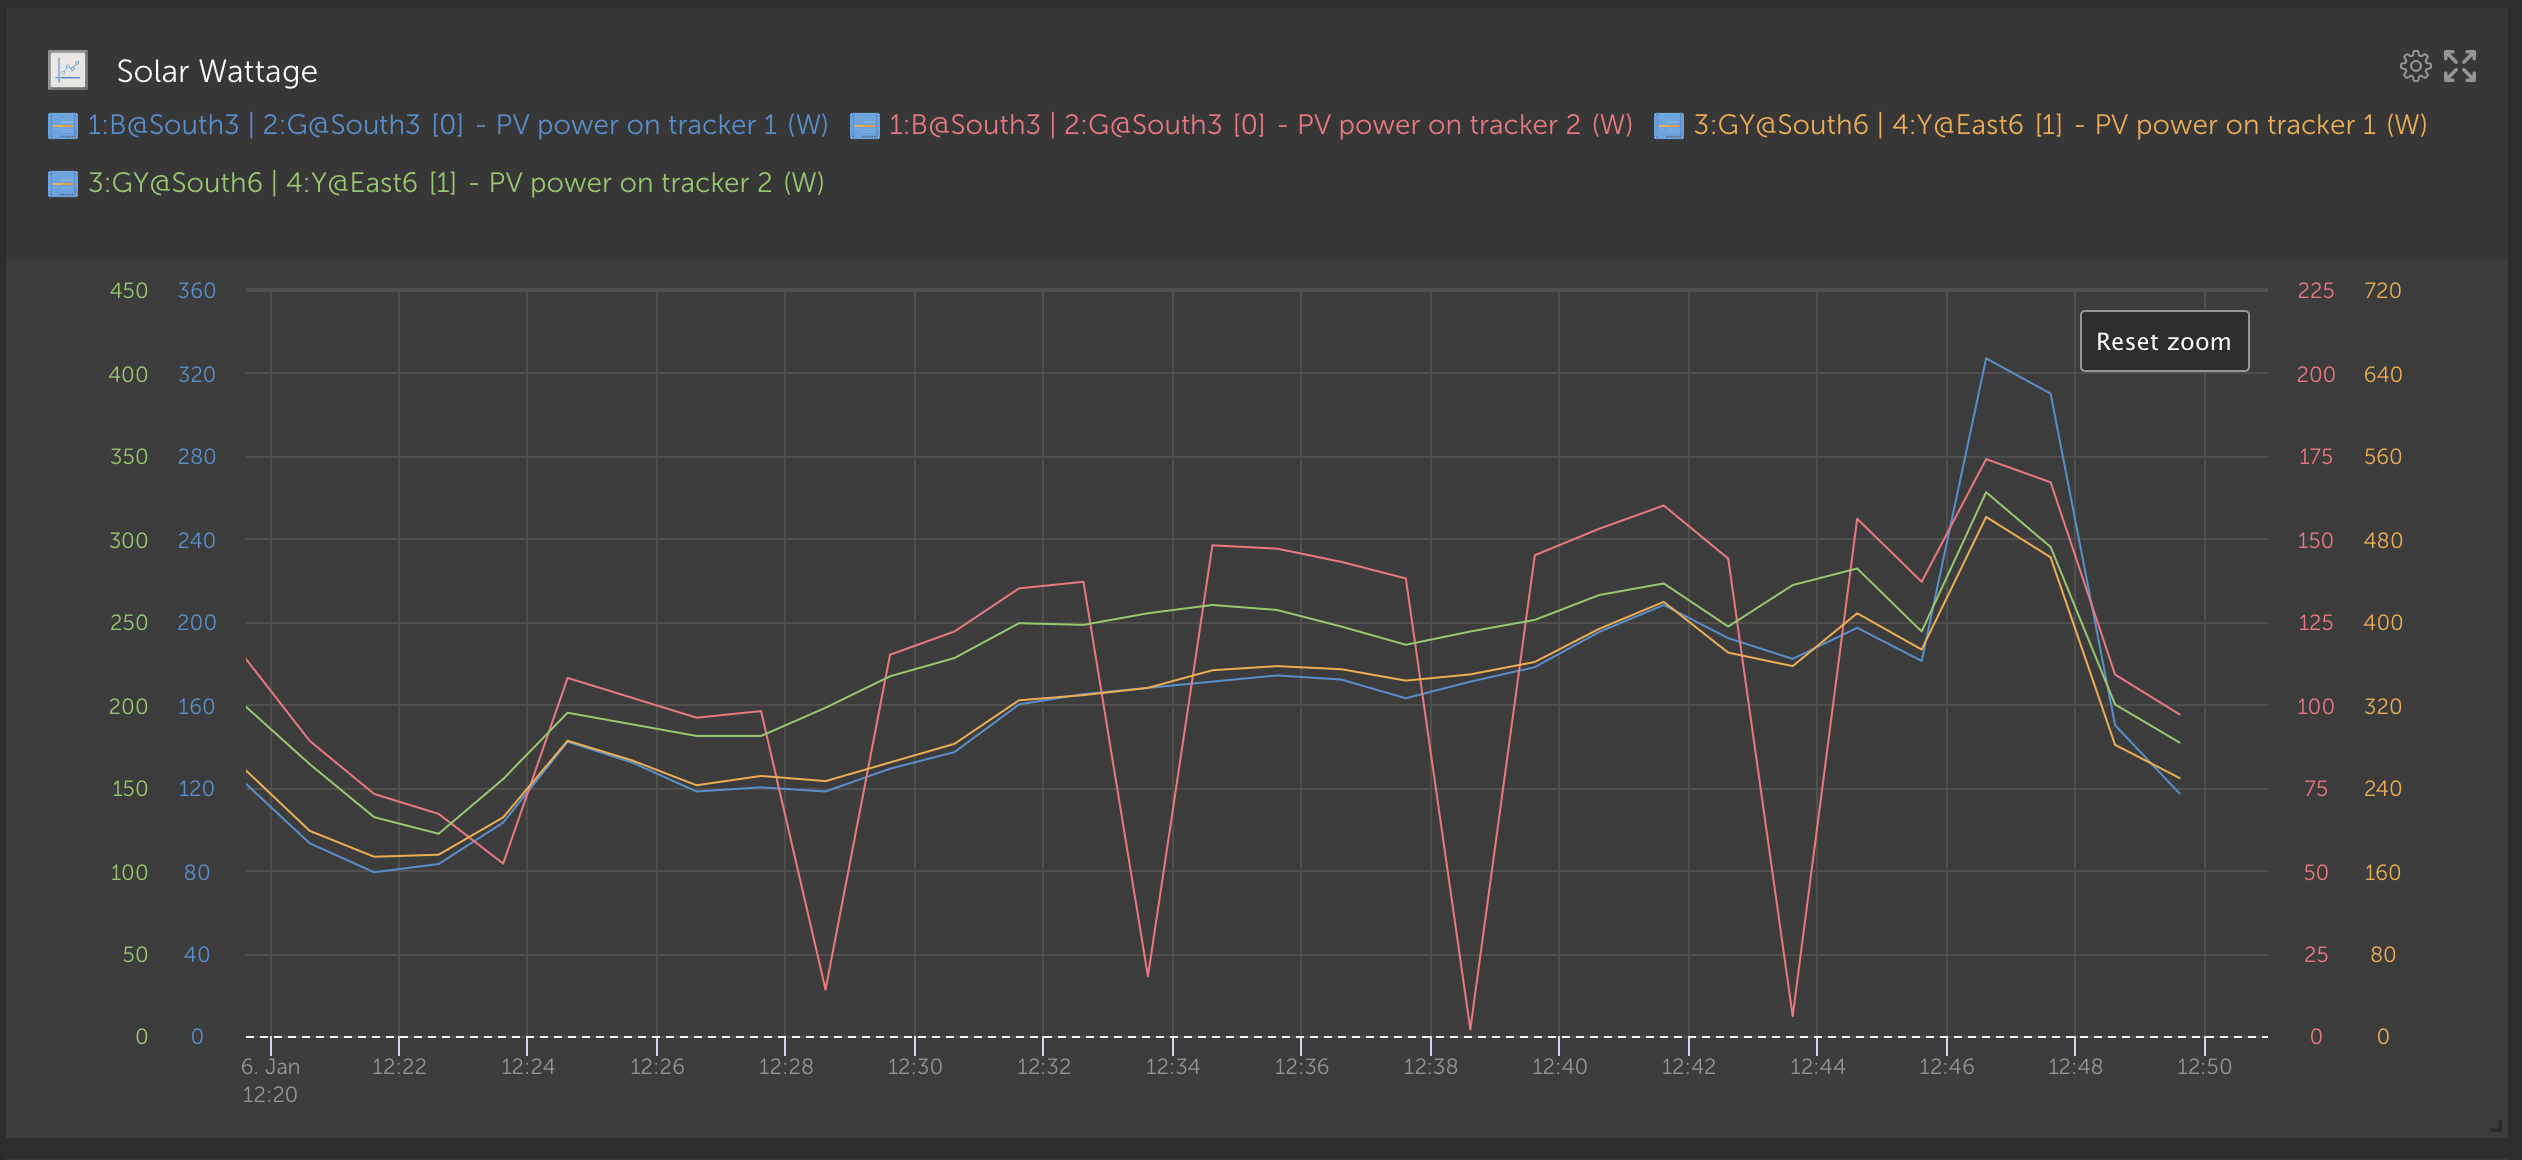
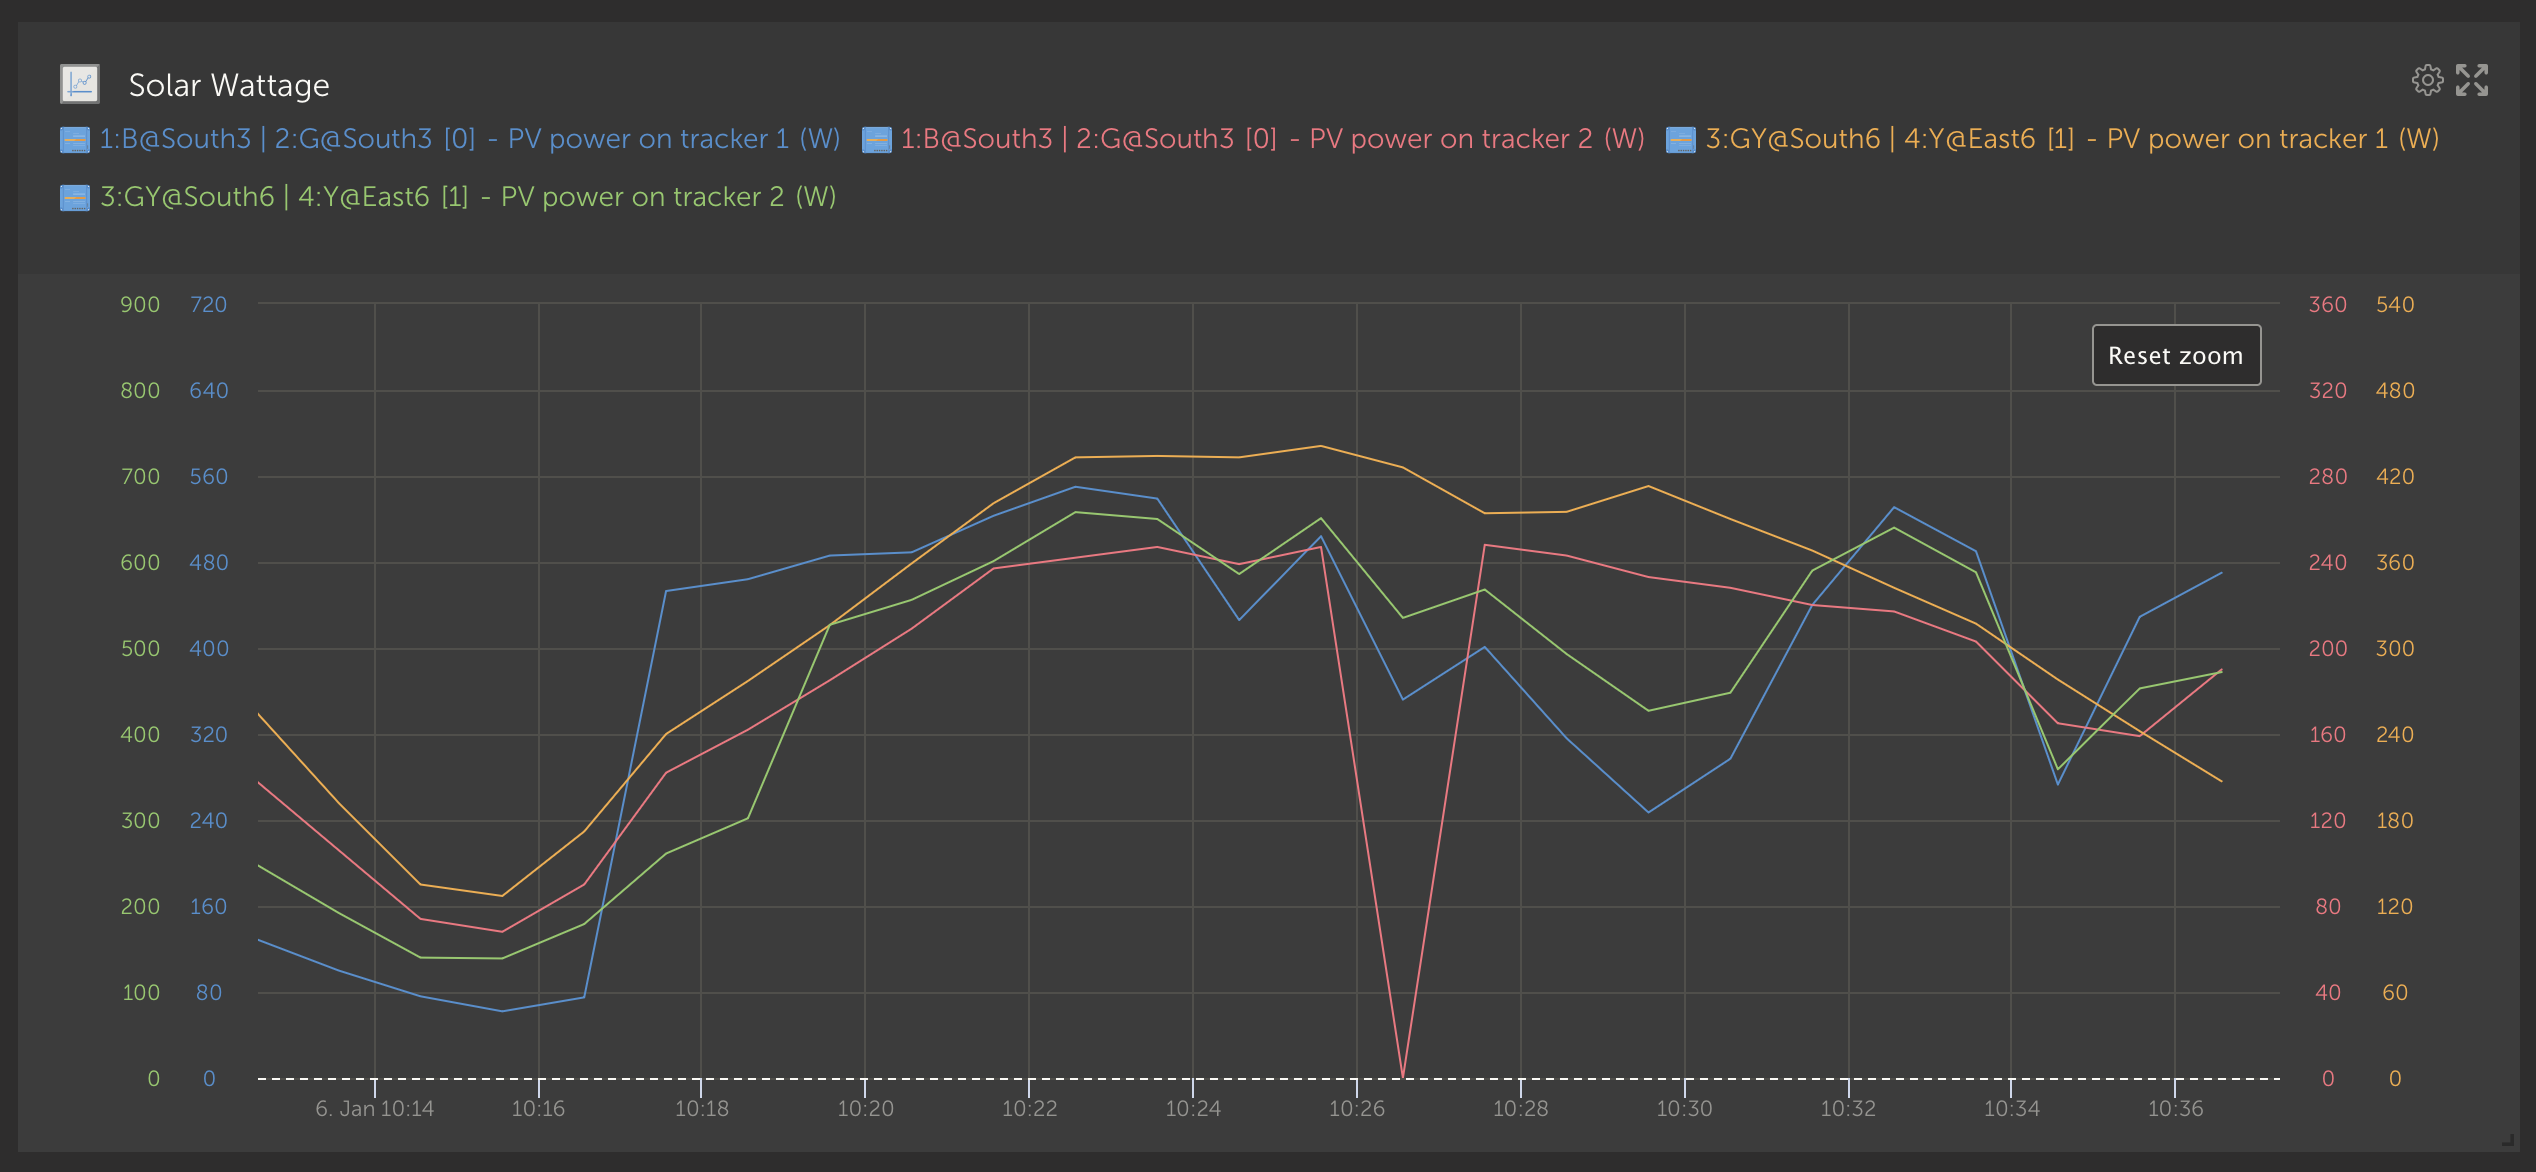
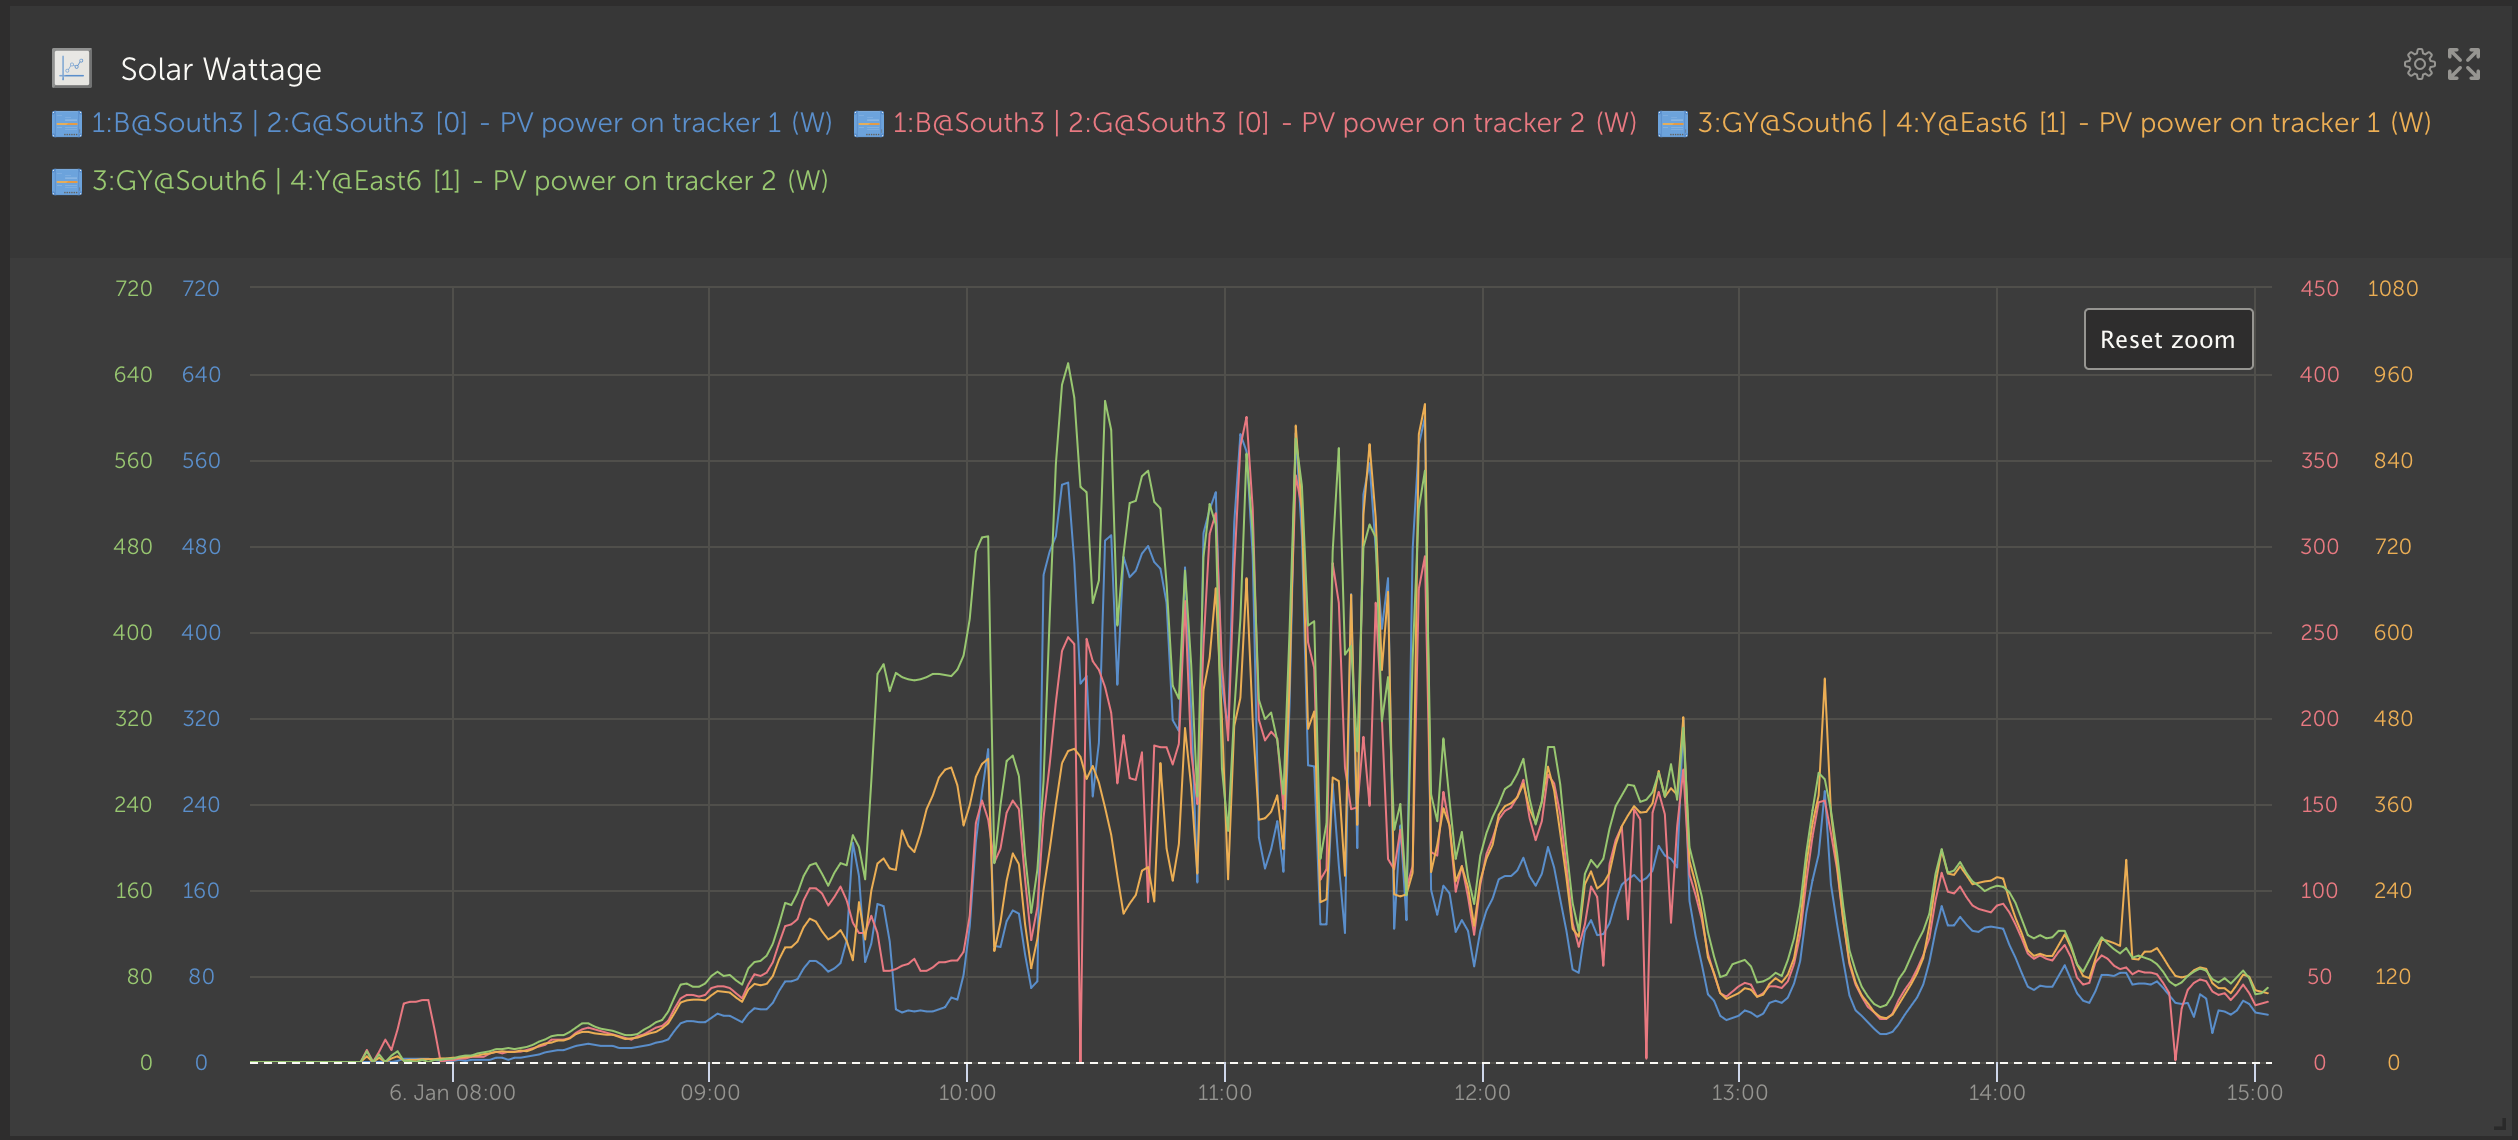
Thank you for all involved in helping and improving the partial shading algorithm in the MPPTs in the MPPT RS models. For details on that, see this thread.

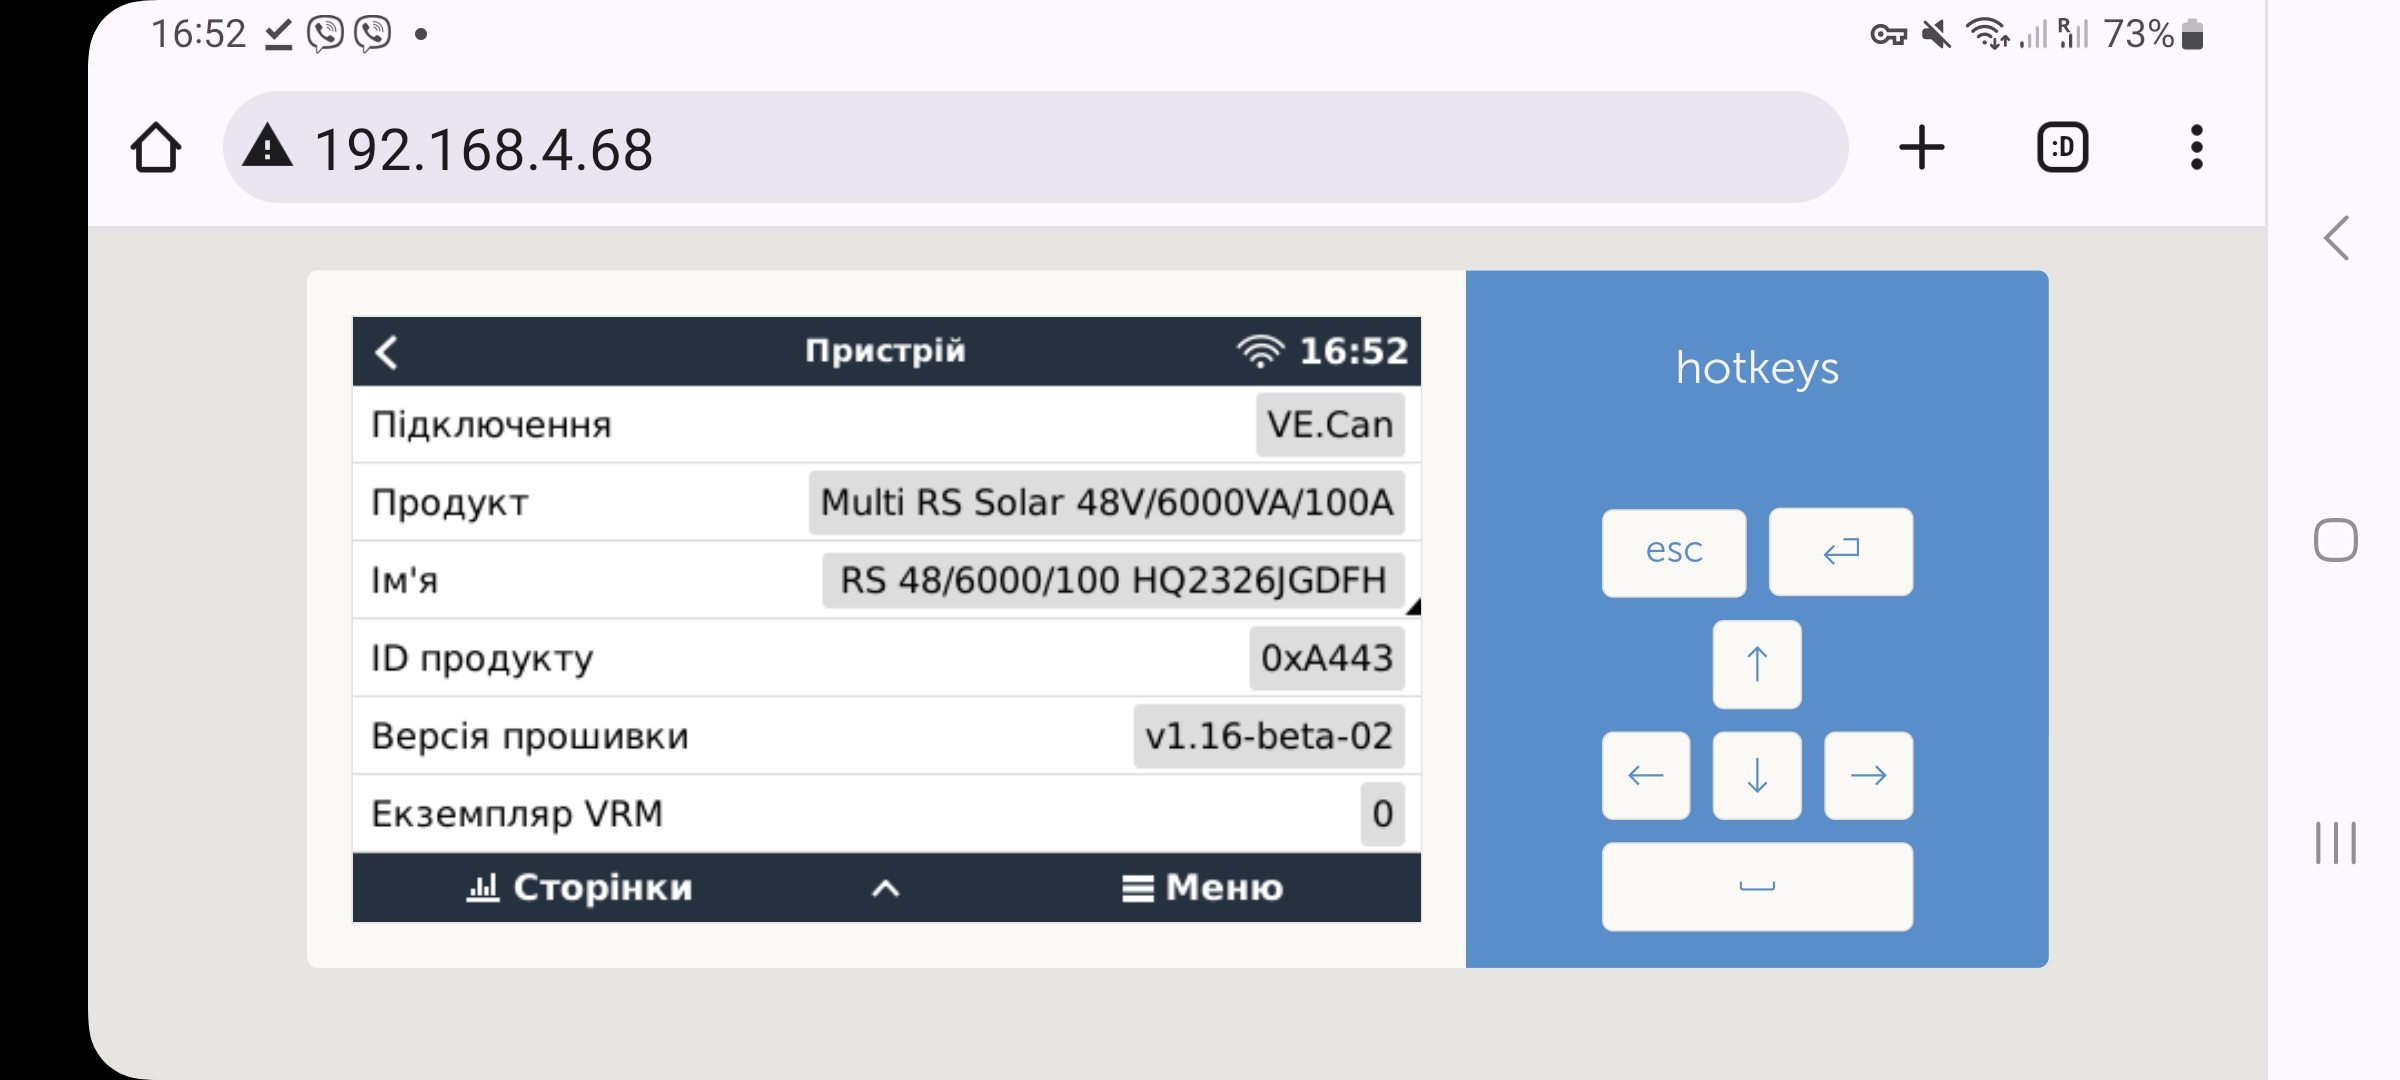
Per today we have a new version available, v1.16-beta-02. Full change log below.

We're keen to release this version officially, since it contains various fixes and improvements; including the important one in the partial shading algorithm:

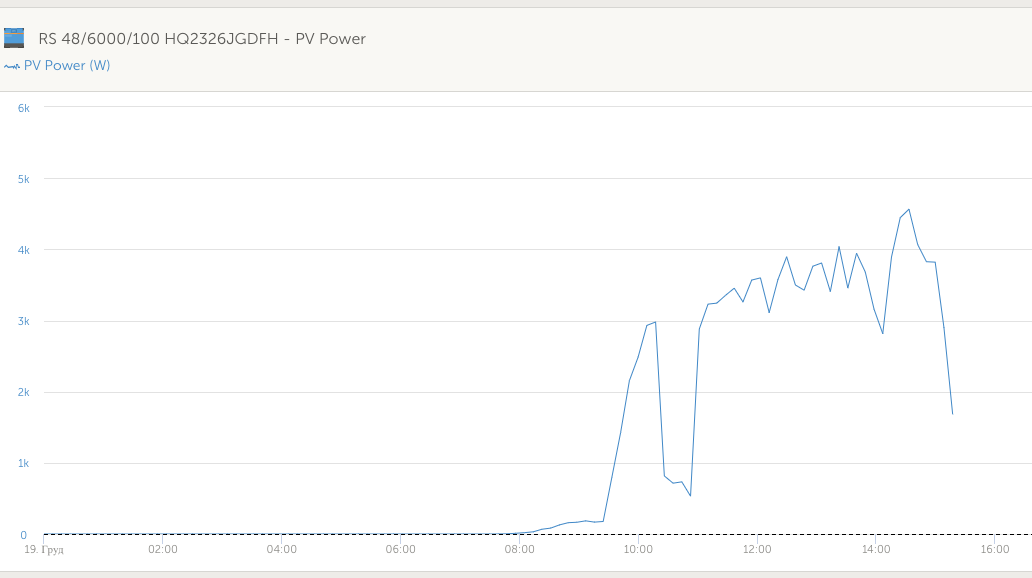
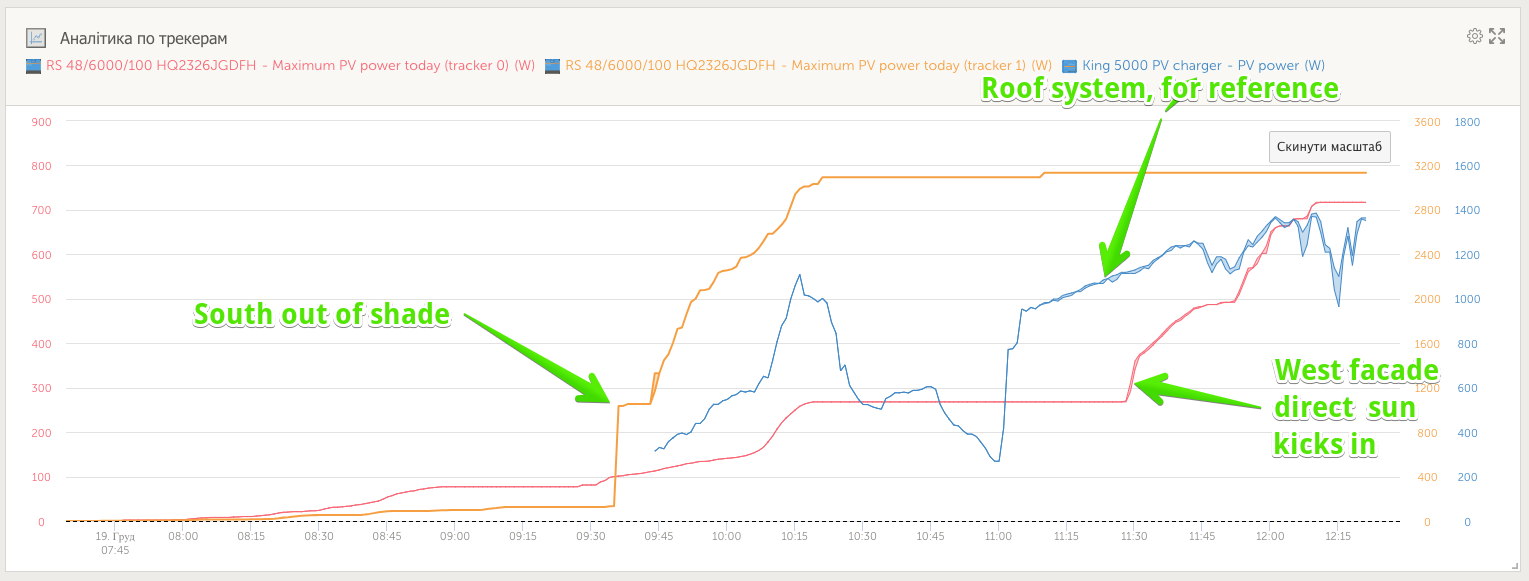
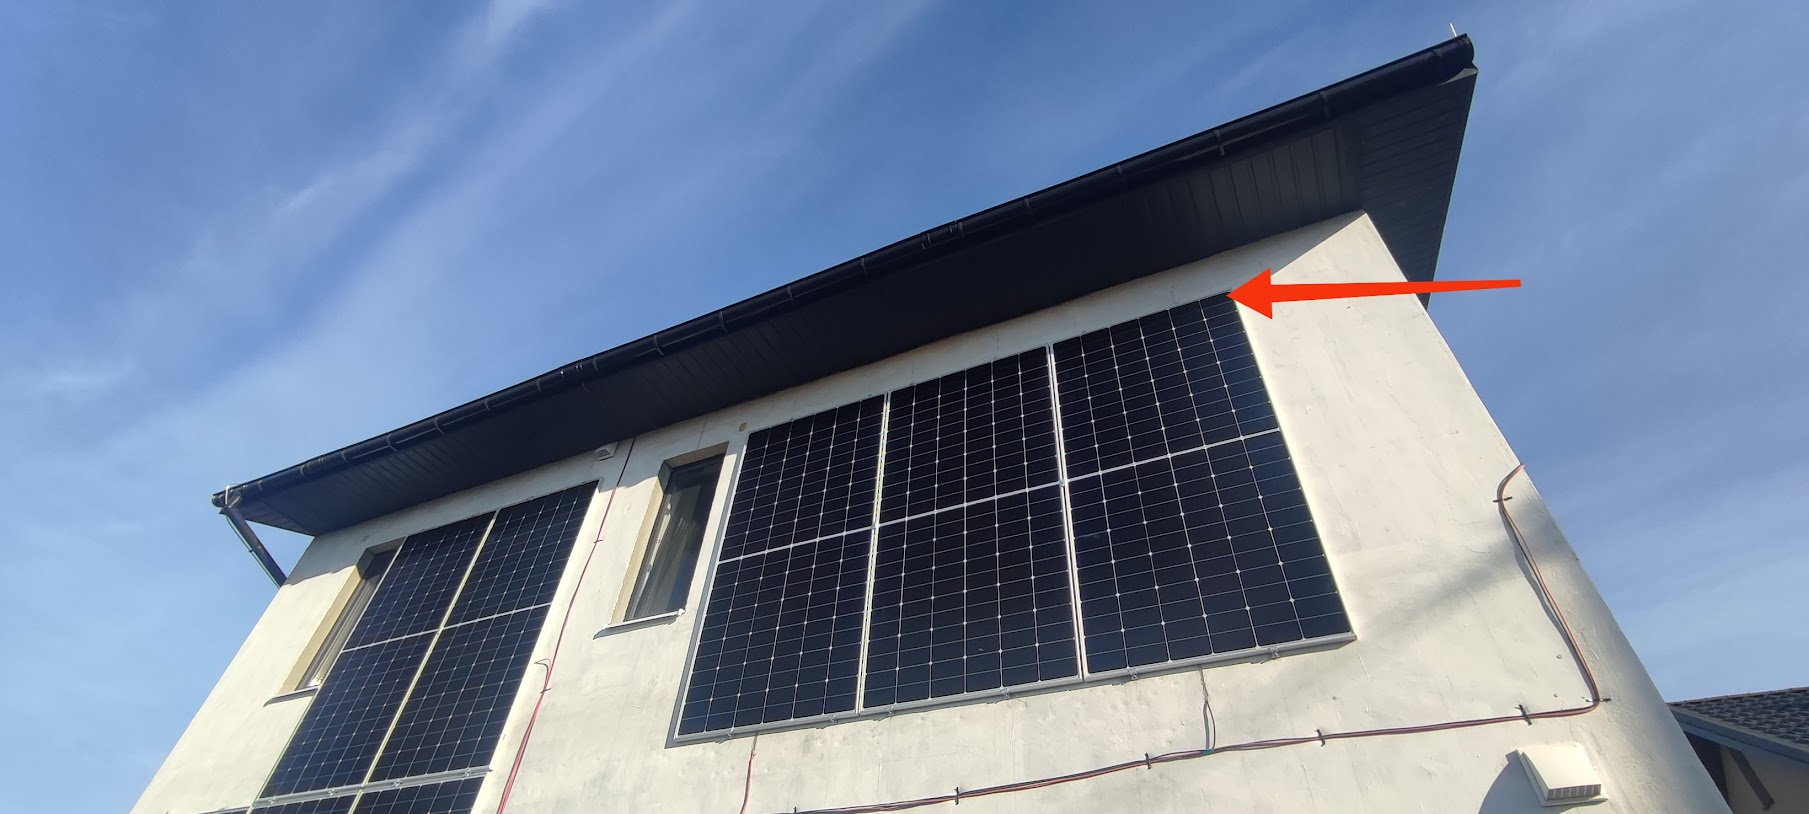
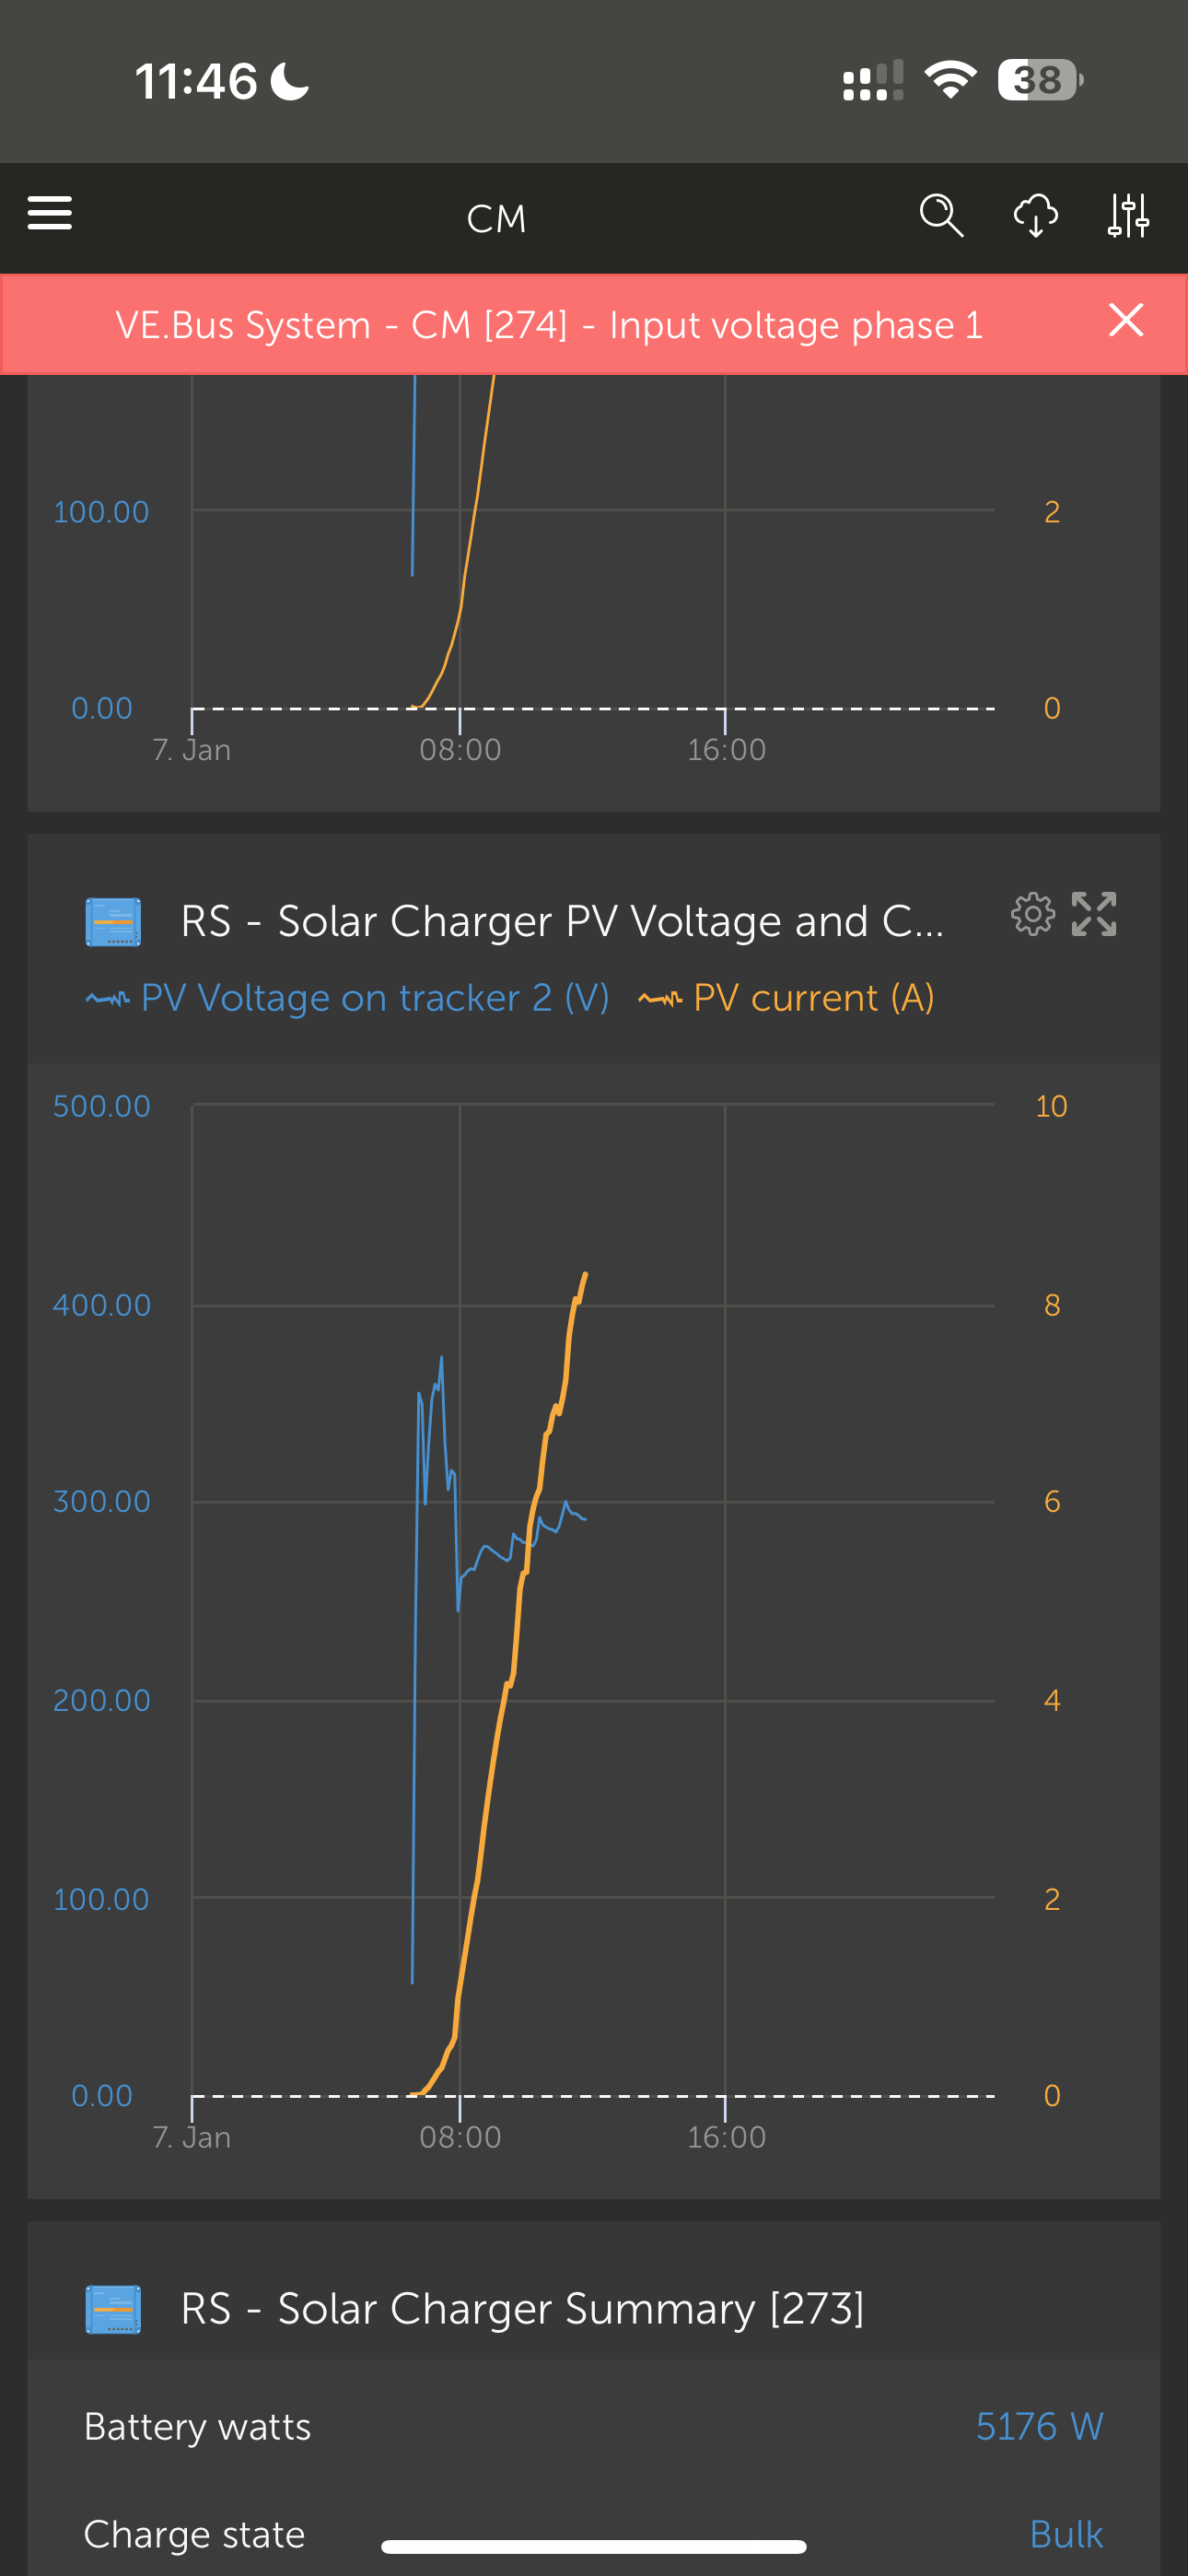
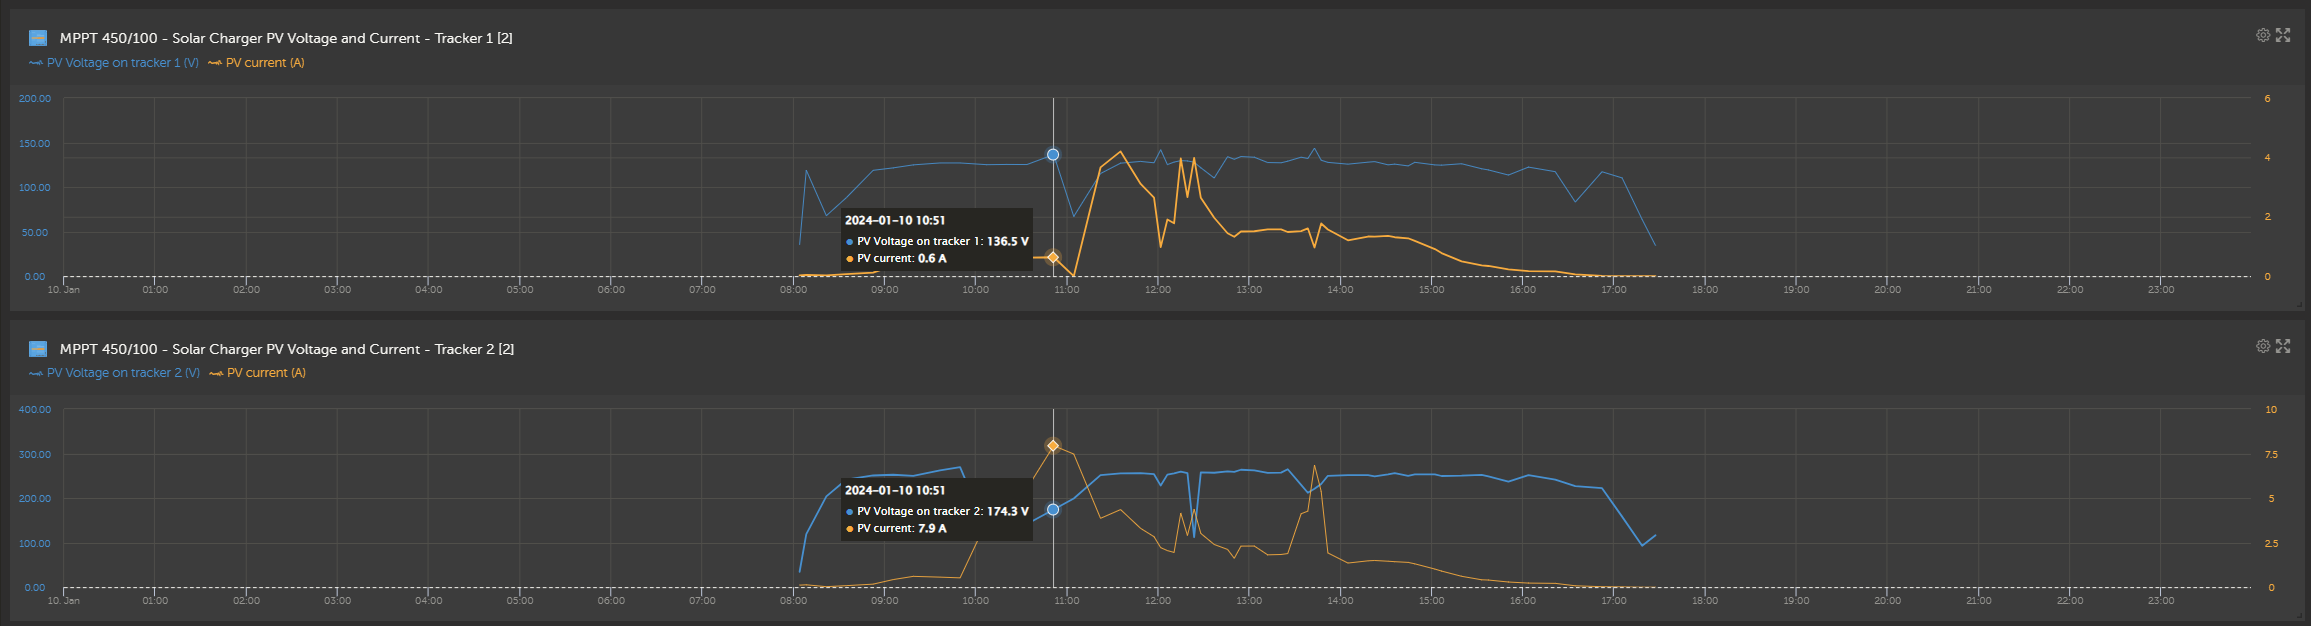
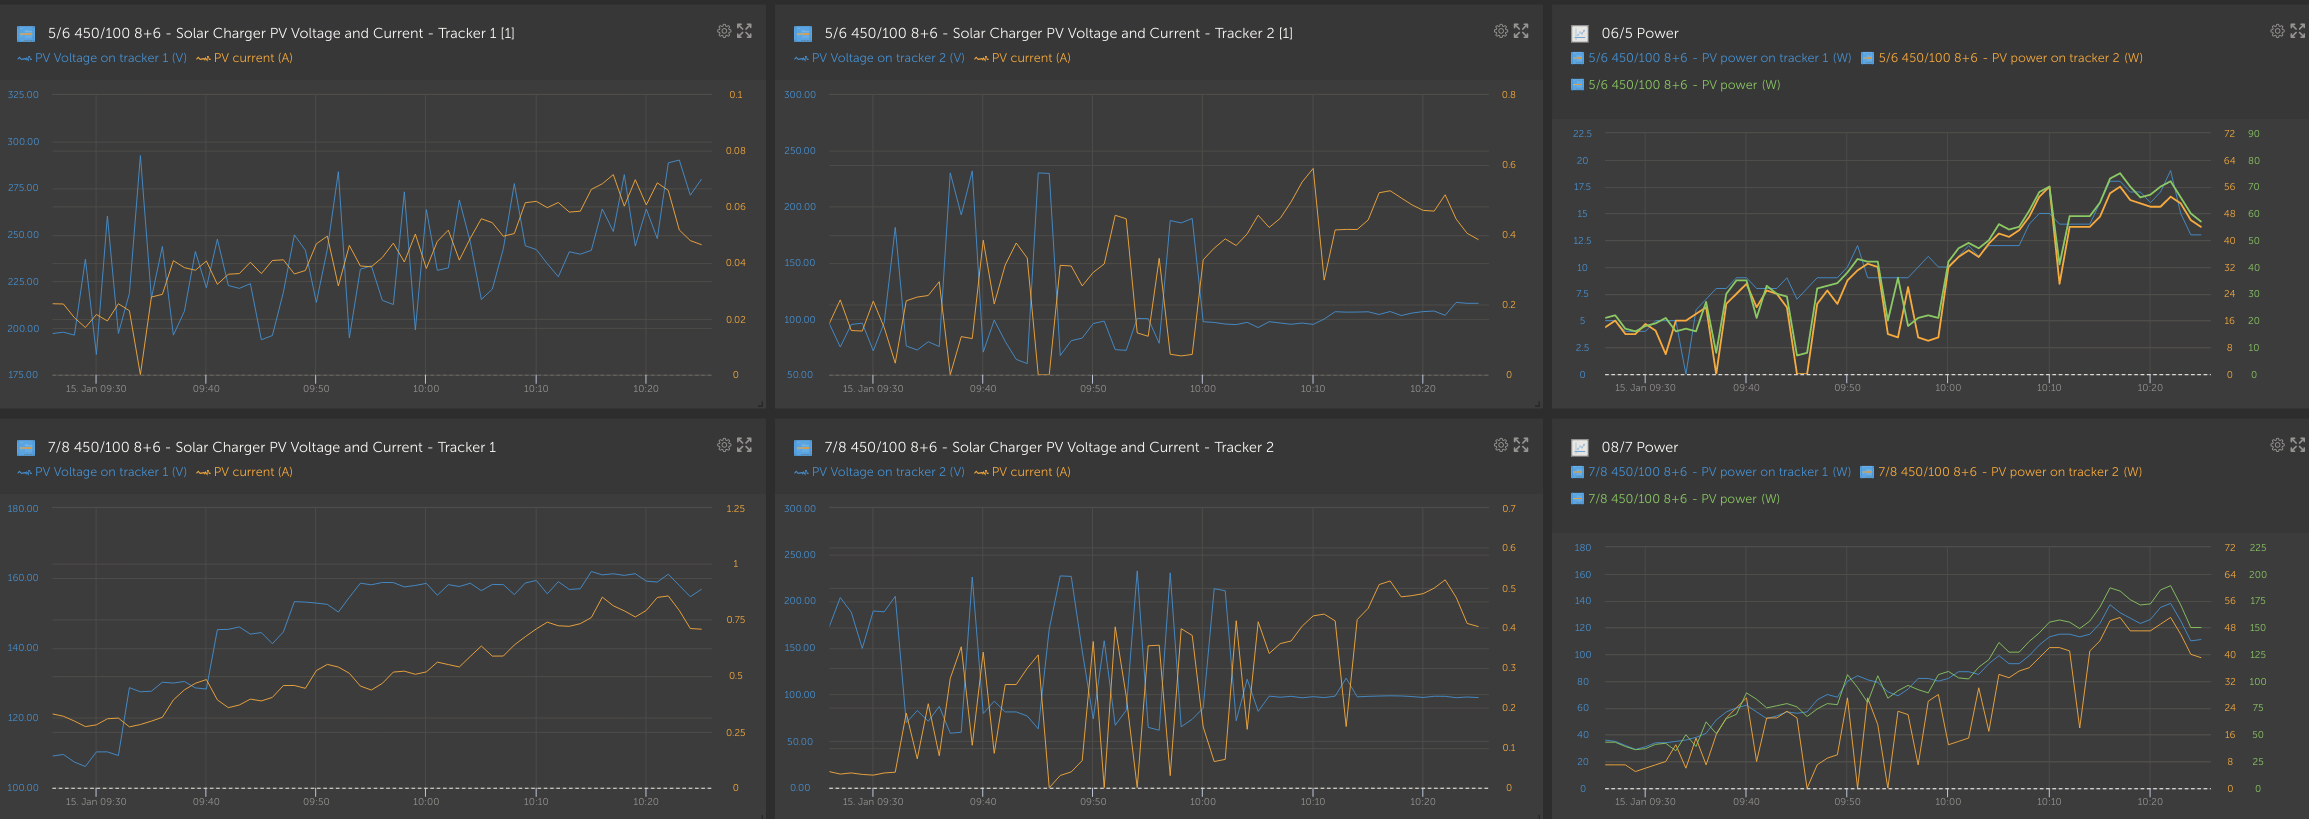
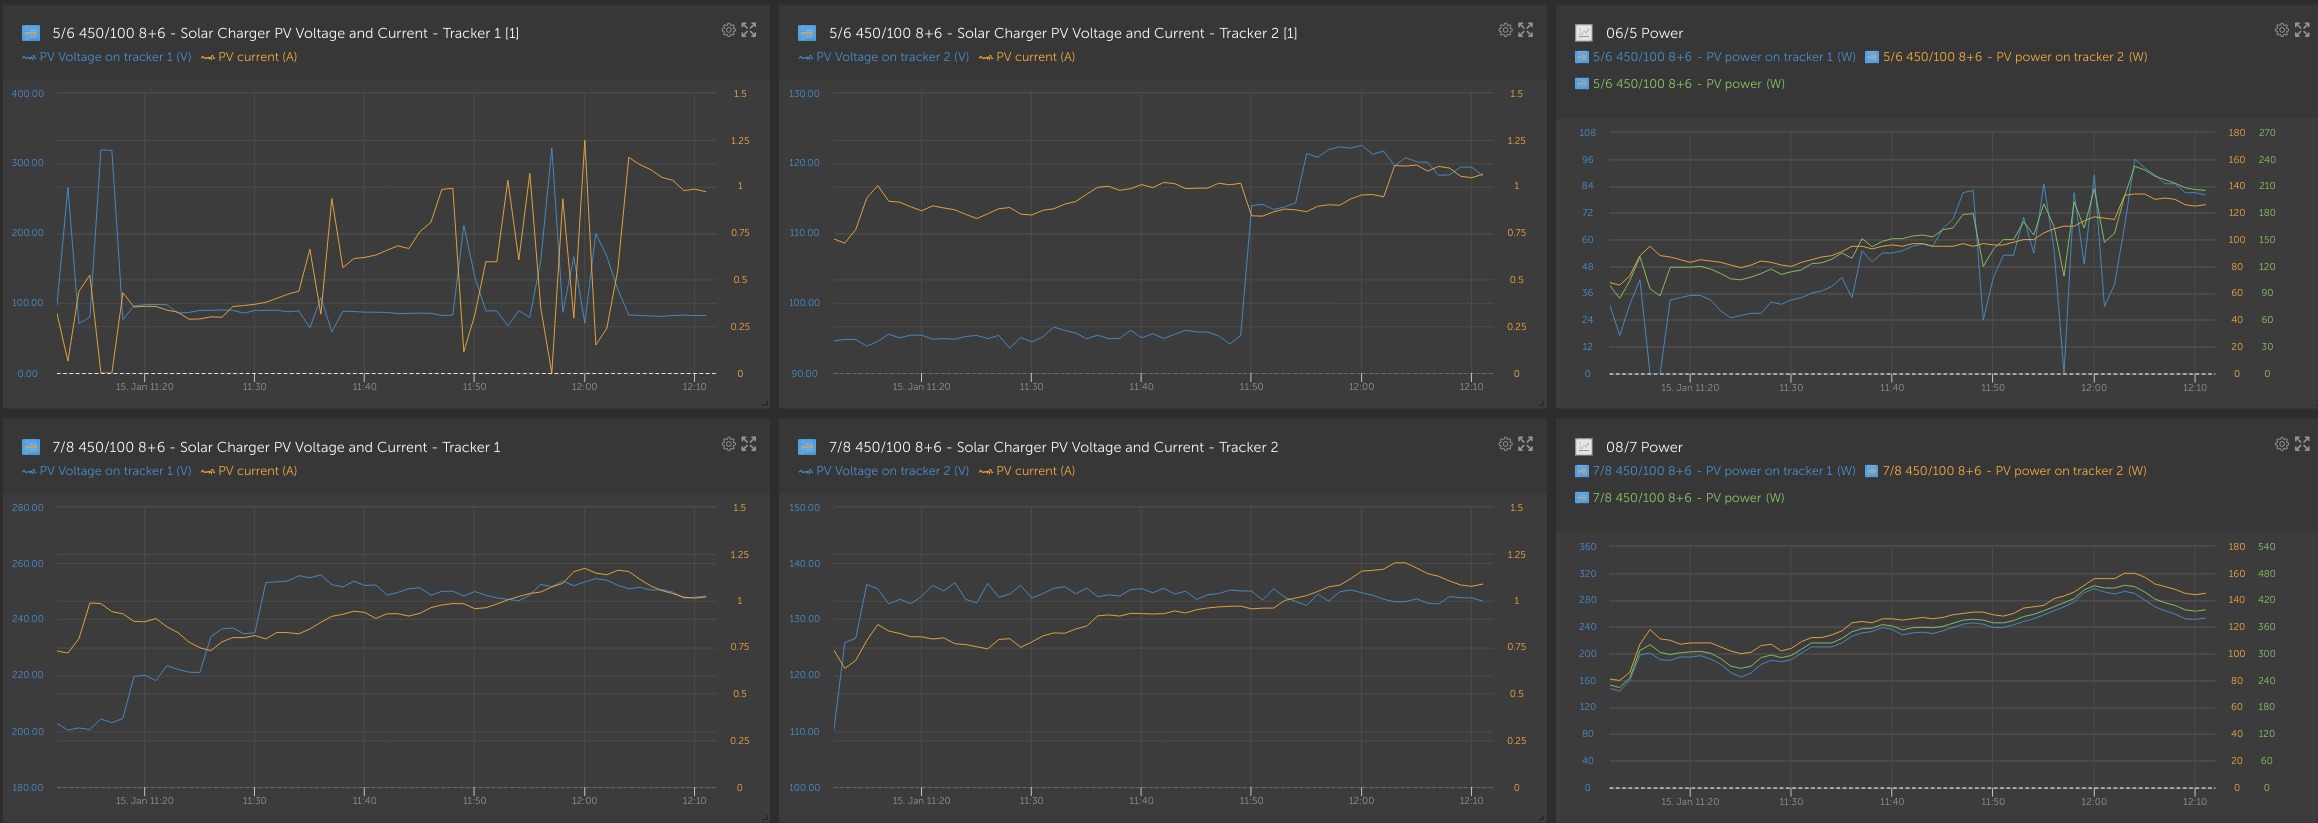
Feedback is much appreciated - also if it works OK in your system.

Firmware files:

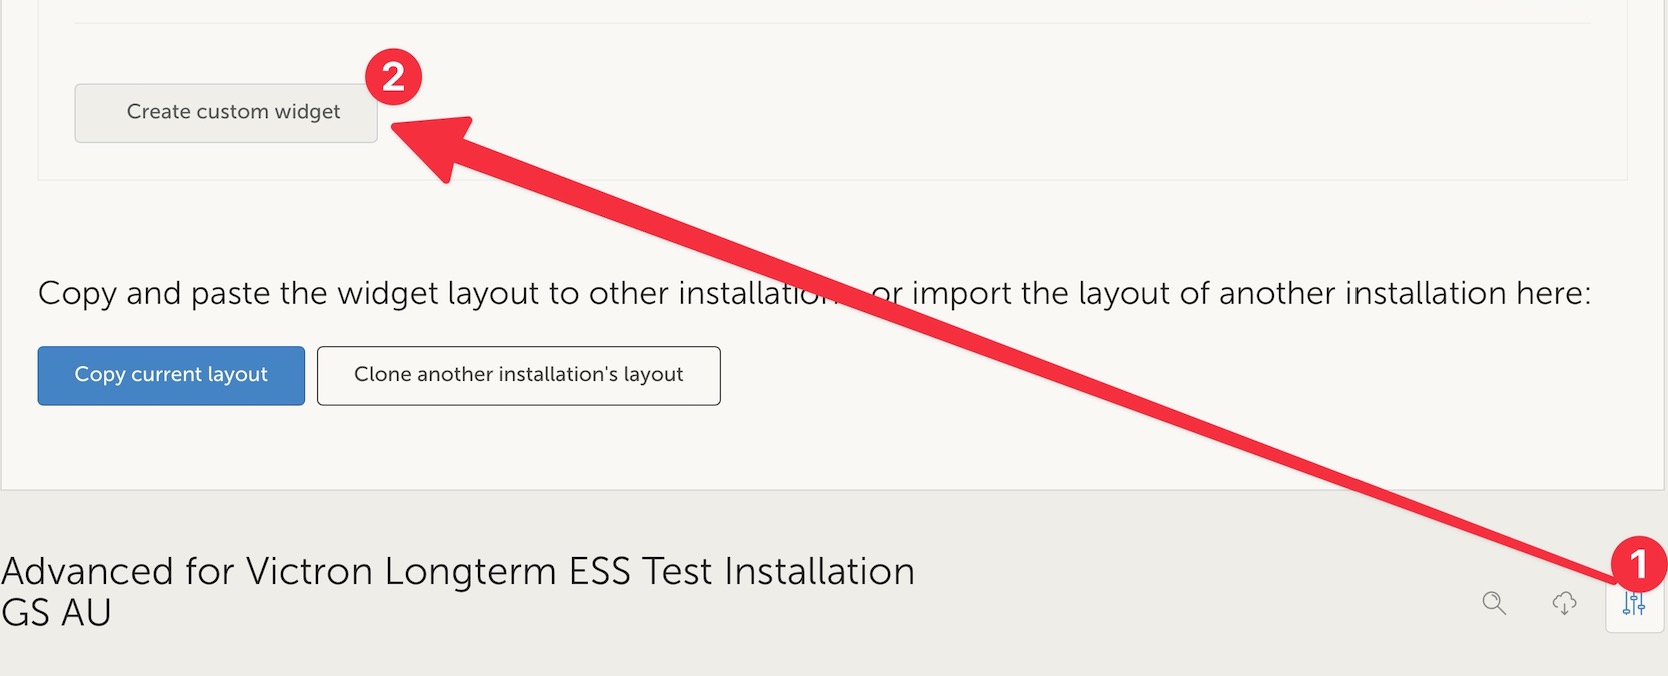
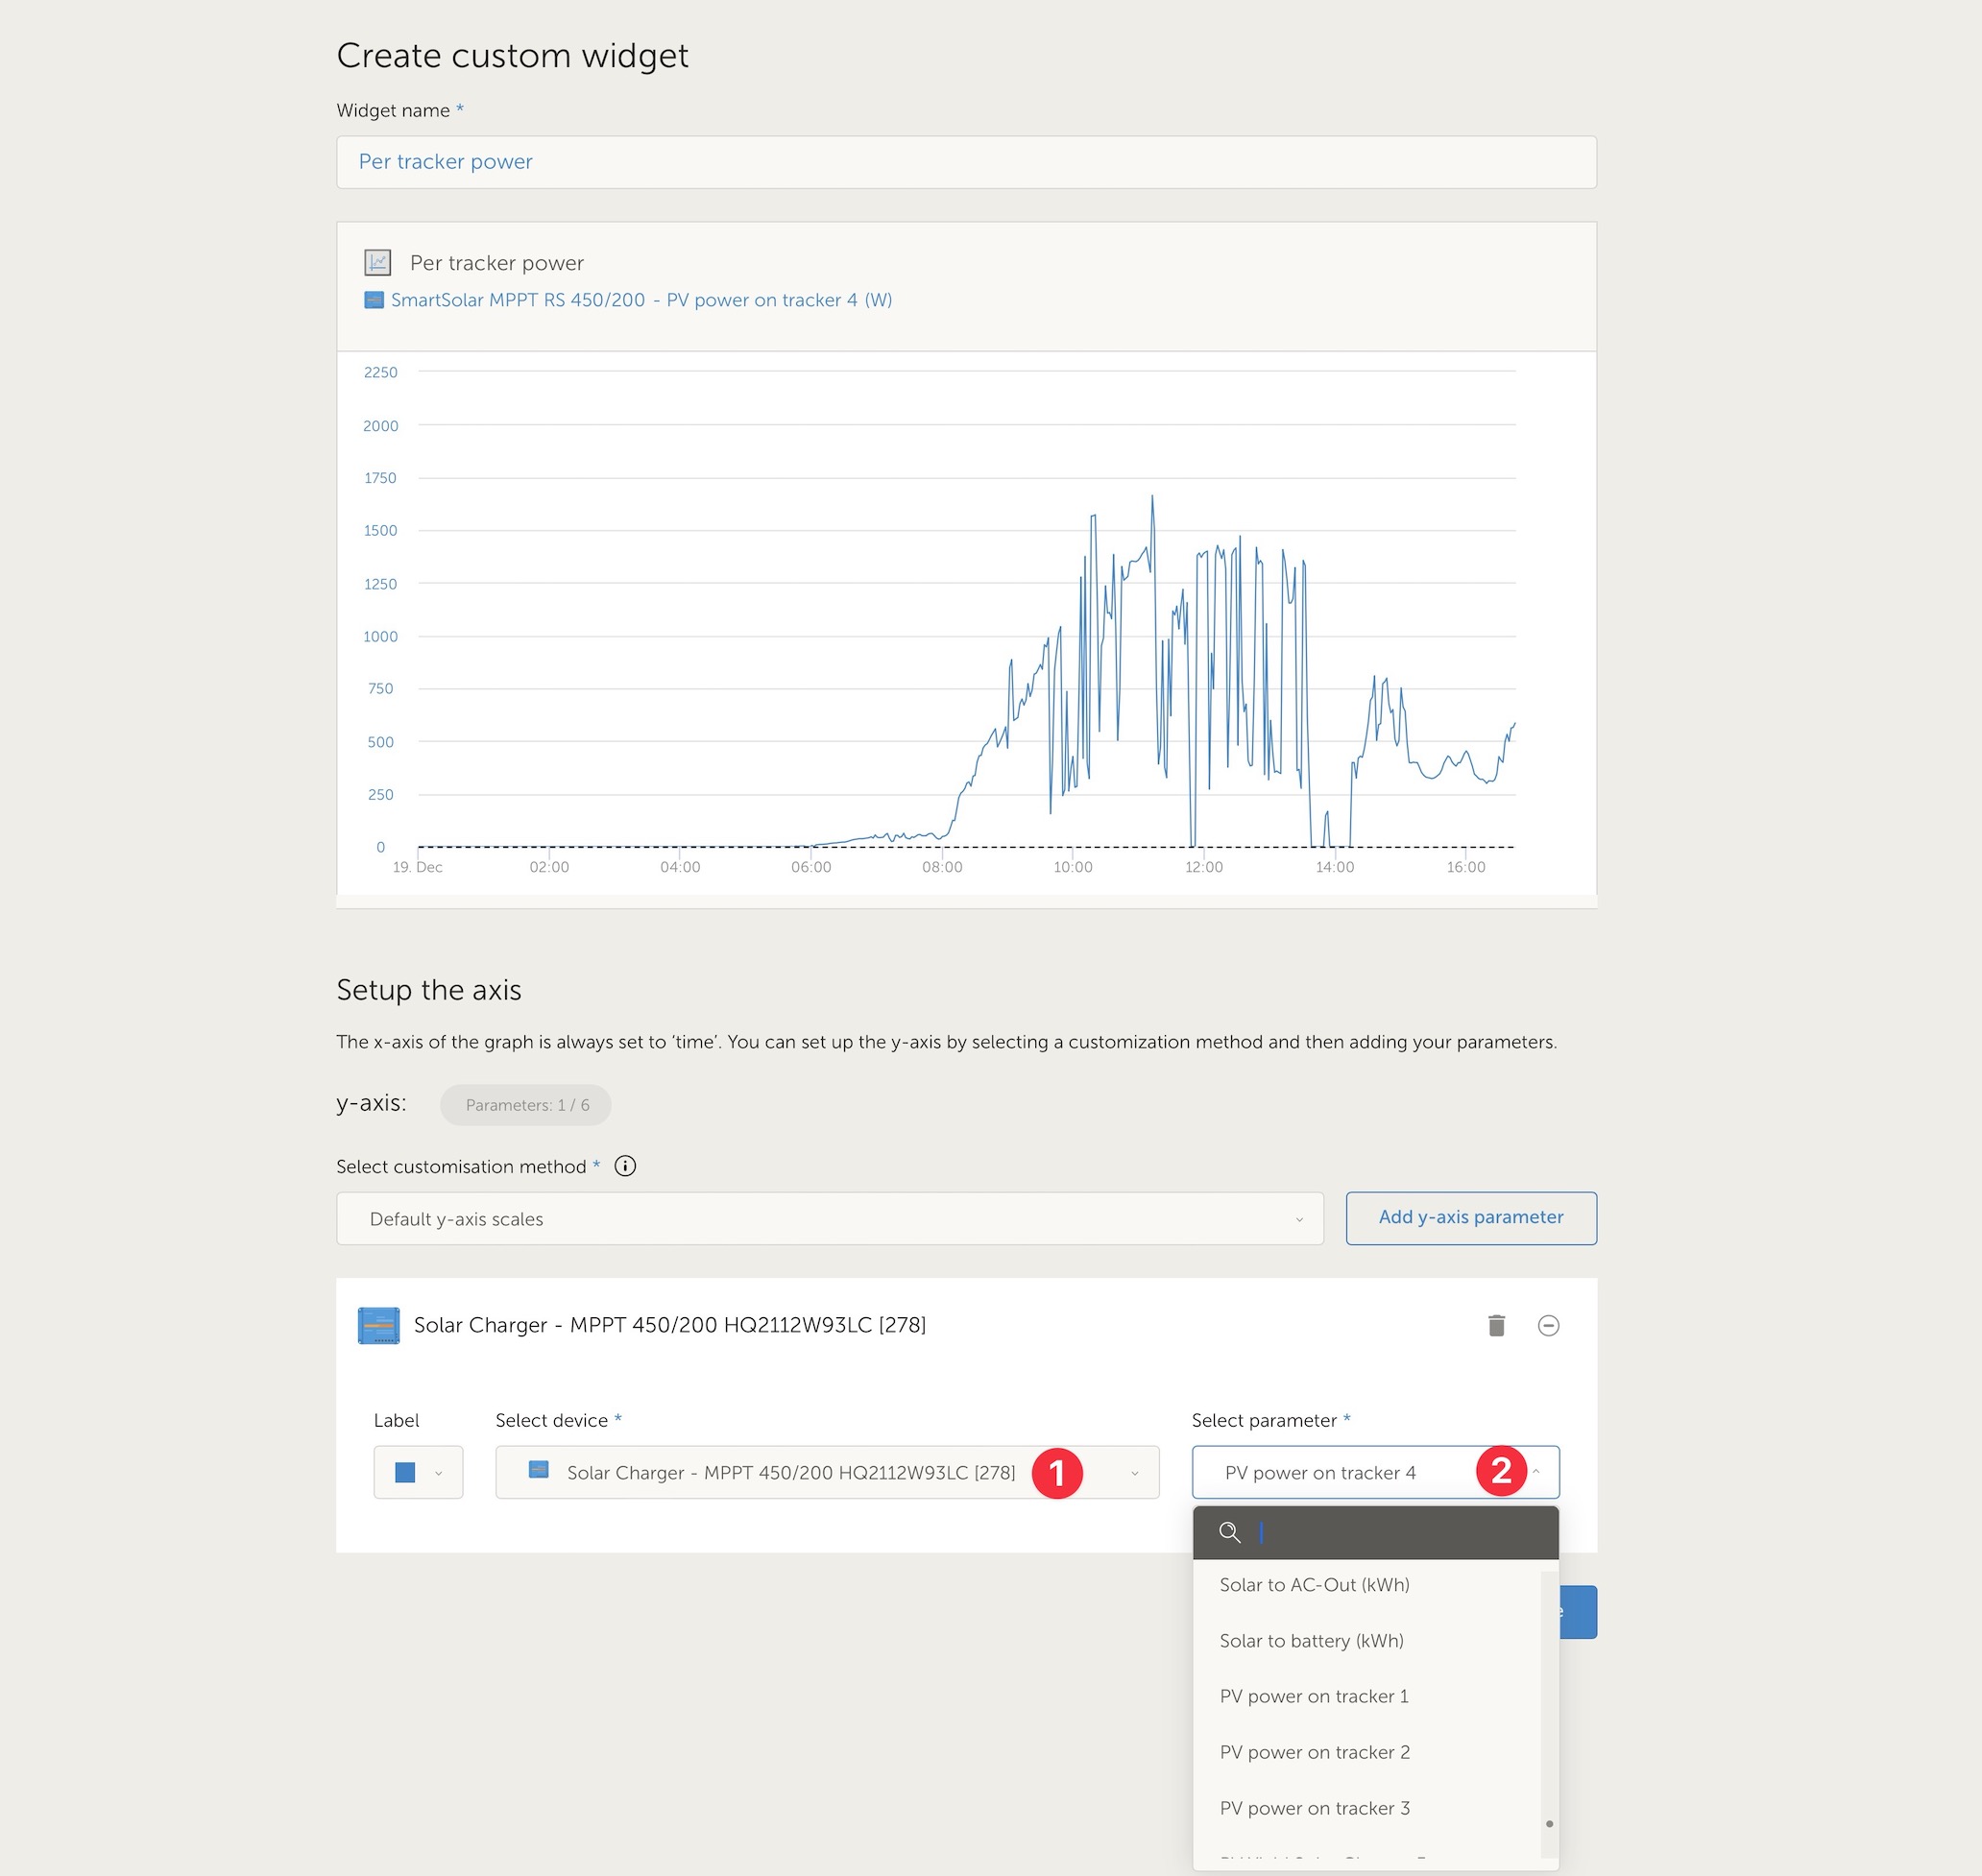
To install this beta version, either use VRM, and then click the little three-dotted icon on the right to see the option to upload a file yourself. Or, with VictronConnect, use the option described in chapter 9.2.


All the best and have a good weekend, Matthijs


Changelog

All models:

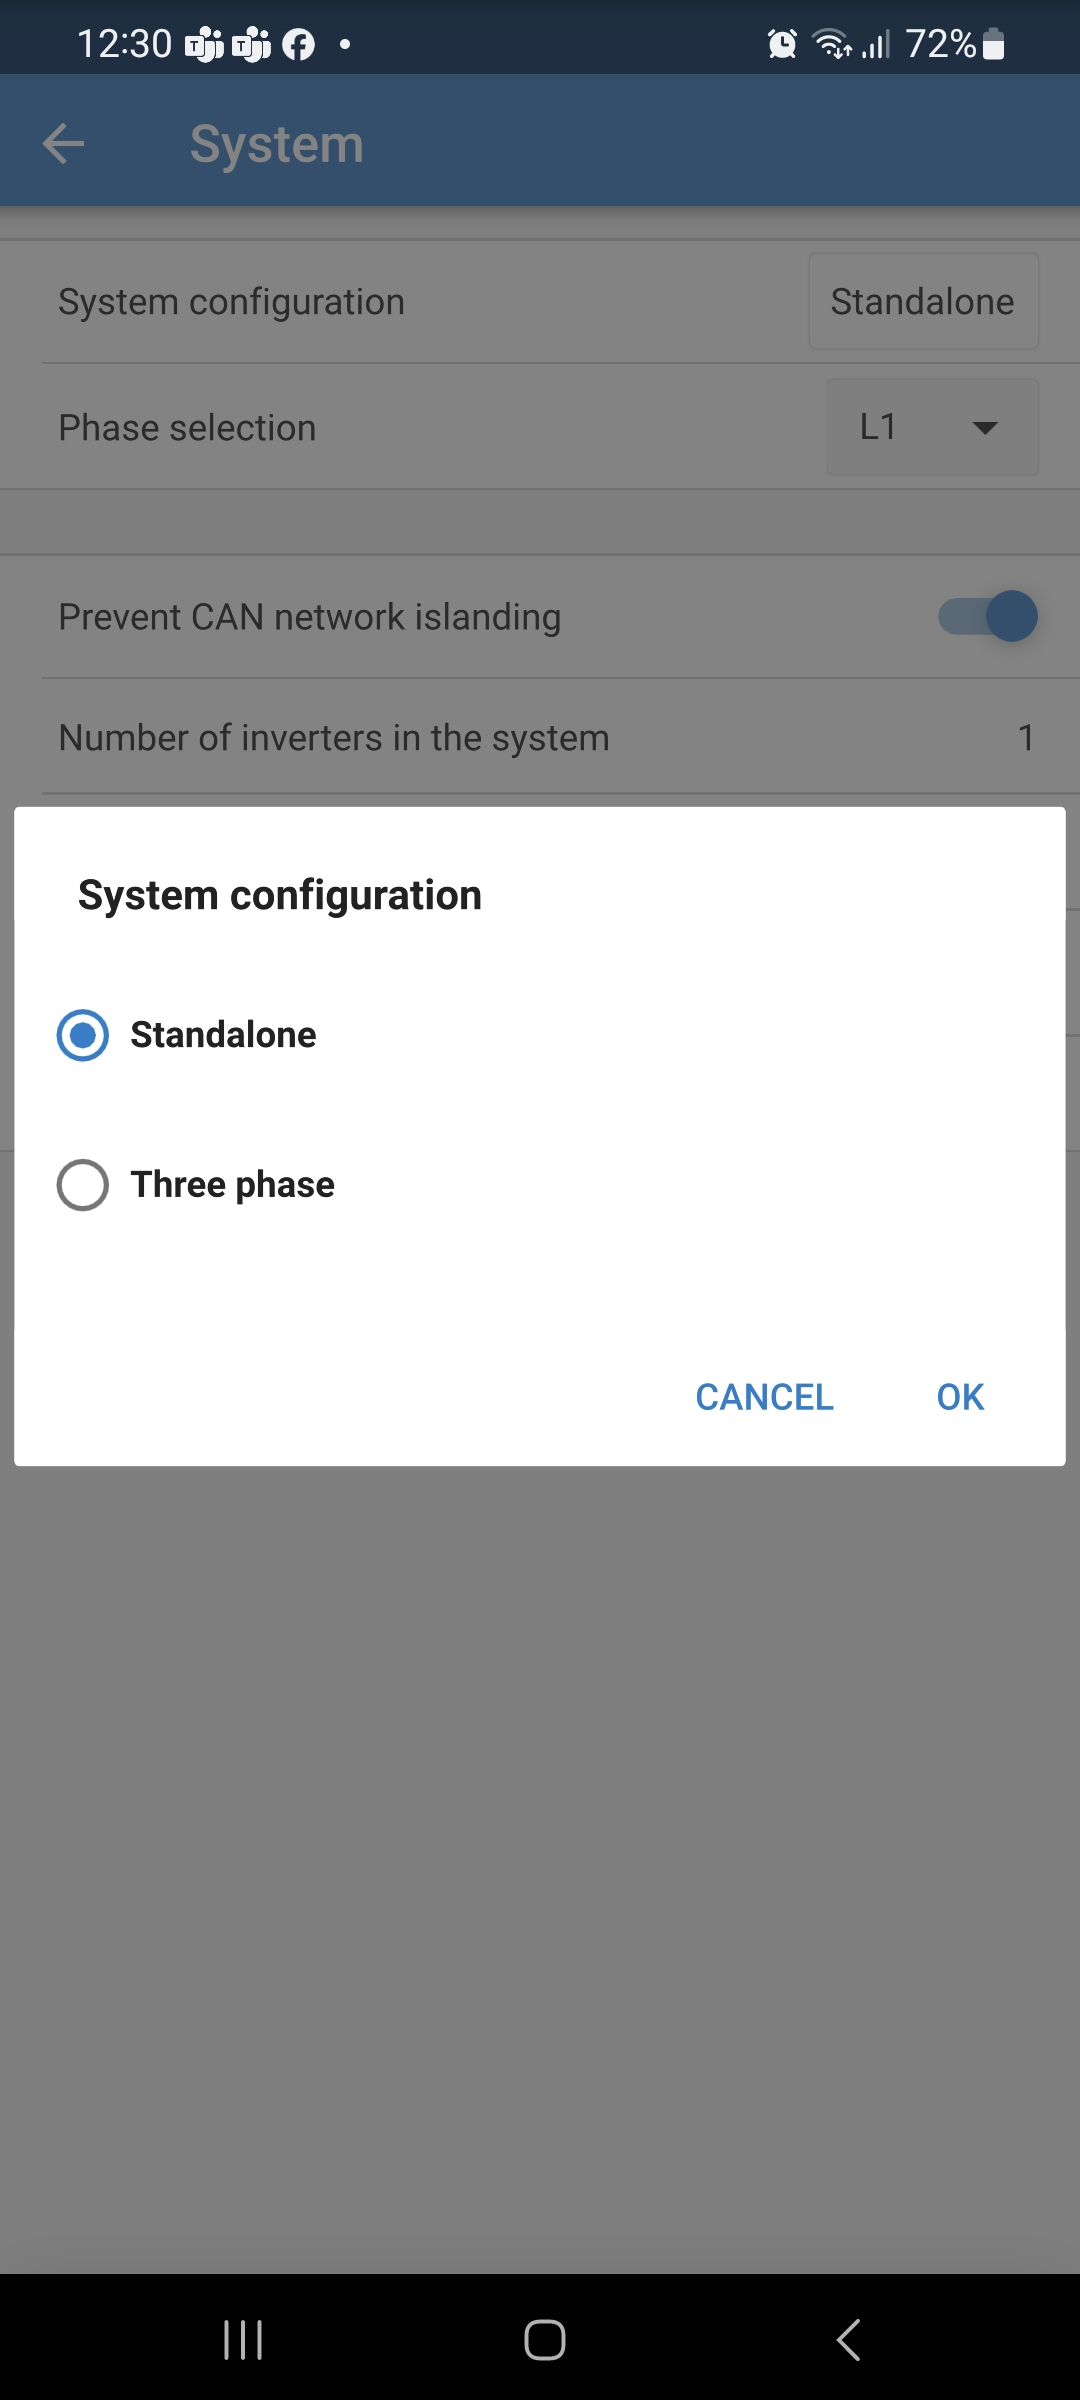
  • Add settings lock functionality.
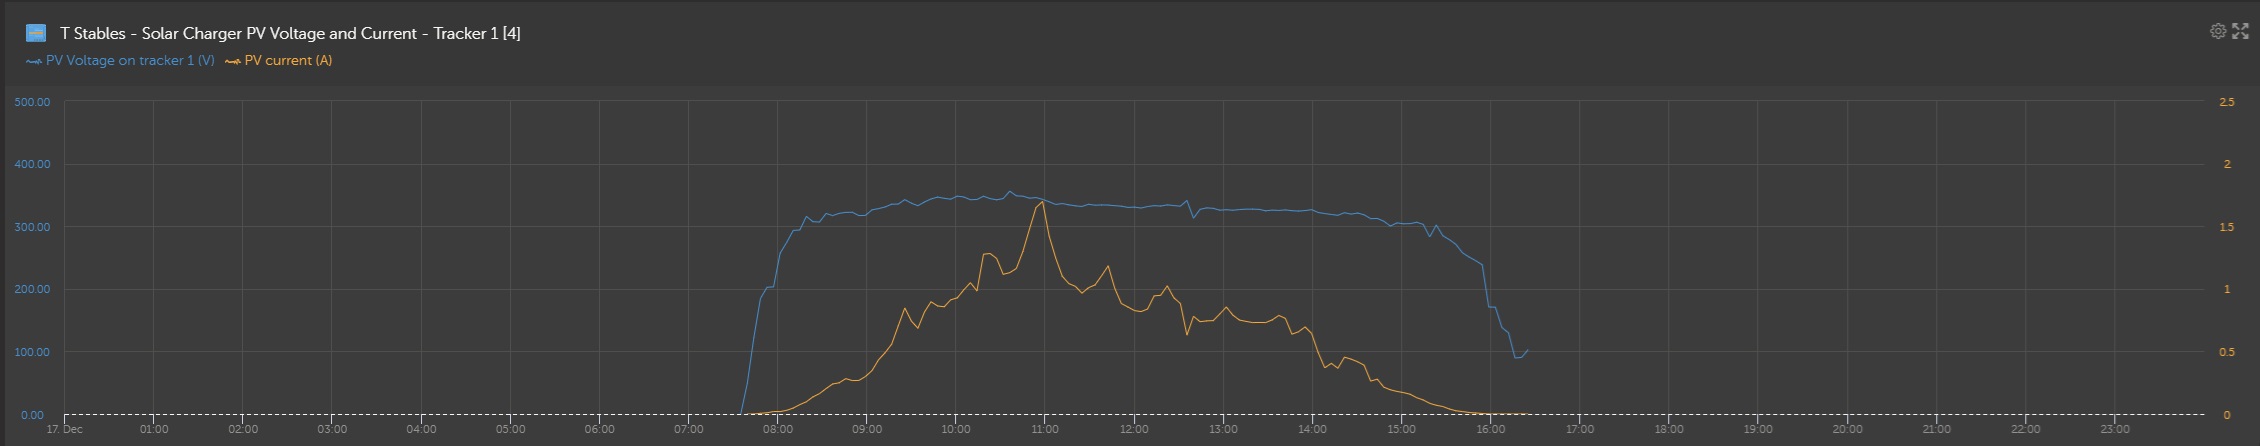
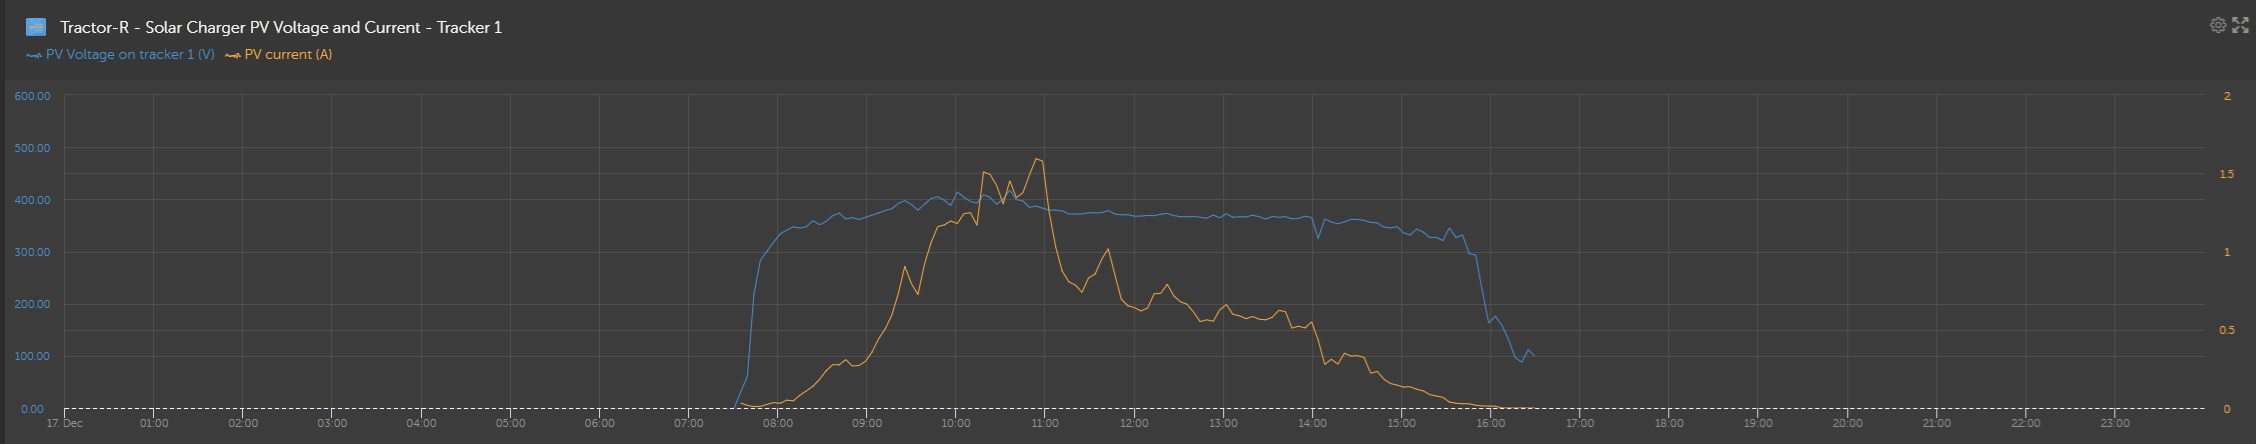
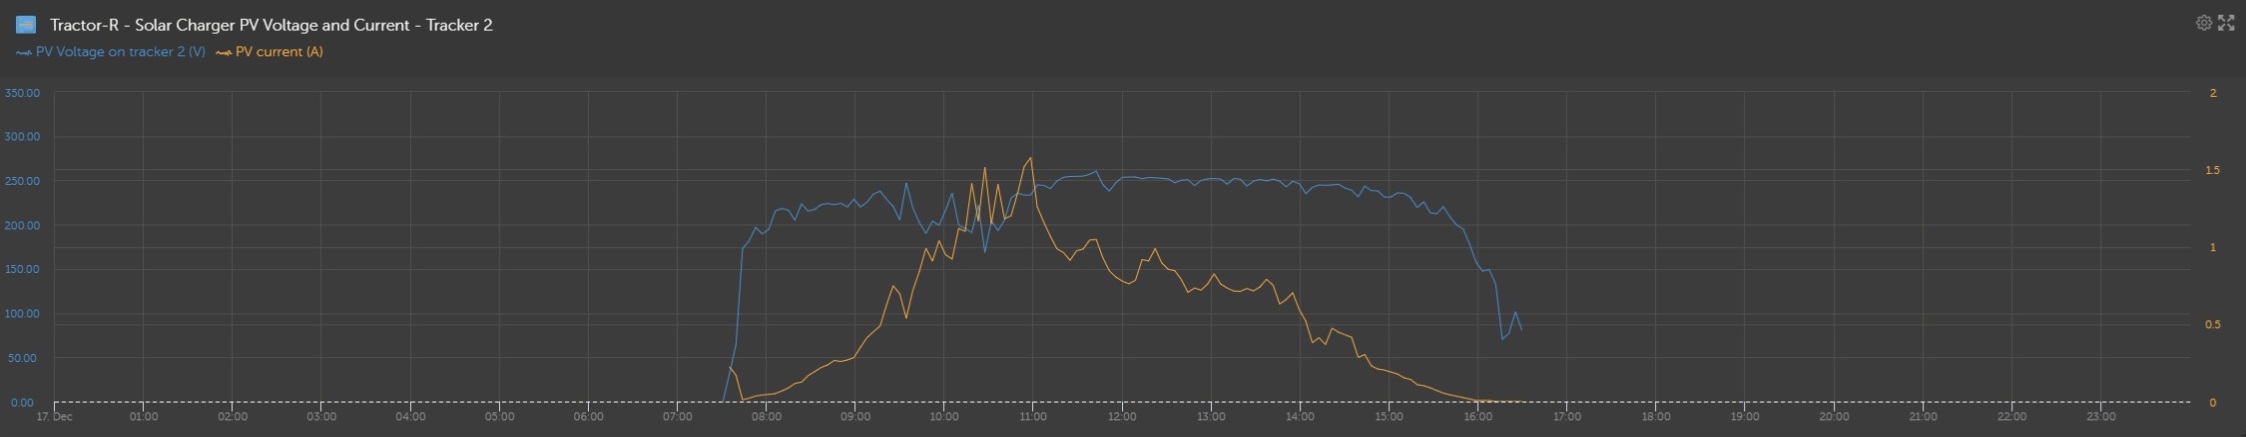
  • MPPT partial shading improvements; including a fixing |#34 excessive input current" error.
  • History logging and VRM reporting:
    • Fix min/max battery voltage history fields sometimes recording an impossible value.
    • Fix VRM energy counters in case the inverter is non-operational.


Multi RS:

  • Fix grid charge issue, the unit no longer connected to the grid when allow-to-discharge was inactive.
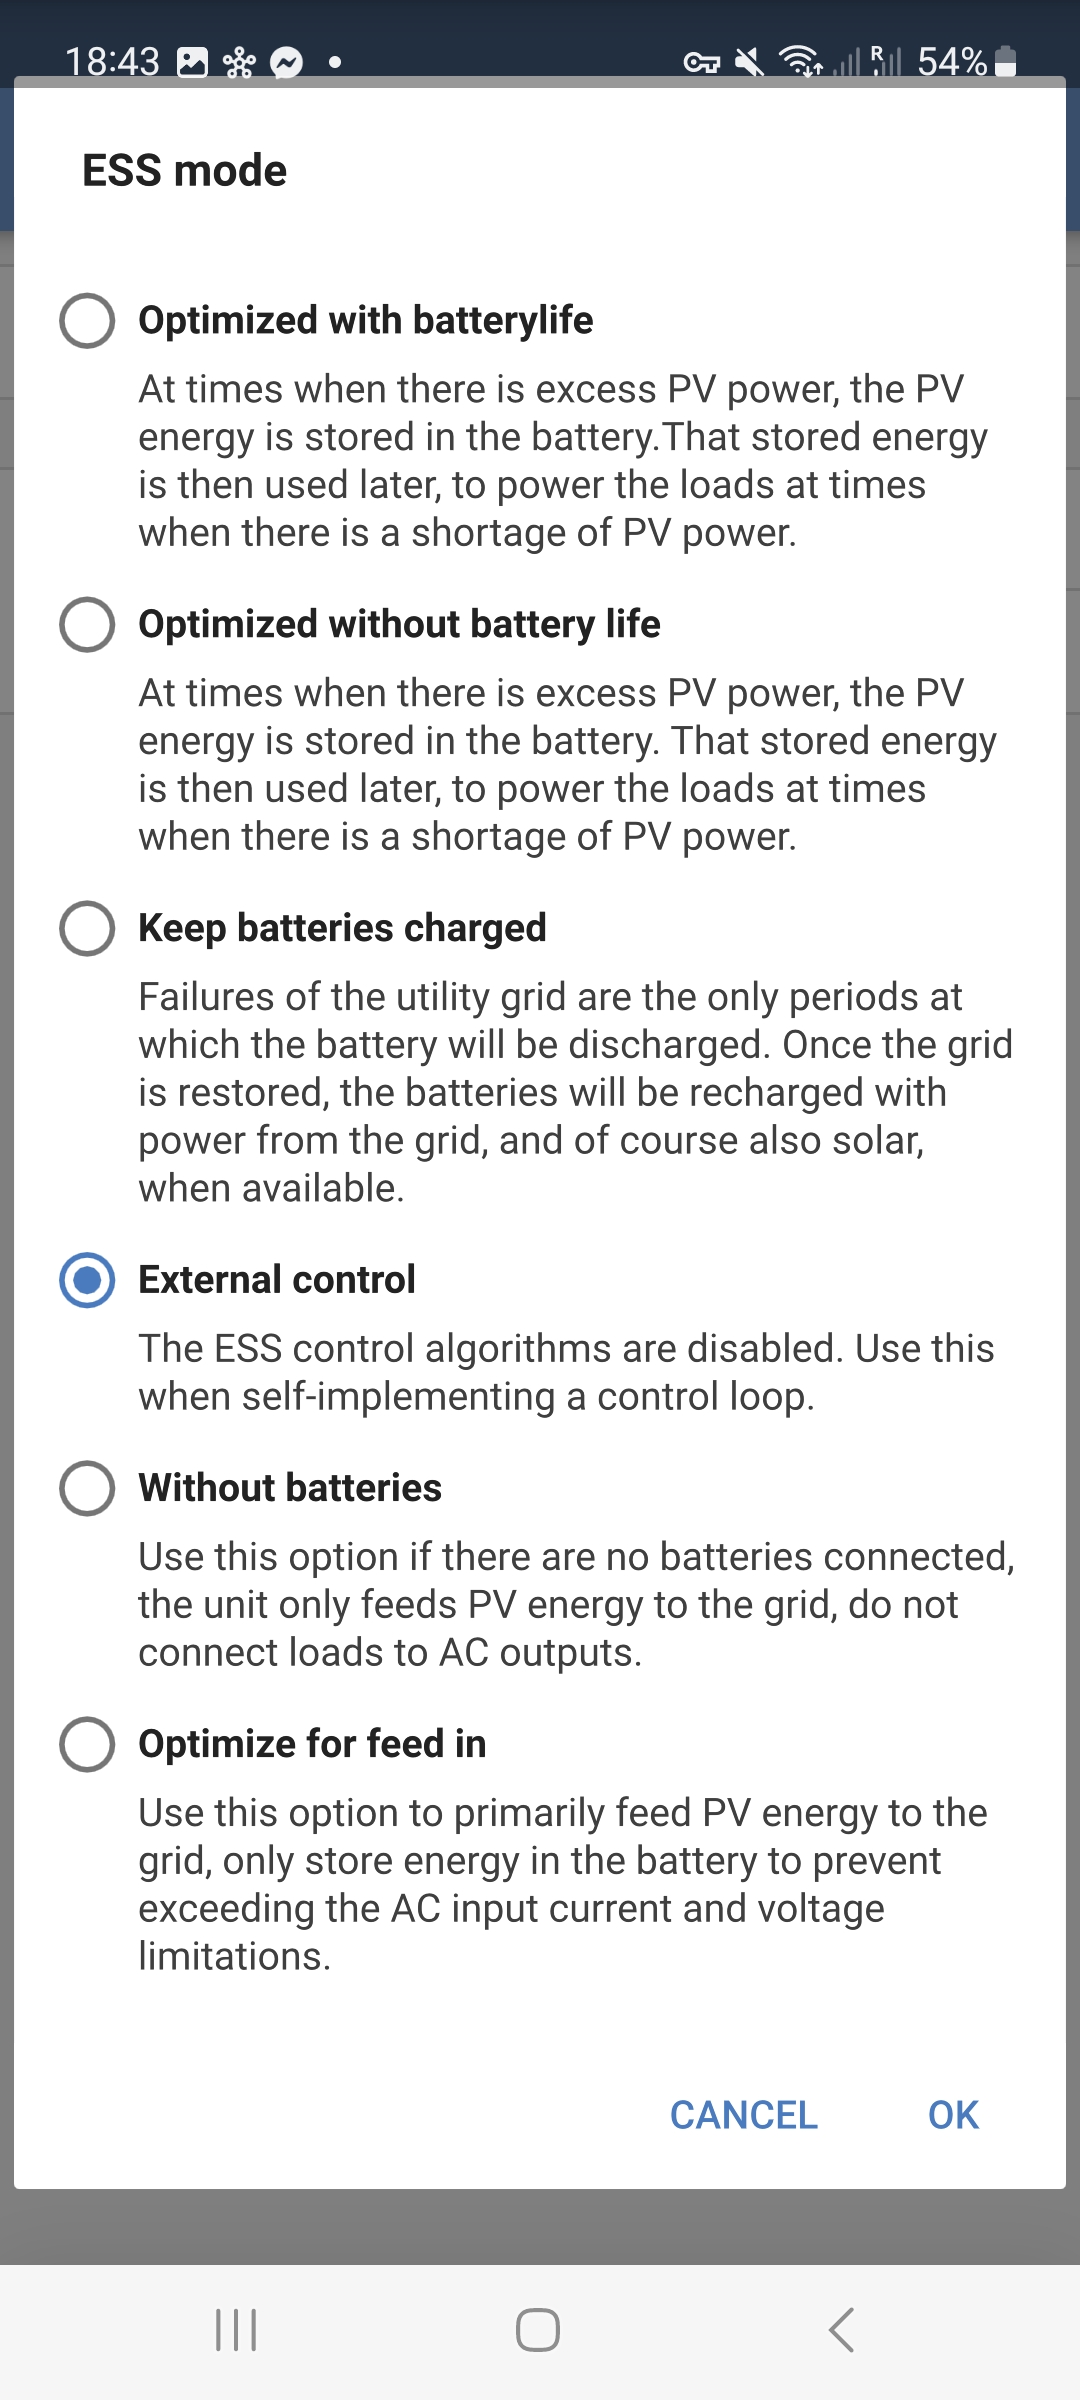
  • ESS option DisablePVInverters also stops the built-in MPPT charger.
  • Relay test: increase measurement settling time


VE.CAN Port:

  • Fix fast-packet transmissions (applies only to Inverter RS and Multi RS).


mppt rsMulti RSinverter rs
5 comments
2 |3000

Up to 8 attachments (including images) can be used with a maximum of 190.8 MiB each and 286.6 MiB total.

andrii-podanenko avatar image andrii-podanenko commented ·

Installed, will be monitoring tomorrow, and will provide a feedback

screenshot-20231217-165238-chrome.jpg

Thank you


0 Likes 0 ·
andrii-podanenko avatar image andrii-podanenko andrii-podanenko commented ·

First results from the morning. @mvader (Victron Energy)

Sunny day. Shades only on the south facade array from neighbor's home.

Station access is here

Reference data, from Dec 03

franik-vrm-portal-2023-12-03-10-59-54.png

franik-vrm-portal-2023-12-03-11-00-21.png


Today's data 1.16-beta2 firmware

2 Strings
8*580W 90-degree panels on the facade - south, total 4640W

8*580W 90-degree panels on the facade - west, total 4640W

franik-vrm-portal-2023-12-18-11-01-14.png


Inverter only data

franik-vrm-portal-2023-12-18-11-10-58.png


Reference data from the roof, no shading, 18-degree angle, not Victron, but Voltronic King 5000 inverter's MPPT, 5 strings, 10 panels, 460W, total 4600W array

franik-vrm-portal-2023-12-18-11-02-11.png


0 Likes 0 ·
andrii-podanenko avatar image andrii-podanenko andrii-podanenko commented ·
@mvader (Victron Energy) worth adding ability to monitor per tracker in VRM. Cause merged 2 trackers kinda skew a bit
0 Likes 0 ·
Guy Stewart (Victron Community Manager) avatar image Guy Stewart (Victron Community Manager) ♦♦ andrii-podanenko commented ·

Hi @Andrii Podanenko,

It is possible to monitor per tracker power in VRM, but as it is an advanced feature, it's a bit more work to enable.

You will need to use a custom widget;

cleanshot-2023-12-19-at-164816.jpg

And then add your RS, and scroll through the list of custom options to find the PV power on tracker #

cleanshot-2023-12-19-at-164920.jpg

2 Likes 2 ·
andrii-podanenko avatar image andrii-podanenko Guy Stewart (Victron Community Manager) ♦♦ commented ·

This is amazing, you made my day

This Custom Widget button should be in 24px bold font in the UI
Thank you so much, @Guy Stewart (Victron Community Manager)
1702981217677.png

1 Like 1 ·
1702981217677.png (778.3 KiB)
18 Answers
Alex Pescaru avatar image
Alex Pescaru answered ·

@mvader (Victron Energy)

Thank you very much for your efforts!

You are saying "Multi RS: Fix switching from inverter only to passthrough (only applies to units with feed-in enabled)."

But from what I am reading here on the community board, these units, Multi RS, don't have yet the feed-in capability enabled... Am I wrong?

And because the ESS on these units is not as versatile like on the other units, can be implemented an option like "Don't feed-in in any condition"?

Because some of us have interdiction to feed-in and are subjects of fines if the provider's smart meter detects feed-in.

10 comments
2 |3000

Up to 8 attachments (including images) can be used with a maximum of 190.8 MiB each and 286.6 MiB total.

mvader (Victron Energy) avatar image mvader (Victron Energy) ♦♦ commented ·
Hi @Alex Pescaru , good catch; I removed that line. Its not relevant to this beta test. We’re working internally on getting feed in and all related requirements.
2 Likes 2 ·
semlohnhoj avatar image semlohnhoj commented ·

There are some feed-in options in the firmware which seem to be disabled by default although they can be changed. Are these settings functional?

screenshot-20231217-113242.jpg

If you set Other on the grid options, then the following setting is available under ESS:

screenshot-20231217-113301.jpg

I've got my grid input disconnected during the day so I'm not worried about checking these but do they do anything if it is and if so, what?

Sorry, I know this is off topic.

1 Like 1 ·
mvader (Victron Energy) avatar image mvader (Victron Energy) ♦♦ semlohnhoj commented ·
No problem. They are part of the beta firmwares; but actually not intended to start public testing with. Not compliant or certified in any way yet.
2 Likes 2 ·
andrii-podanenko avatar image andrii-podanenko mvader (Victron Energy) ♦♦ commented ·
If possible to get more info about these, do not hesitate to send me extended changelog or beta docs link.

Thank you

0 Likes 0 ·
andrii-podanenko avatar image andrii-podanenko semlohnhoj commented ·

One more interesting screen, seems like there could be PV only mode

Amazing if such

screenshot-20231217-184339.jpg

0 Likes 0 ·
semlohnhoj avatar image semlohnhoj andrii-podanenko commented ·

I'm intrigued now. I don't have those extra options. Mine is the older single tracker version so I'm wondering if that is the difference. Is yours the dual tracker version?

If so, could you check under the system/system configuration section (as per below) and see if you have the option for 'parallel' as well as 'standalone' and 'three phase'?

Careful not to change the setting obviously!

screenshot-20231219-123012.jpg


0 Likes 0 ·
Guy Stewart (Victron Community Manager) avatar image Guy Stewart (Victron Community Manager) ♦♦ semlohnhoj commented ·

Hi Both,

If I can interject and ask that you please stay on topic here regarding the shading improvements, and not dig in deeply to the other beta features.

We didn't go out of our way to spend time disabling these other pre-release features that are outside of testing scope, but it really is only available in beta here so that we can get the shade improvements tested and released as soon as possible.

3 Likes 3 ·
semlohnhoj avatar image semlohnhoj Guy Stewart (Victron Community Manager) ♦♦ commented ·

Apologies, will open a new thread...

1 Like 1 ·
andrii-podanenko avatar image andrii-podanenko semlohnhoj commented ·
Yes, dual tracker on my end
0 Likes 0 ·
semlohnhoj avatar image semlohnhoj andrii-podanenko commented ·
Ok, does yours have the parallel option then?
0 Likes 0 ·
CM avatar image
CM answered ·

Installed , will give feedback if any issues from my end

2 |3000

Up to 8 attachments (including images) can be used with a maximum of 190.8 MiB each and 286.6 MiB total.

nesswill avatar image
nesswill answered ·
Thank you very much

Installed and looking good will feedback in due course.

1 comment
2 |3000

Up to 8 attachments (including images) can be used with a maximum of 190.8 MiB each and 286.6 MiB total.

nesswill avatar image nesswill commented ·

Not a too good day yesterday for sun/shade but as far as I can tell all worked as expected, TF1 angle/direction is optimised for early morning sun hence the difference compared to the other trackers.


s1.jpg

s2.jpg

tr1.jpg

tr2.jpg

tf1.jpg

tf2.jpg

EDIT:

Should of add this for some context...(out most of yesterday so power usage was low)

yesterday.jpg


0 Likes 0 ·
s1.jpg (97.9 KiB)
yesterday.jpg (69.6 KiB)
beat avatar image
beat answered ·

Today, instead of forecasted mostly sunny (and shady) day, we have a continuously and evenly covered (by stratus) day, so no shades, but very regular illumination. I thought I couldn't report anything back...until...

However, with 1.16-beta02 I saw some strange "global optimum selections, on both MPPT RS 450/100's on string 1:

First graph is string 1 U (voltage) +I (current) curve of first MPPT 450/100 unit. Graphs 2/3 are first string from second MPPT 450/100 unit (graph 2 U+I curves, graph 3 P (solar power)).

You see regularly the U drop to around minimum MPPT U (48V system) for a minute (VRM doesn't log more than a minute, and unit unfortunately doesn't log U/I/P curves for when connecting with Victron Connect), so, without the I going up most of the time, except 1 time, that one compensating entirely the U drop in the P, but the others decisions of MPPT algorithm to choose a low voltage without any gain in current seem rather strange.

Tracker 2 of both units doesn't have this behavior, but they are in the opposite direction and have less panels on them, so a lower Voc, which may explain that they act differently.

It would really help to have a log of the P/U graphs of the global-optimum sweeps and a few hours of logs of second-level U and I curves inside the RS units, or on the GX, to understand what happened and why the unit made the decision to lower the U workpoint, while the current didn't compensate for the power.

But this looks to me like a new MPPT bug in this beta 02, as I didn't notice this in the previous days with fog in the beta 01.

mppt-issues-covered-day-2023-12-17-15-04-50.png


2 |3000

Up to 8 attachments (including images) can be used with a maximum of 190.8 MiB each and 286.6 MiB total.

lee-taylor avatar image
lee-taylor answered ·

I am trying the 1.16 beta firmware to see if it will correct an issue that I have only recently noticed with my 450/100.

I have two strings of panels. One facing South East, the other South West. Both are 2.2KwP and until recently the output was similar on sunny days, but with the weather recently and the low sun its been difficult to tell if the issue is just the weather/time of year.


Or is related to the partial shading algorithm. I am finding one tracker drops to very low output the other seems unaffected.

Unfortunately it has also coincided with me rewiring a DC isolator so potentially the connection is at fault and I will need to do more testing.

However the tracker 1 with the low output has peaked at over 1kW for several minutes whilst the normally better performing side tracker 2 fell away, so it's a bit puzzling.

screenshot-2023-12-17-at-142136.jpg


2 |3000

Up to 8 attachments (including images) can be used with a maximum of 190.8 MiB each and 286.6 MiB total.

deonkorb avatar image
deonkorb answered ·

I upgraded to v1.16-beta-02 (from beta-01) and it caused a short circuit alarm (Error 27) on the MPPT. I could not clear the alarm at all (including all power removed for 5 minutes)

Downgrading to beta-01 cleared the error. I will try again tomorrow. For now I need the power

1 comment
2 |3000

Up to 8 attachments (including images) can be used with a maximum of 190.8 MiB each and 286.6 MiB total.

mvader (Victron Energy) avatar image mvader (Victron Energy) ♦♦ commented ·
Noted! It will be a while before there is a new beta: holiday season has started.
0 Likes 0 ·
teezee avatar image
teezee answered ·

Hi. Thank you very much! I just discovered the beta version, as I was concerned about the poor power output of my MPPT 450/100 RS. Partial shading occurs in the morning and afternoon, with small shadows passing over the upper string. I was surprised because these are 415W modules, yet four modules without shadow produced only 250W.

Initially, the update made a significant difference. I observed the current doubling immediately after installing the beta, but this change only occurred on tracker 2. Unfortunately, the logging system isn't fast enough to capture the impact. As far as I can tell, the behavior of tracker 1 hasn't changed at all.

Now, after a period without shadows, the previous behavior (at 14:19) returned, and it hasn't managed to reduce to a low voltage. I briefly observed the lowest voltage at 96V when only three modules were completely covered by the sun, which I assume is correct since my datasheet specifies Vmp as 31.45V per module. With about 3 1/2 modules covered by the sun, that should be around 94V. However, it consistently remains above 200V, whereas I believe it should be closer to 126V.

Consequently, I assume that the tracker is still not "searching deeply enough" for my lower string with four modules and for the eight modules when the lower four are shadowed.


1702907105726.png

v1.16-beta-02 is installed at 13:14.

1702908237405.png


1702907105726.png (644.6 KiB)
1702908237405.png (247.7 KiB)
2 |3000

Up to 8 attachments (including images) can be used with a maximum of 190.8 MiB each and 286.6 MiB total.

andrii-podanenko avatar image
andrii-podanenko answered ·

Good day

We have an almost sunny day, with light clouds today

Here is a graph, thanks to @Guy Stewart (Victron Community Manager) for the Advanced Widget suggestion

I've done overnight discharge of 30kWh to SOC 30% and now we have a clear "do full charge as you could" situation in my setup

South facade - 90 degrees - a shading situation from neighbor's house

The west facade - 90 degrees - kicks in when the sun comes to direct light afternoon

My concerns are - flat horizontal bars, while King PV on a roof plays with MPPT, Victron stays on a steady level. Could be no clouds between the sun and the array, but for me it looks like Victron mppt is lazy in looking for a better power point or I could be just speculating here @mvader (Victron Energy) - Something wrong with VRM - it shows horisontal bars, while PV power is getting changed @Guy Stewart (Victron Community Manager)

1702992408147.png

Link to my setup https://betavrm.victronenergy.com/installation/370388/share/c0152a83

Report from yesterday https://community.victronenergy.com/comments/249721/view.html


1702981617474.png


1702982127062.png

1702982147027.png


1702981617474.png (141.8 KiB)
1702982127062.png (1.4 MiB)
1702982147027.png (1.9 MiB)
1702992408147.png (39.1 KiB)
3 comments
2 |3000

Up to 8 attachments (including images) can be used with a maximum of 190.8 MiB each and 286.6 MiB total.

andrii-podanenko avatar image andrii-podanenko commented ·
What would be cool if you could provide some basic recommendations for this release and what to look at in Graphs @mvader (Victron Energy)
0 Likes 0 ·
Guy Stewart (Victron Community Manager) avatar image Guy Stewart (Victron Community Manager) ♦♦ andrii-podanenko commented ·
Check your custom widget selections, you’re using the ‘maximum’ power for the day option, not the actual power for each moment. You will need to change the selection. That is why the bars are horizontal.
2 Likes 2 ·
andrii-podanenko avatar image andrii-podanenko Guy Stewart (Victron Community Manager) ♦♦ commented ·

Sorry, my bad. Will provide my correct feedback later

0 Likes 0 ·
Alex Pescaru avatar image
Alex Pescaru answered ·

Hi @mvader (Victron Energy) ,

Please help me with a way of reasoning..

In order for the MPPT to be precisely tested, you must draw a little more power above the maximum the tracker can give at a moment.

Of course the surplus needed will be compensated by the battery or grid, but you must draw above the tracker's limit, in order to see if the tracker is correctly following the maximum power point.

Why I am thinking this way?

Because, I believe, otherwise there can be a limitation imposed by the fact that the MPPT will limit the power generated, because that power doesn't have where to go, especially that now in the Multi RS case is not enabled to feed in. And the user has the impression that the MPPT doesn't generate the power as expected.

Am I talking nonsense?

Please go easy on me, I am a noob in this area...

1 comment
2 |3000

Up to 8 attachments (including images) can be used with a maximum of 190.8 MiB each and 286.6 MiB total.

beat avatar image beat commented ·

Hi @Alex Pescaru My tests results shown here are always done without limitations, with plenty of battery capacity and charging current availability (MPPT trackers in mode 2 (MPPT, not limited)).


0 Likes 0 ·
beat avatar image
beat answered ·

I saw on VRM that yesterday (with 1.16 beta 02, and batteries with plenty of charging current reserve so that no tracker would have to limit its current) that one of the trackers of one of the 2 RS 450/100 was doing regularly strange drops in current and power, while others were not doing this, here the I&V and P curves of both RS 450/100s.

Both trackers 1 are low-angle South-West orientation, trackers 2 are low-angle slightly East-North.

mppt-issues-medium-covered-day-2023-12-26-vrm.png

Could that be a bad sampling timing of VRM data during swipes ? As mimimum interval for VRM being 1 minute, if that's the case, it would make sense to not send samples when scaning. On the other hand, I would expect at least power to be averaged over the sampling interval (1 minute in this case).


Second graph below shows on same South-West pane, in same interval, 3 trackers, the one in white is 2 panels on a Smart MPPT 100/20, while trackers 1 of RS 450/100 are 8 panels. The regular drops of one of the RS 450/100 tracker 1 are clearly visible, while the other trackers don't drop, so it's not a sunshine issue.

mppt-issues-medium-covered-day-south-details-2023.png

A notable thing that can be seen on this graph is that while 8 panels on 450/100 (especially on the orange tracker that is at same height than the white 100/20) should give 4 times the power of 2 panels on MPPT 100/20, they give around 3.5 times the power (around 13% less), when not dropping regularly. So it looks like there is still room for improvement in real conditions.


2 |3000

Up to 8 attachments (including images) can be used with a maximum of 190.8 MiB each and 286.6 MiB total.

andrii-podanenko avatar image
andrii-podanenko answered ·

I've installed beta2 8 days ago, see my comment https://community.victronenergy.com/comments/251040/view.html


Dips I saw on old firmware from my Multi RS 6000 Dual tracker


1703598967898.png

1703599021867.png

Now they are seems like gone

Today we had a complex day, a lot of clouds/sun, can't complain

1703599168912.png

@mvader (Victron Energy) @Guy Stewart (Victron Community Manager)

Link to my setup where you can check results by yourself in Advanced graphs - https://betavrm.victronenergy.com/installation/370388/share/c0152a83


Thank you


1703598967898.png (375.5 KiB)
1703599021867.png (353.8 KiB)
1703599168912.png (467.4 KiB)
2 |3000

Up to 8 attachments (including images) can be used with a maximum of 190.8 MiB each and 286.6 MiB total.

Alex Pescaru avatar image
Alex Pescaru answered ·

Hi @mvader (Victron Energy) and @Guy Stewart (Victron Community Manager)

Firmware changed today...

A strange, or maybe normal, behavior as soon as the firmware was changed.

The first tracker, like in the case of @beat begin to manifest a saw-tooth behavior in power generation at 5 minutes interval.

See on the graph below, before (no saw-tooth) and after flashing (saw-tooth present).

As the sending data interval on VRM is set to 1 minute, I've watched closely the Remote Console for a second to second basis read-out.

Indeed, at 5 minutes intervals, it seems that the tracker is doing a full sweep, sweep that don't last more than 5 seconds, with a full voltage/current excursion. Then it seems to settle on the max found.

But on VRM, even if the drop is around 5 seconds, it is graphed like it was down for 1 minute. Probably the send data is somewhat synchronous with that power track/sweep and VRM records some of the low values during sweep.

Is this the intended behavior?

Probably if you move the send data to a different offset during time, it will not appear so obvious on the graph...

Thank you!

change.jpg


change.jpg (149.4 KiB)
5 comments
2 |3000

Up to 8 attachments (including images) can be used with a maximum of 190.8 MiB each and 286.6 MiB total.

Alex Pescaru avatar image Alex Pescaru commented ·
1 Like 1 ·
change2.jpg (170.5 KiB)
beat avatar image beat Alex Pescaru commented ·

Thank you for your update @Alex Pescaru , interresting observations and good idea to upgrade during daytime!

But I doubt that it is only a "sampling coincidence" (see below).

I also see another correlation between your graphs and mine: At some power levels, these spikes appear and at other (often higher) power levels they stop appearing.

I can imagine that voltage and current are not be averaged for the 1 minute interval before being transmitted to VRM, but that doesn't make sense and would imho be a bug, since there is also an advanced setting in VRM to display minimal and maximal values in the graph. This works well for battery SOC, but doesn't for MPPT values. Maybe a second bug that sampling /transmission to miss min/max transmission ? @mvader (Victron Energy)

But for power, it definitively makes full sense to average power during the timeframe, as the resulting averaged power display also represents energy during the sampling interval, while non-averaged power doesn't represent anything else than power at the sampling instant, which is nonsense with varying power levels like sunshine. So I would be surprised that it is not averaged, and if it's the case, this would definitively be a bug imho.

0 Likes 0 ·
Alex Pescaru avatar image Alex Pescaru beat commented ·

Hi @beat , @mvader (Victron Energy) , @Guy Stewart (Victron Community Manager)


Today I've changed back to 1.15 because it was a sunny day and I wanted to be sure about some things.

Besides the toothed V curve, mostly because I wanted to see if another annoying manifestation present in 1.16 is present on 1.15 too.

Link this new behavior here: https://community.victronenergy.com/questions/252435/multi-rs-acdc-fan-turning-randomly-on-full-thro.html

The result of going back to 1.15 below.

Is it possible that those of us who don't have (partial) shadows during the day over the panels to see a marginal (almost zero) improvement over the harvested power?

Thanks!

1-15.jpg

0 Likes 0 ·
1-15.jpg (154.3 KiB)
Alex Pescaru avatar image Alex Pescaru Alex Pescaru commented ·

Changing back to 1.15 solved both above problems: no more toothed V curve, no more fan on full throttle when not needed.

0 Likes 0 ·
Alex Pescaru avatar image Alex Pescaru Alex Pescaru commented ·

Hi @Guy Stewart (Victron Community Manager) , @mvader (Victron Energy), @beat


Reflashed the 1.16 beta-2 because I've observed some non optimal harvest of solar power after a small portion of the solar panels began to be shaded by a construction.

Now I am convinced that the improvement in solar harvest is major on 1.16 beta-2.

See attached picture where I've tried to emphasize the missing solar power below an hypothetical, non shadowed curve. You can clearly see the behavior of the trackers and their harvested energy which is quite odd.

After the reflash point, the trackers tried to get every ounce of solar power. Good job!

If the fans issue can be solved in this 1.16beta2, this will be my firmware, because that toothed graph I am now convinced that it's only a sampling matter, not a real problem.

Many thanks for your efforts!!

shadows2.jpg


0 Likes 0 ·
shadows2.jpg (49.5 KiB)
h2009 avatar image
h2009 answered ·

I've noticed some strange actions from panels on my RS450/100's.

Look at these charts and the red line. No shading affecting these panels (all roughly the same location). It should mimic the blue line as the panels are just in front of each other.


Also on the start of each day, the red tracker always shows this 'higher gain' than all other strings. This is the same every day,


screenshot-2024-01-06-at-215724.pngscreenshot-2024-01-06-at-215700.png


screenshot-2024-01-06-at-215652.png

screenshot-2024-01-06-at-220420.pngscreenshot-2024-01-06-at-220429.pngscreenshot-2024-01-06-at-220436.png


2 |3000

Up to 8 attachments (including images) can be used with a maximum of 190.8 MiB each and 286.6 MiB total.

CM avatar image
CM answered ·

I still think tracker 2 response time is poor , even with very minimal shading it stays on lower power for 1-2 hours more , during which if you reinstall or reboot the mppt, max power can be extracted from tracker 2 . I think time for seeking if shading is gone needs to be reduced further or a button for rescan should be introduced , problem solved


img-8942.png


img-8942.png (212.3 KiB)
2 |3000

Up to 8 attachments (including images) can be used with a maximum of 190.8 MiB each and 286.6 MiB total.

teezee avatar image
teezee answered ·

Hi. There were a few sunny days here and I like to update you about the performance of the bottom string at tracker 1 (see my pictures above).
The bottom string have most of the time at least two modules fully illuminated but the current stays low at around 25W. I guess it could produce 700-1000W with the partial string. I believe that the current of the lower string should be nearly the same as the upper string, while the voltage should drop. But the voltage stays high and the current drops. There are moments, where it seems fine.

I like to provide you with the information you need. Please tell me if I can do more to improve it :-)

1704918699709.png


1704918699709.png (116.6 KiB)
2 |3000

Up to 8 attachments (including images) can be used with a maximum of 190.8 MiB each and 286.6 MiB total.

Alex Pescaru avatar image
Alex Pescaru answered ·

Hi developers,

@Guy Stewart (Victron Community Manager) , @mvader (Victron Energy)

I've saw, at least monitoring my Multi RS Solar, that the (re)tracking process is done at 5 minutes (300 seconds) with an offset of 2.5 minutes (150 seconds) between Tracker1 and Tracker 2.

I mean something like: .... - retrack1 - 150s - retrack2 - 150s - retrack1 - 150s - retrack2 - 150s - ......

In order to get out of that sync with the VRM send data that generates that saw-tooth pattern sometime, can I respectfully suggest to choose the (re)tracking interval with a little bit of random?

Something like: retracking_seconds = 290 + random(20)

In that way the (re)tracking interval will be between 290 and 310 seconds, with an average on 300.

But for sure will be (out of sync) most of the time with the VRM send data.

Thanks for listening and again, no offense, it's just a suggestion...

Alex

1 comment
2 |3000

Up to 8 attachments (including images) can be used with a maximum of 190.8 MiB each and 286.6 MiB total.

beat avatar image beat commented ·
IF this is causing the saws issue, which is still to be confirmed by Victron, a different approach for sending to VRM could be to send the average of the last interval instead of the instant value. For Power it makes sense for sure, as then the average power over the period is the harnessed energy. And for voltage and current, easiest and most correct would be to send the average of for the last period of operating values, or the last operating value (before the swipe started).


btw I'm unable to give any feedbacks these days, snow sticking on panels up there, 0W production and all these weeks, no sun. :-(


2 Likes 2 ·
beat avatar image
beat answered ·

Maybe I found a bug in the new v1.16 beta 2 algorithm:

When the optimum is just above Vmin, it works fine, but when the optimum is (just) below Vmin (48V system) the MPPT goes to Voc instead of staying at Vmin, which ruins the power output: That was the case at MPPT2 of both RS450/100 this morning as snow is melting, uncovering partly the panels:

In following graph: One line per MPPT:

mppt-issues-part-snow-cover-2024-01-15.png


2 comments
2 |3000

Up to 8 attachments (including images) can be used with a maximum of 190.8 MiB each and 286.6 MiB total.

beat avatar image beat commented ·

And now that pannels of trackers 2 are starting to get less snow, tracker 1 of first MPPT RS 450/100 being new Vmin starts doing oscillations too, so the issue is not tracker-dependent, just instable around Vmin:

mppt-issues-part-snow-cover-2024-01-15-2.png


1 Like 1 ·

Hi @beat,

There has just been a new beta4 release that makes a change around Vmin scanning.

Please update and see if that resolves it.

https://community.victronenergy.com/questions/255304/rs-shade-performance-testing-v116-beta-04.html

0 Likes 0 ·
lee-taylor avatar image
lee-taylor answered ·

Unbroken sunshine today and power is fluctuating up and down continually on one string whilst the other outputs the expected power. There is no rhyme or reason to it. If I could find version 1.14 I would go back to that as this is frankly unacceptable.

1 comment
2 |3000

Up to 8 attachments (including images) can be used with a maximum of 190.8 MiB each and 286.6 MiB total.

Hi @Lee Taylor, and everyone else,

Please try updating to beta 4 available here - https://community.victronenergy.com/questions/255304/rs-shade-performance-testing-v116-beta-04.html

If you're still having issues with that beta, please post in that thread. Beta2 testing is now over.

2 Likes 2 ·