question

Guy Stewart (Victron Community Manager) avatar image

RS shade performance testing - v1.16-beta-04

UPDATE - THIS BETA IS NOW OUT OF DATE - PLEASE SEE THIS THREAD FOR THE SUBSEQUENT BETA VERSION -


https://community.victronenergy.com/questions/255822/rs-shade-performance-testing-v116-beta-05.html


Hello all!

We have a new version available, v1.16-beta-04. Full change log below.

Thank you to all involved in helping and improving the partial shading algorithm in the MPPTs in the RS models. We're close now to an official public release.


For more details of the history, see this beta 1 thread & this beta 2 thread


Feedback is much appreciated - also if it works OK in your system.

Firmware files....


To install this beta version, either use VRM, and then click the little three-dotted icon on the right to see the option to upload a file yourself. Or, with VictronConnect, use the option described in chapter 9.2.


Complete Changelog since v1.15

All models:

  • Add settings lock functionality.
  • MPPT partial shading improvements; including a fixing "#34 excessive input current" error.
  • History logging and VRM reporting:
    • Fix min/max battery voltage history fields sometimes recording an impossible value.
    • Fix VRM energy counters in case the inverter is non-operational.
  • Fix instant read-out of inverter data via Bluetooth (note: update to VictronConnect is needed) (added in 1.16 beta4)
  • Fix in fan control that could cause the fans to operate at full speed during MPPT start-up (b4)
  • Set tracking lost voltage to 65V for all models, so we can scan to a lower panel voltage during operation (b4)


Multi RS:

  • Fix grid charge issue, the unit no longer connected to the grid when allow-to-discharge was inactive.
  • ESS option DisablePVInverters also stops the built-in MPPT charger.
  • Relay test: increase measurement settling time


VE.CAN Port:

  • Fix fast-packet transmissions (applies only to Inverter RS and Multi RS).


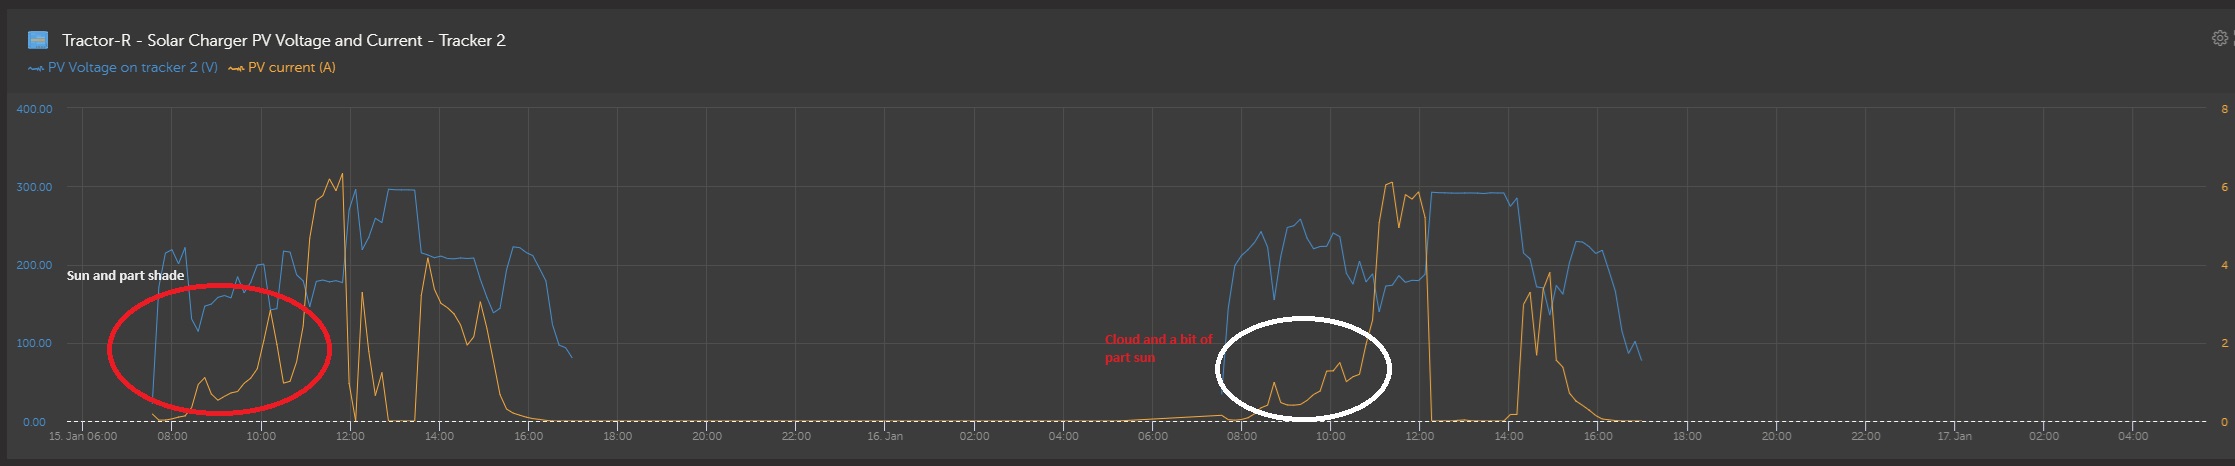
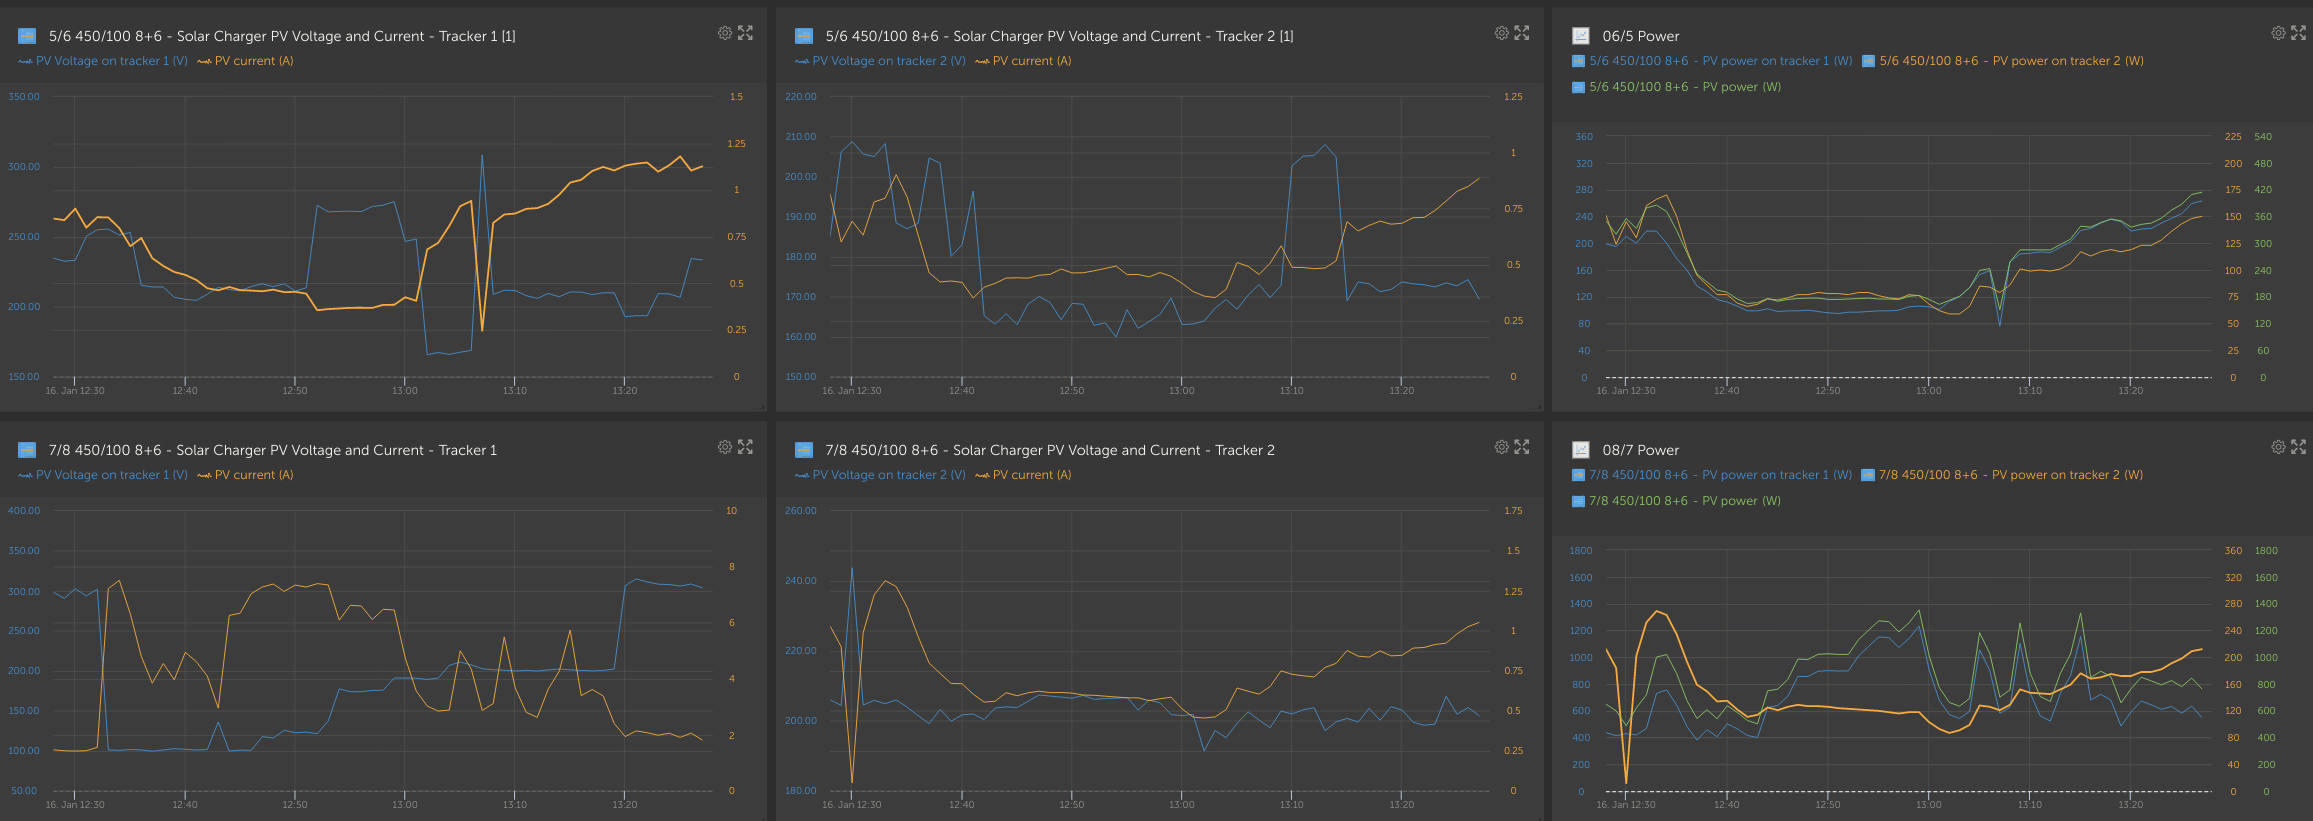
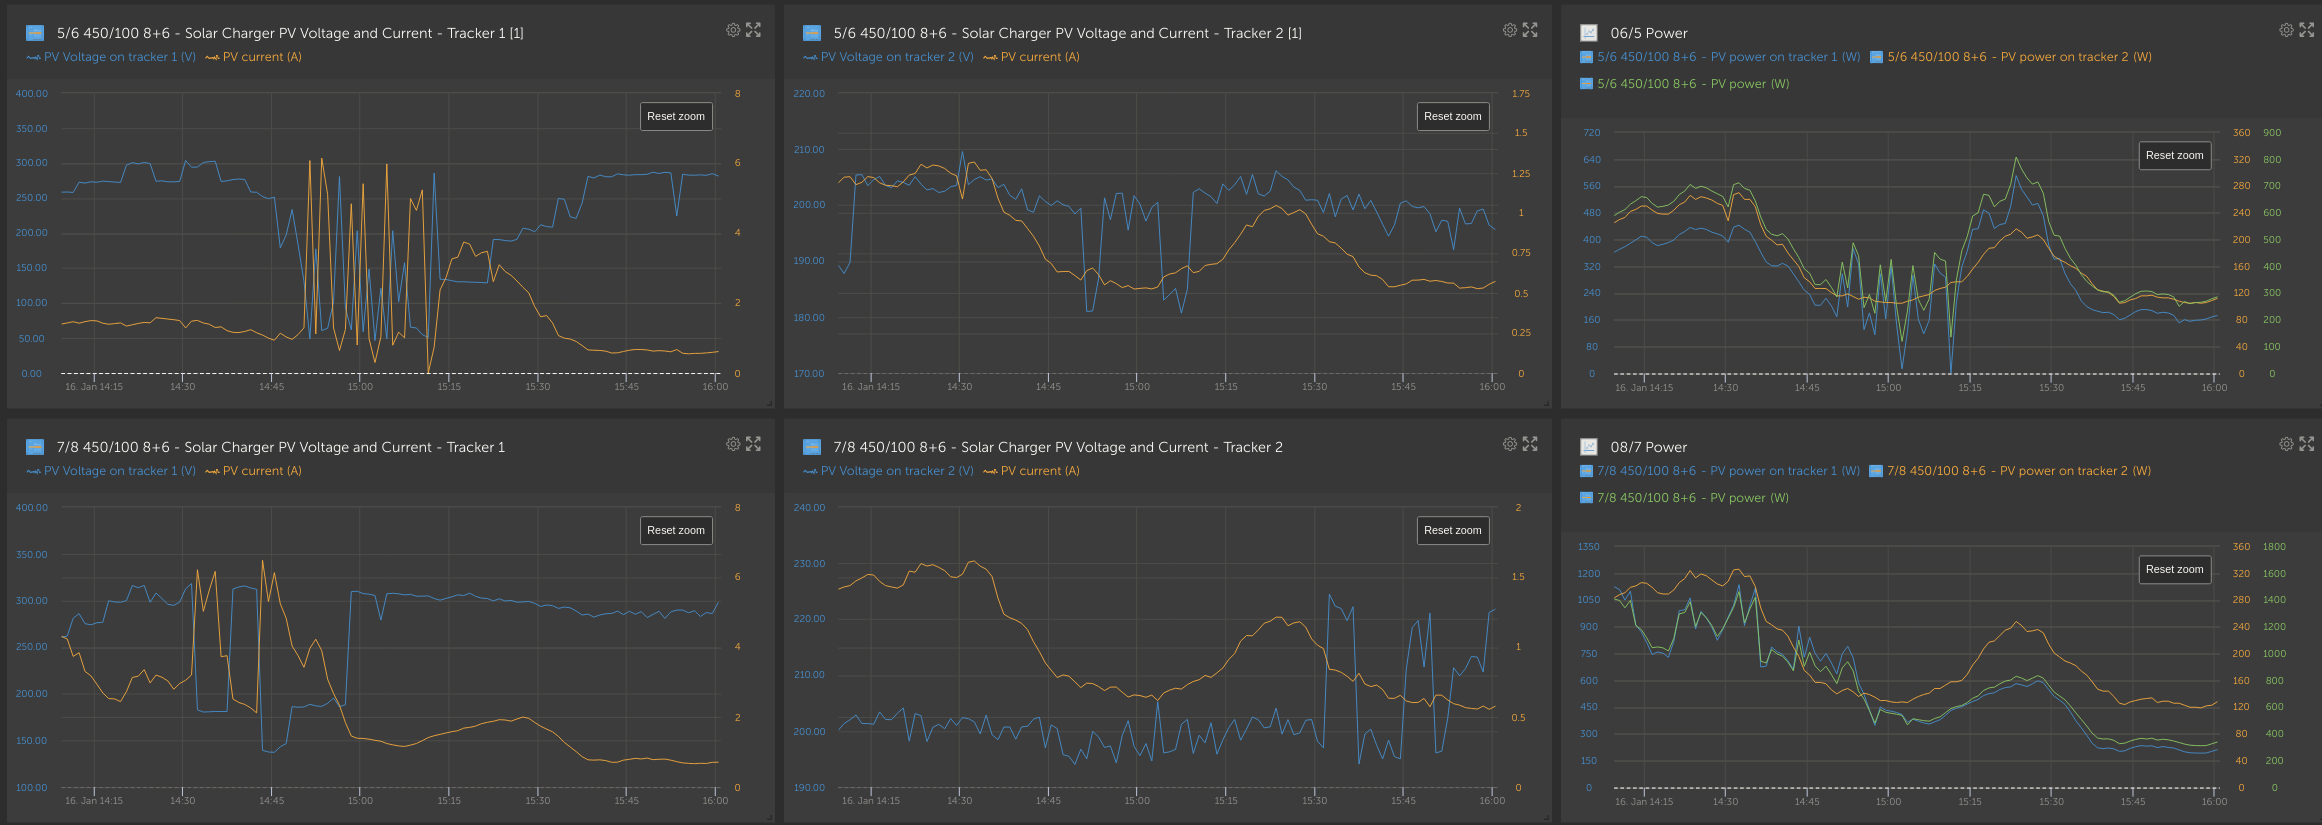
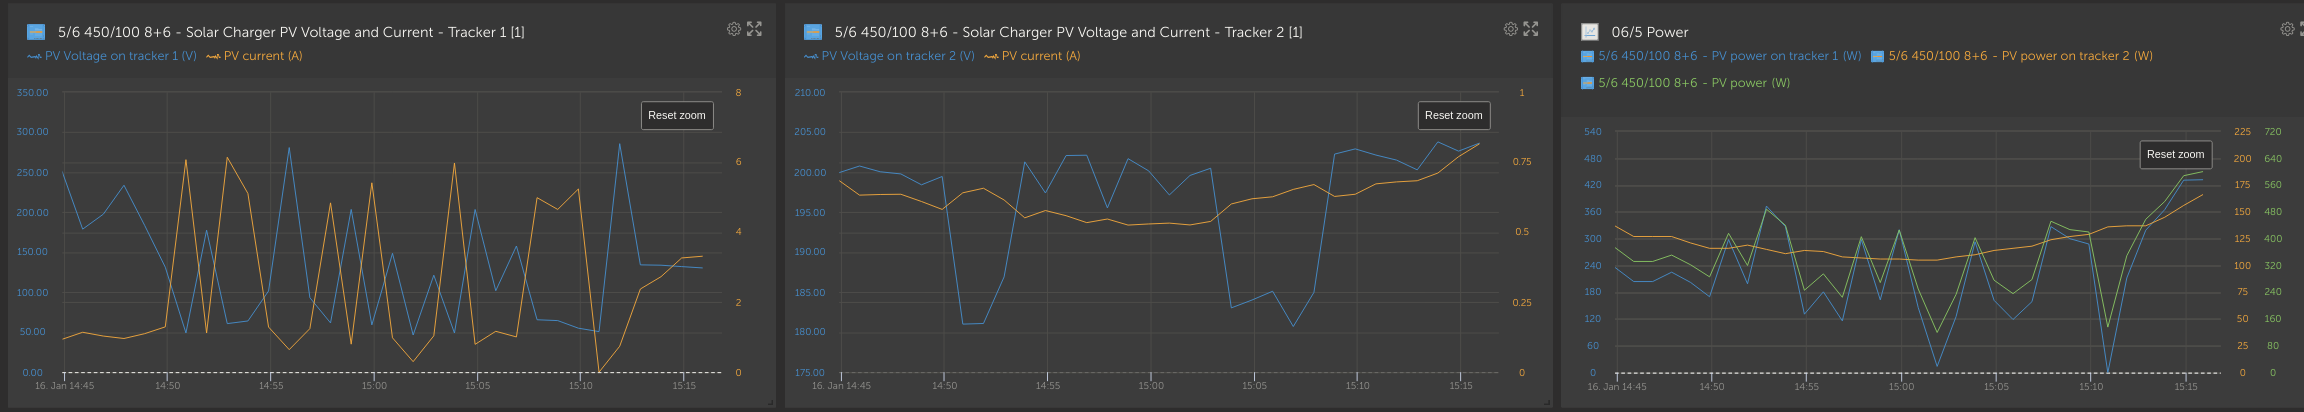
The main purpose of this beta firmware is to test the partial shading improvements in the MPPT, see previous beta threads for more details of those if necessary.


Thanks again for testing this and getting it ready for general release.

attn; @Andrii Podanenko, @Alex Pescaru, @Semlohnhoj , @nesswill, @CM, @beat, @Lee Taylor, @deon.korb, @teezee, @h2009,

Multi RSbeta
2 |3000

Up to 8 attachments (including images) can be used with a maximum of 190.8 MiB each and 286.6 MiB total.

11 Answers
CM avatar image
CM answered ·

Installed ……

2 |3000

Up to 8 attachments (including images) can be used with a maximum of 190.8 MiB each and 286.6 MiB total.

trip-tracks avatar image
trip-tracks answered ·

Thanks, @Guy Stewart (Victron Community Manager)
Just installed on a 5 x MPPT 450-100 system with 35kWp equally distributed east-west orientation near Kingaroy.


2 |3000

Up to 8 attachments (including images) can be used with a maximum of 190.8 MiB each and 286.6 MiB total.

nesswill avatar image
nesswill answered ·

Thanks, @Guy Stewart (Victron Community Manager)

Installed, starting with cloud today but by 12pm should be sunny so a good test.

1 comment
2 |3000

Up to 8 attachments (including images) can be used with a maximum of 190.8 MiB each and 286.6 MiB total.

nesswill avatar image nesswill commented ·

Not much to add as i am not affected as much as others.

Below all I noticed is now the shade power is closer to cloud power (graph below) and can see where the sun pops out. On beta4 i note that the start point was earlier and maybe a more stable voltage? but too early to tell. (after 12 i was @ 100% SOC so the arrays where only need for extra loads)

sr2.jpg

Looking good for me, good job guys!!

0 Likes 0 ·
sr2.jpg (117.8 KiB)
Dierk Grossfeld avatar image
Dierk Grossfeld answered ·

Also Updated both of my 450-200.
In the Last days the Shadow Compentation worked quite well with beta-02.

Lets see. Since the days are getting longer again lets see what today brings with the snow, cloud, sun mix :)

2 |3000

Up to 8 attachments (including images) can be used with a maximum of 190.8 MiB each and 286.6 MiB total.

peregrines avatar image
peregrines answered ·

May I ask what a MPPT firmware update has to do with the new Victron Energy Meter? Thank You!

1 comment
2 |3000

Up to 8 attachments (including images) can be used with a maximum of 190.8 MiB each and 286.6 MiB total.

Hi, nothing; we removed that note - its confusing.
1 Like 1 ·
hotel-lima avatar image
hotel-lima answered ·

Installed on my MPPT 450-200. Experience with the 1.16 beta-02 was already quite good throughout the last weeks. Curious to see how the new beta works.
Thanks for your continued support!

2 |3000

Up to 8 attachments (including images) can be used with a maximum of 190.8 MiB each and 286.6 MiB total.

Dierk Grossfeld avatar image
Dierk Grossfeld answered ·

Just a short first impression:
In the previous betas I had some points at dusk/dawn where the MPPT450/200 had problems tracking the panel Power Point because it lays under 80 Volts.
That leaded to jumping on some trackers between negative, zero and a slight bit positive wattage.

That was also changing very quickly (some seconds between those points).
Looked mostly like it doesnt exactly know what to do :)


That seems to be fixed now.
Trackers seem to work without those "low voltage jumps" (as I called them) now :)


I also want to say:

Thanks for your ongoing support on this topic !

1 comment
2 |3000

Up to 8 attachments (including images) can be used with a maximum of 190.8 MiB each and 286.6 MiB total.

Dierk Grossfeld avatar image Dierk Grossfeld commented ·

Update:

Since we have today relatively cloudy weather:

I have two strings oriented south.

The yield on both a relatively close together now, even due to the fact that atm one is more shaded than the other.

When looking closer on the remaining 5 Strings:
Those are more or less laying flat with 15° toward north-west.
Those are also close together now from peak power and yield perspektive.


Looks like the update does its thing. Yield compared to the last comparable day is a bit better.


L1 + L2 = South

R4 = not connected yet - needs to be build when the weather gets better.

Rest = 15° north-west.


1705404112019.png


PS: All Strings are the same and containing 6x Trina Vertex 425.

0 Likes 0 ·
1705404112019.png (65.0 KiB)
beat avatar image
beat answered ·

Thanks for your support, fixes and the opportunity for your community to openly feedback and help, really appreciated!

Updated both my MPPT RS 450/100 at 10:40-10:45 this morning. Will report how it goes. Today should hopefully be an "interesting" day that will require a lot of MPPT muscle workout, with moving light and heavy clouds, reminder of snow melting, and hopefully real sunshine for an hour or two. I now also have a Fronius on some panels of same roof panes, so we should have an interesting comparison. :-)

Edit: Hint: It would be awesome to also be able to see in the VenusOS and on VRM the 2 MPPT trackers of the Fronius individually, as that would allow a great comparison in my case. Right now, only the L1, L2 and L3 AC power outputs are visible, but not the individual DC power/voltage/curents of individual Fronius MPPTs. (have MPPT1 and MPPT2 of Fronius on different panes, making only an overall comparison possible in VRM graphs right now)

2 |3000

Up to 8 attachments (including images) can be used with a maximum of 190.8 MiB each and 286.6 MiB total.

beat avatar image
beat answered ·

Nice! Globally, beta-04 performed better than beta-02 this morning, adapting steadily voltages without loosing significant power, also compared with the Fronius globally.

But I've still noticed two surprising MPPT decisions at 12:30 for MPPT2 of second unit and at 13:07 for MPPT1 of first unit: Both times the voltage spiked near Voc, without apparent reason, since power dropped consequently. It looks like at 13:07 it noticed to not have the global MPPT anymore, but didn't catch the nearby global MPPT, before catching it a few minutes later. For the 12:30 event don't have an analysis. Will re-check graphs later.

(MPPT1 are at sun-side with partial shading, MPPT2 are not directly exposed to sunshine during that short period of time)

mppt-issues-part-snow-sunshine-clouds-2024-01-16.png


6 comments
2 |3000

Up to 8 attachments (including images) can be used with a maximum of 190.8 MiB each and 286.6 MiB total.

beat avatar image beat commented ·

Generally quite well behaving, but got another surprising sudden behavior this afternoon between 14:50 and 15:12 on first unit MPPT1 tracker, when there was a cloud going over, leading to a bit erratic power output (at low power but still no reason for only 14W and 0W): Something still seems slightly fuzzy with global MPPT at low power at least:

mppt-issues-part-snow-sunshine-clouds-2024-01-16b.png


Zoom here on that unit at those times which shows the obviously wrong gmppt decisions on mppt1 (no such sudden partial shadings at that time):


mppt-issues-part-snow-sunshine-clouds-2024-01-16b.png


0 Likes 0 ·
mvader (Victron Energy) avatar image mvader (Victron Energy) ♦♦ beat commented ·
Hi Beat, what happened between 14:50 and 15:12 is that on tracker 1 the PV array voltage was hitting the under voltage limit.


When that happens, the converter stops, and restarts.


Which explains the spikes.


Having looked at this and discussed it now, it seems that this can be improved upon a bit, but actual gain in solar power is expected to be low; and regardless its something for later, as I don’t think its necessary to delay the v1.16 release over this.


The other thing, the dip in amps + spike in pv voltage in your graph “ 7/8 8+6 tracker 2” is most likely normal behaviour: every 5 minutes the mppt does a short scan, to make sure its on the MPP. And sometimes VRM happens to “catch” that. Making the graphs show dips and spikes.

0 Likes 0 ·
Alex Pescaru avatar image Alex Pescaru mvader (Victron Energy) ♦♦ commented ·

Hi @mvader (Victron Energy)

Thank you for explanation and thank you for confirming what I was believed from the first place about VRM and send data to VRM: sometimes the sending data to VRM is synchronous with the tracker's scan.

Is it possible to make sure from programming point of view to not send the data to VRM during a scan? You'll get a much more cleaner graph and a much smaller number of users that's wonder what's happening.

Don't know how is best to be implemented, you know for sure, but I've suggested instead of a fix 5 minutes, introduce a little bit of random: rescan_time = 290s + random(20s), meaning rescan at intervals between 290 and 310 seconds. That way will be a much smaller chance to get in sync with sending data to VRM.

Thanks for listening.

0 Likes 0 ·
mvader (Victron Energy) avatar image mvader (Victron Energy) ♦♦ Alex Pescaru commented ·
Yes, we’re indeed considering such change. Best is to not have that data on vrm at all anymore.
0 Likes 0 ·
snoobler avatar image snoobler mvader (Victron Energy) ♦♦ commented ·
Personally, I like it. I get to show people how hard my MPPT is trying to give me all the goody!
1 Like 1 ·
beat avatar image beat mvader (Victron Energy) ♦♦ commented ·

Thank you for the fast reply @mvader (Victron Energy) !

Re between 14:50 and 15:12: The repetitive restarts is indeed a good explanation. Indeed at lowest voltage the gain isn't big, but when weather isn't great every additional Wh is even more appreciated. It sure is not a show-stopper for v1.16 release.

Re VRM sampling (spikes at 12:30 and 13:07): It would make sense to send to VRM, instead of the instant power reading, the average power reading since the last VRM probe. At least for power but same for voltage and current. For power it would make a lot of sense, since then the power over the sensing period would also truthfully represent the really harnessed energy.

Or at very least, send the latest P/I/V points that you had before the scan, if a scan is on its way exactly at VRM sampling time. It would make graphs much cleaner. Now of course on Victron Connect, it should stay as is for diagnostic purposes.

Re I/V or P/V scan-curves logging, and viewing graph of global-MPPT scans in Victron Connect and/or VRM: That would really be an awesome feature for all your installers ;-)

0 Likes 0 ·
Alex Pescaru avatar image
Alex Pescaru answered ·

Hi @Guy Stewart (Victron Community Manager)

Thank you for your efforts and new version. Installed today. All seems to be OK.

Hi @beat

There is something odd with your PV array...

Which type of panels do you have? Did they have bypass diodes? Are the bypass diodes OK?

I've also had a day with a lot of clouds and sun alternating quite quickly.

Below my results.

Take into account only the first part of the day, up until 13:45, because after that the trackers were limited by the consumption and the fact that the batteries got fully charged.

trackers.jpg


trackers.jpg (101.8 KiB)
4 comments
2 |3000

Up to 8 attachments (including images) can be used with a maximum of 190.8 MiB each and 286.6 MiB total.

beat avatar image beat commented ·

@Alex Pescaru Thanks for answering, and asking for type and diodes:

Edit: btw: On your graphs, the voltage seems always at maximum until 13:15, so it looks like you didn't have any partial shadows then ?

I double-check once more:

My solar panels are 120 cells Trina Vertex dual glass monocrystalline type TSM-NEG9.28 of 415Wp each Datasheet: https://static.trinasolar.com/sites/default/files/Datasheet_Vertex_S+_NEG9.28_EN_2022_PA3.pdf . They have bypass diodes, according to their manual https://static.trinasolar.com/sites/default/files/Vertex_User_Manual_July2022.PDF like any modern PV panel (are there any without bypass diodes nowadays?) and have corresponding visible junction boxes at their back for the diodes. They are new, came to the roof in original manufacturer palette packaging, have been handled and connected properly by trained professional installers, and strings have been measured for compliance to specs by an auditor. All frames are properly earthed to a professionally installed and audited/measured lightning protection system. And we didn't have lightning strokes nearby. So any damage to diodes, although never impossible, are highly unlikely, especially on 4 different strings.

I could try to verify those, by applying a very small current source and measuring the voltage, I don't see how to test all diodes of a string.

Now, what makes you think on my graph that diodes would be damaged ? Except for the odd behavior at low power, the rest of the day seem to work properly for a not great PV day ?

The odd thing is that today the weather was with a lot of clouds, and very little sun, and a few weeks per year we have lots of medium-far shadows, which is the reason to have tried to choose great MPPTs in conjunction with modern panels, not too large strings and a strings cabling layout on the roof taking into account shadings and the solar panels architecture. We excluded optimizers to avoid electronics up there and also due to documented incompatibility, potentially damaging Victro-MPPTs.

If Victron MPPTs could show us the current-voltage or power-voltage result of their global MPPT scans in VRM or at least Victron Connect apps, like some other inverter manufacturers, installers could diagnose much better diode failures, and many many other PV issues, like e.g. bad contacts..... Hint Hint @mvader (Victron Energy) ;-)

0 Likes 0 ·
Alex Pescaru avatar image Alex Pescaru commented ·

Hi @beat

My mistake about the diodes...

Now, looking with more attention to your graphs, I see that you've left the autoscaling option ON in contrast with me where I've manually set the graphs vertical axis limits and therefore I had the impression that the vertical axis starts from 0 on your case, but no, it's not the case.

I believed that you had an excursion of voltage greater than 3/4 of panel total voltage for the same current that it's not normal and characteristic for strings with problematic diodes.

My bad, sorry...

But maybe it's not a bad idea to set manually the vertical axis from 0 to max, because in that way you have a more ample and correct vision about all parameters and their variance and a big variance like you see now on your graphs could be, in fact, just a small one.

As for me, the partial shading starts after 14:00, but unfortunately, not so evident on yesterday graph.

Only from 15:40 to 16:00, where there was a need for increased power and you can see the partial shading and the diodes working.

Alex

0 Likes 0 ·
beat avatar image beat Alex Pescaru commented ·

No worries, but the issue is that VRM doesn't allow to set only the minimum value, leaving the maximum value empty for auto-scaling depending on weather conditions. Nor does it allow to have a single axis graph with automatic (and also not with automatic maximum and a minimum set at 0). That's why I have to leave it automatic during vastly changing periods. I did some manual adjustments just for screen dumps, but not for the latest one. Another VRM graphing bug in newest non-beta version is to be unable to edit the axes of an existing custom widget are out of this topic, but probably not worth another full topic imho, pinging @Guy Stewart (Victron Community Manager) for this comment so just so Victron is aware this minor VRM side issue).

0 Likes 0 ·
Alex Pescaru avatar image Alex Pescaru beat commented ·
Yes, but you know the characteristics and you put the max value accordingly.

Even a lower value it's OK, because anything greater will not be plotted.

You saw that on my case it's a 5x50Voc = 250V max for voltage, and 5x460W, meaning 2000W (for real NMOT) it's OK. And they look pretty OK and can see at a glance all.


0 Likes 0 ·
andrii-podanenko avatar image
andrii-podanenko answered ·

Installed

v1.16-beta-04

This is unrelated to firmware, but on OSX, Multi RS Dual tracker, Desktop VictronConnect client

1705497458955.png


1705497523975.png


Will see how it goes https://betavrm.victronenergy.com/installation/370388/share/c0152a83


PS. I would love to see full MultiRS ESS support in VRM some day, similar to MultiPlus II.


1705497458955.png (122.3 KiB)
1705497523975.png (120.2 KiB)
4 comments
2 |3000

Up to 8 attachments (including images) can be used with a maximum of 190.8 MiB each and 286.6 MiB total.

Hi @Andrii Podanenko

Can you create a service report (https://ve3.nl/VictronConnect_How-to-create-a-VictronConnect-Service-Report) after connecting to the Multi RS and it has this weird value and post that service report here in a comment?

Kind regards,

Thiemo van Engelen

1 Like 1 ·
andrii-podanenko avatar image andrii-podanenko Thiemo van Engelen (Victron Energy staff) ♦ commented ·
0 Likes 0 ·
weird-zero-value.log (554.9 KiB)
andrii-podanenko avatar image andrii-podanenko Thiemo van Engelen (Victron Energy staff) ♦ commented ·

After installing beta5

1705580810187.png

@Thiemo van Engelen (Victron Energy staff) - looks like it is now steady at 2640W despite the fact output is changing, see https://betavrm.victronenergy.com/installation/370388/share/c0152a83


Service report on beta5

beta5.log.zip

/cc @Guy Stewart (Victron Community Manager)

0 Likes 0 ·
1705580810187.png (189.8 KiB)
beta5log.zip (921.8 KiB)
andrii-podanenko avatar image andrii-podanenko commented ·

Shows 0 after some time ( 5+ minutes ) ( this was always such )1705497882807.png

0 Likes 0 ·
1705497882807.png (195.7 KiB)

Related Resources

Mutli RS Solar Datasheet

Mutli RS Manual


Additional resources still need to be added for this topic