question

setnof avatar image
setnof asked

VRM BUG - Advanced charts of RUUVI sensors stopped working

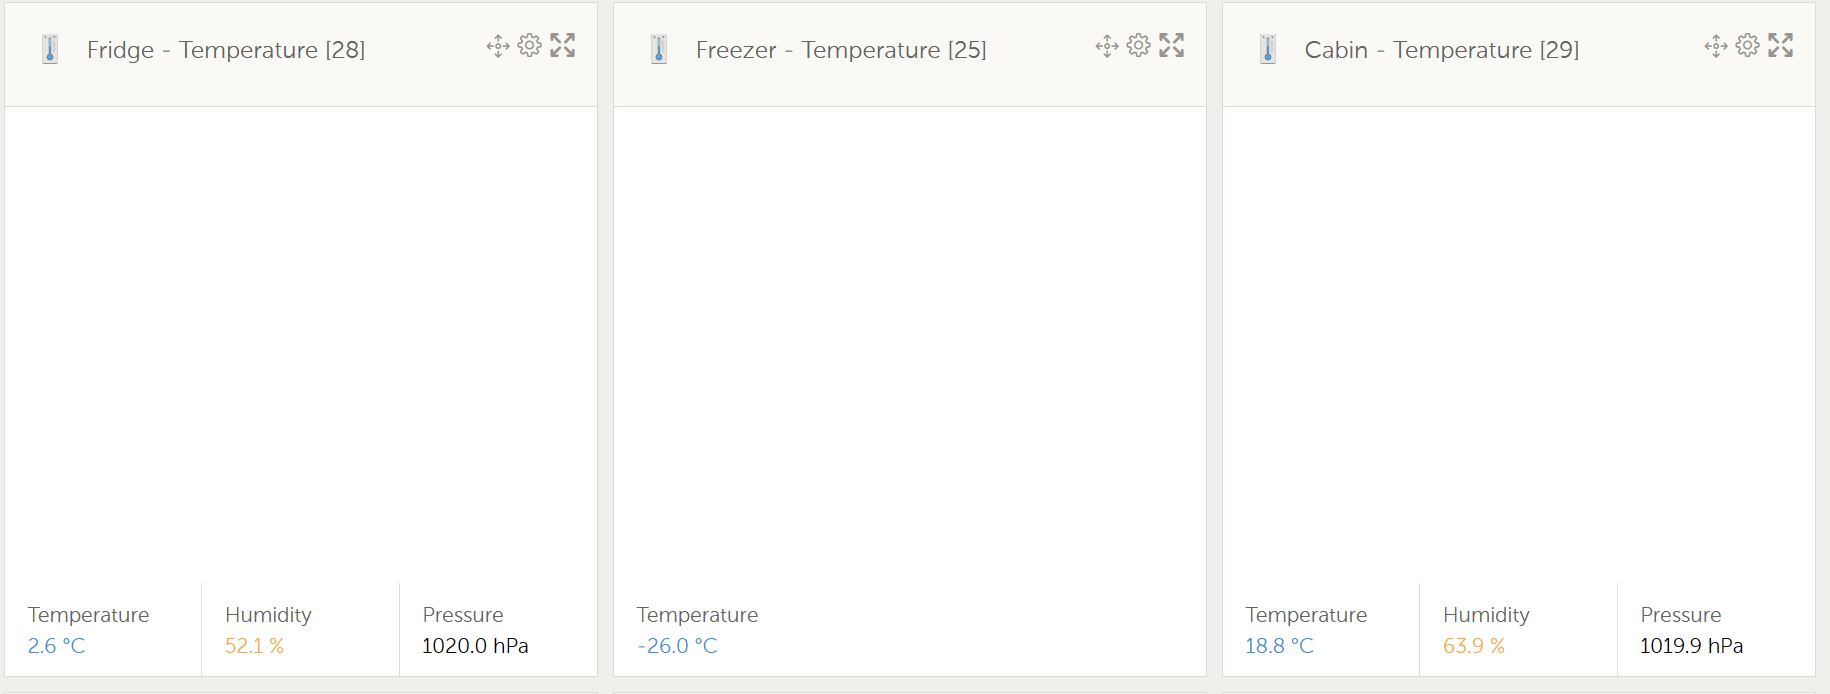
Since a few days the advanced charts of my RUUVI sensors aren't working anymore and there are a few errors in the console like "20 $digest() iterations reached. Aborting!" or "Unhandled Promise Rejection: TypeError: undefined is not an object (evaluating 'k.Xy')"

I tried to remove them and added them again but I found no way to delete the historical data.

vrm advancedruuvi sensors
1 comment
2 |3000

Up to 8 attachments (including images) can be used with a maximum of 190.8 MiB each and 286.6 MiB total.

danapple avatar image danapple commented ·

The graphs are gone for me, too, but I do not see the scripting errors. Also, the GlobalLink 520's own graph of signal strength (GlobalLink - Summary) is gone, so the problem is not limited to Rruvi sensor data.


Dan.

1 Like 1 ·
5 Answers
pwfarnell avatar image
pwfarnell answered ·

Mine are working OK. Have you tried rebooting your GX device, I find that rebooting is the first thing to do on loss of any sensors or garbage info and this typically sorts things out. There is no way to delete old VRM data as far as I know.

2 comments
2 |3000

Up to 8 attachments (including images) can be used with a maximum of 190.8 MiB each and 286.6 MiB total.

setnof avatar image setnof commented ·

I've just updated the firmware and rebooted the device but unfortunately the problem still persists. I've also tried different browsers.

0 Likes 0 ·
pwfarnell avatar image pwfarnell setnof commented ·
Try them in a custom chart.
0 Likes 0 ·
ulrikmailand avatar image
ulrikmailand answered ·

Same here the default chart on the ruuvis have stopped working - if you create a manual graph it works - but it must be some sort of a bug in VRM

2 |3000

Up to 8 attachments (including images) can be used with a maximum of 190.8 MiB each and 286.6 MiB total.

ponzoa avatar image
ponzoa answered ·

My Ruuvi and also my Victron temp sensors are showing in blank in VRM advanced.. I have current temps on my main page but in advanced, they're blank. I trust it will be resolved shortly.

2 |3000

Up to 8 attachments (including images) can be used with a maximum of 190.8 MiB each and 286.6 MiB total.

Alexandra avatar image
Alexandra answered ·

@ponzoa @Setnof

They work in the custom charts.

2 comments
2 |3000

Up to 8 attachments (including images) can be used with a maximum of 190.8 MiB each and 286.6 MiB total.

ponzoa avatar image ponzoa commented ·
not good enough. I am not going to go and make custom charts for all my clients out there. I'll wait for Victron to fix it. Thanks.
0 Likes 0 ·
Al avatar image Al ponzoa commented ·

Yeah, all my individual charts have stopped plotting too, across three systems on VRM, but the custom aggregated temp charts work for some reason.

0 Likes 0 ·
dunnp avatar image
dunnp answered ·

I have the same issue - no graph lines on the widgets, just current values.

vrm-screenshop-101023.png

It happens on iOS and Windows, and with plain temperature sensors as well as Ruuvi units. All the other widgets I've setup seem fine.

It was working fine up until a few days ago.

Cheers.

Phil


2 |3000

Up to 8 attachments (including images) can be used with a maximum of 190.8 MiB each and 286.6 MiB total.

Related Resources

Additional resources still need to be added for this topic