Hi altogether!
There are already some posts about incorrect AC values, but none of them with the exact same situation or the same information.
| My system: | 3-phase ESS with MultiPlus-II 48/8000/110-100 |
| PV chargers: |
4x MPPT 250/100 VE.CAN |
| GX device: |
Cerbo GX |
| Batteries: |
4x Pylontech US5000 (1 currently out of order) |
| Mode: | Optimized (without BatteryLife) |
| Grid metering: | Inverter/Charger |
| Multiphase regulation: | Total of all phases |
| Grid setoint: | 0W |
| Firmware Multis: | v502 |
| Firmware GX: | v3.01 |
Sometimes the GX device shows way too high values for AC loads.
On the example screenshots below it displays 1667 W whereas the correct value is around 379 W.
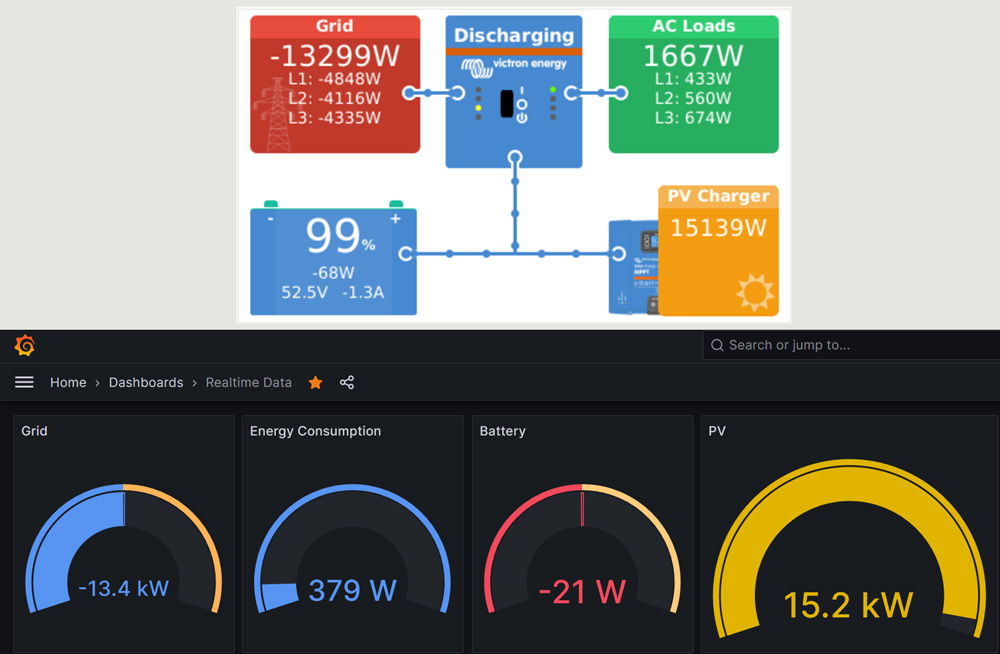
I visualize the data (from MQTT) in Grafana. But for Energy Consumption I use data from a separate ABB meter installed at the output of the Multis.
The 13,3 kW feed-in match more or less with the value shown on the grid provider's smart meter and the 379 W consumption agree with the ABB meter.
So, where does the rest of the PV energy go?
If I take the values from the GX, the calculation adds up more or less.
15 139 W - 13 299 W - 1667 W = 173 W
But if I use the correct AC Loads value:
15 139 W - 13 299 W - 379 W = 1 461 W ?!?
The deviation can also be seen on my graphs:
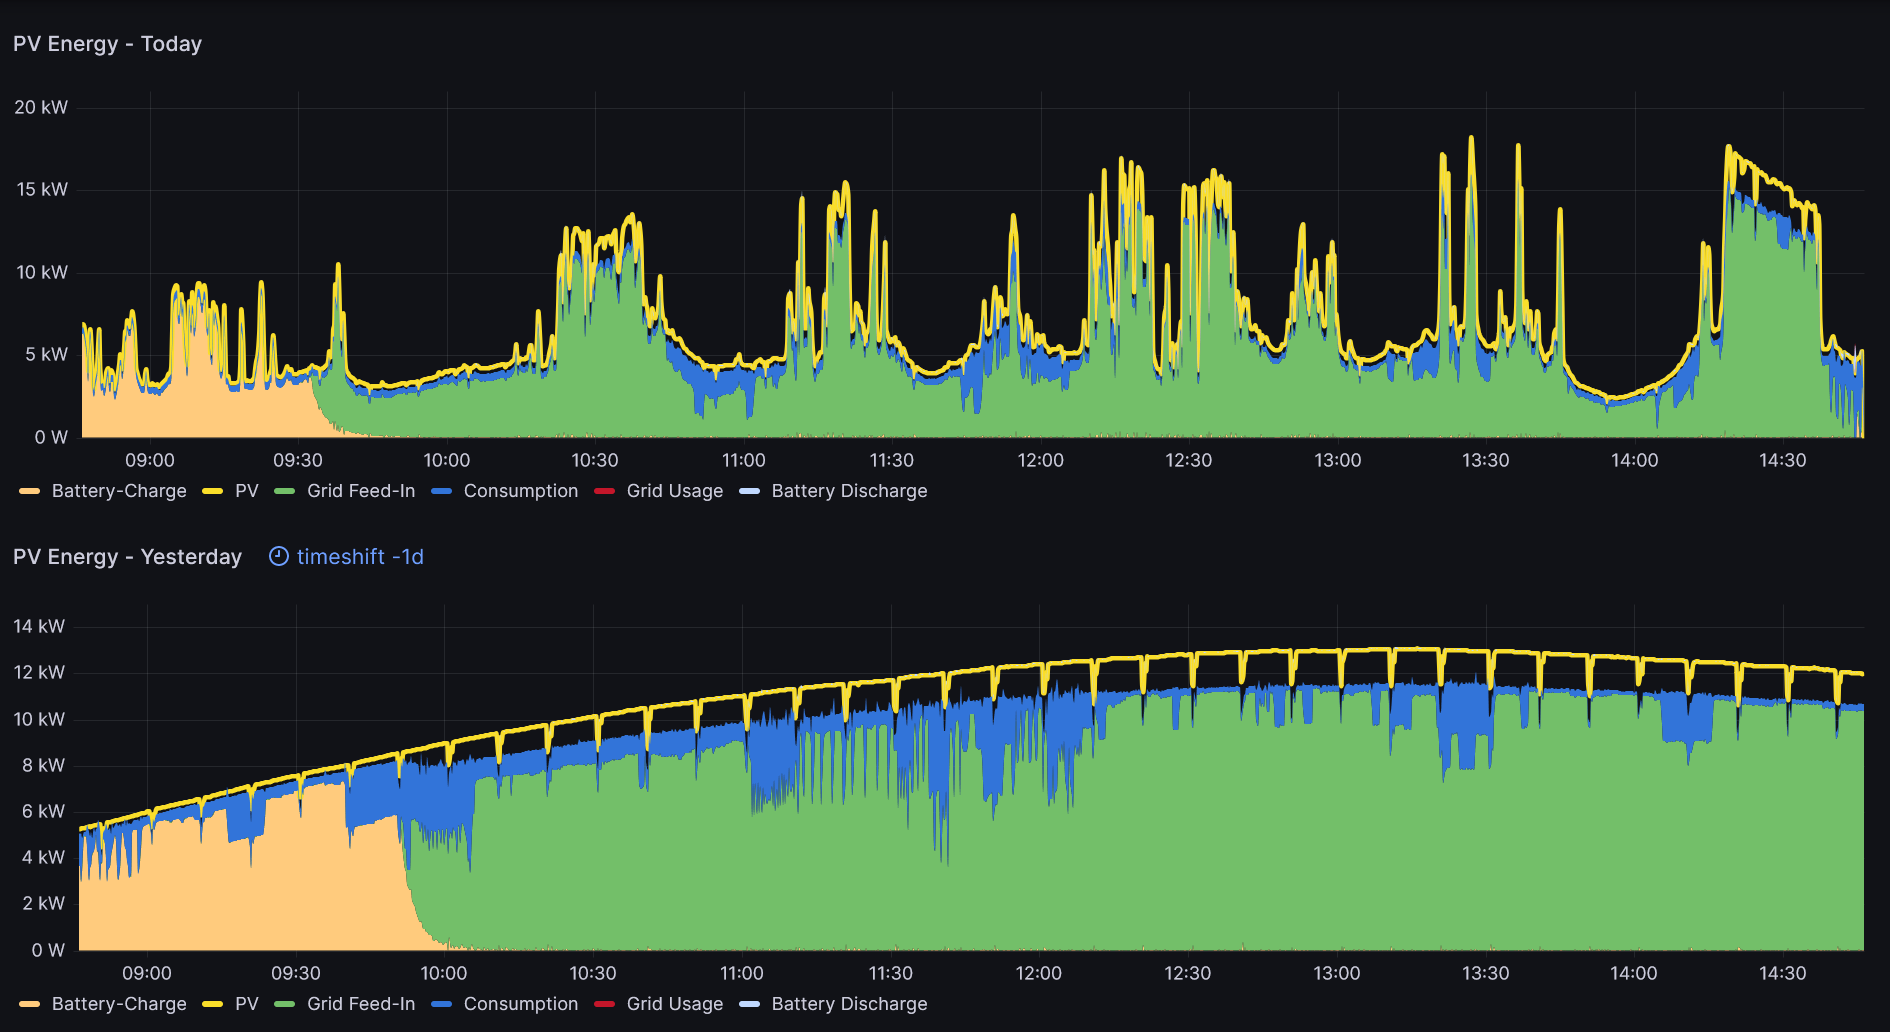
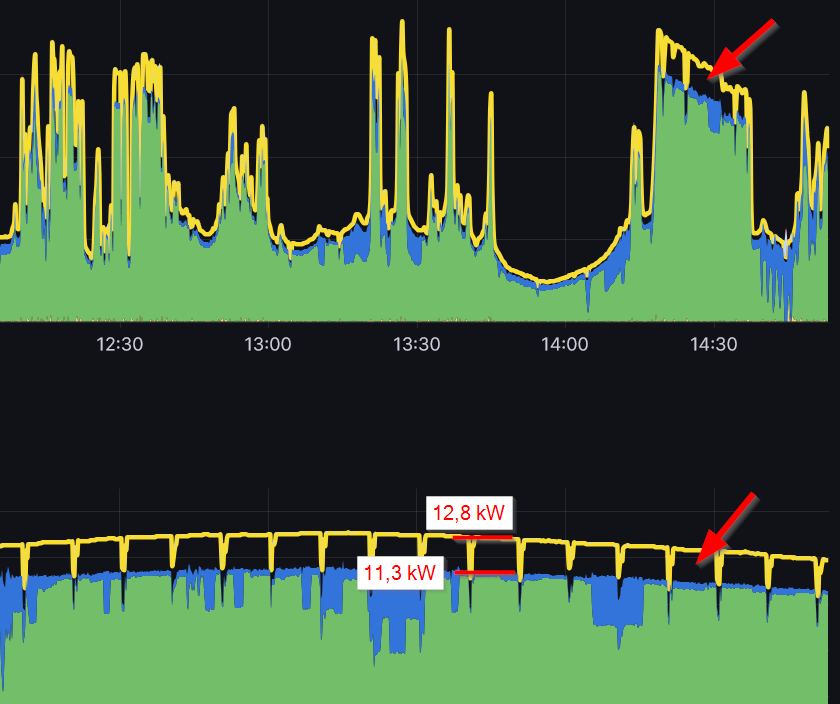
Yesterday (when we had constant sunny weather) the deviation began after the the batteries were fully charged and today (changing weather) it only appeared during a phase where the PV power was at maximum.
So it seems to occur, if
- the battery is fully charged and
- PV production is at maximum
Does anyone experience the same thing?
Battery is full, Grid value is correct, PV values seem also correct (if I look at the graph from yesterday). So, where does the rest of the PV energy go?
Thanks,
Matthias