Hi everyone. We have over 50k custom widgets now on VRM, and we would love to show some examples of what you can make with them on the Intersolar fair next week. If you’ve made a custom widget that you would like to share, please respond to this message, so we have actual life use-cases to showcase. You might also draw some inspiration from the work of others ;-)
Thank you!
Please ensure not to disclose your installation name or ID, just a screenshot of the widget and your goal of using it.
asked
Please tell us about your VRM custom widgets
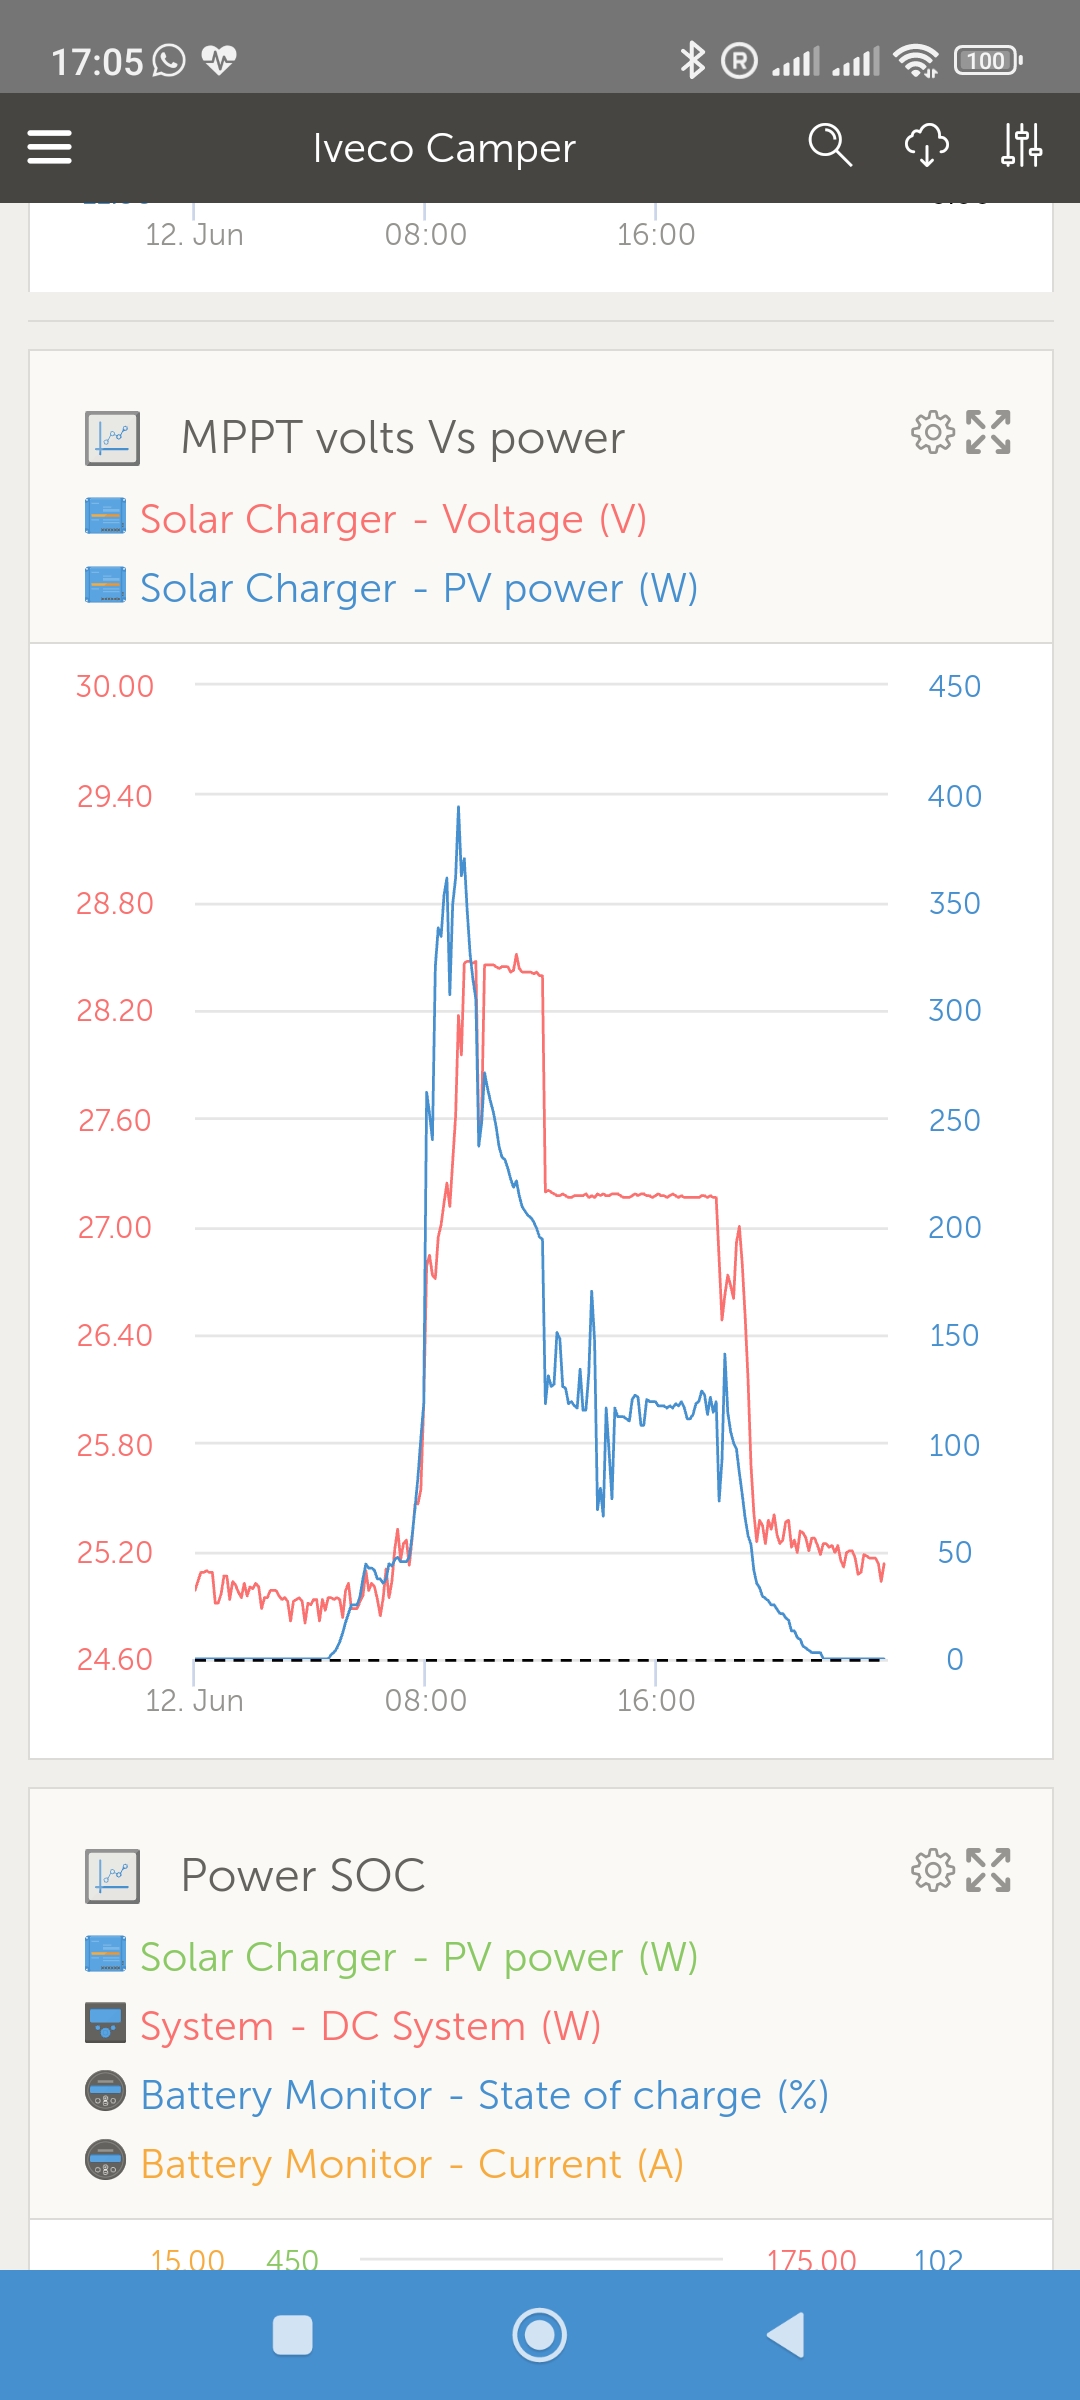
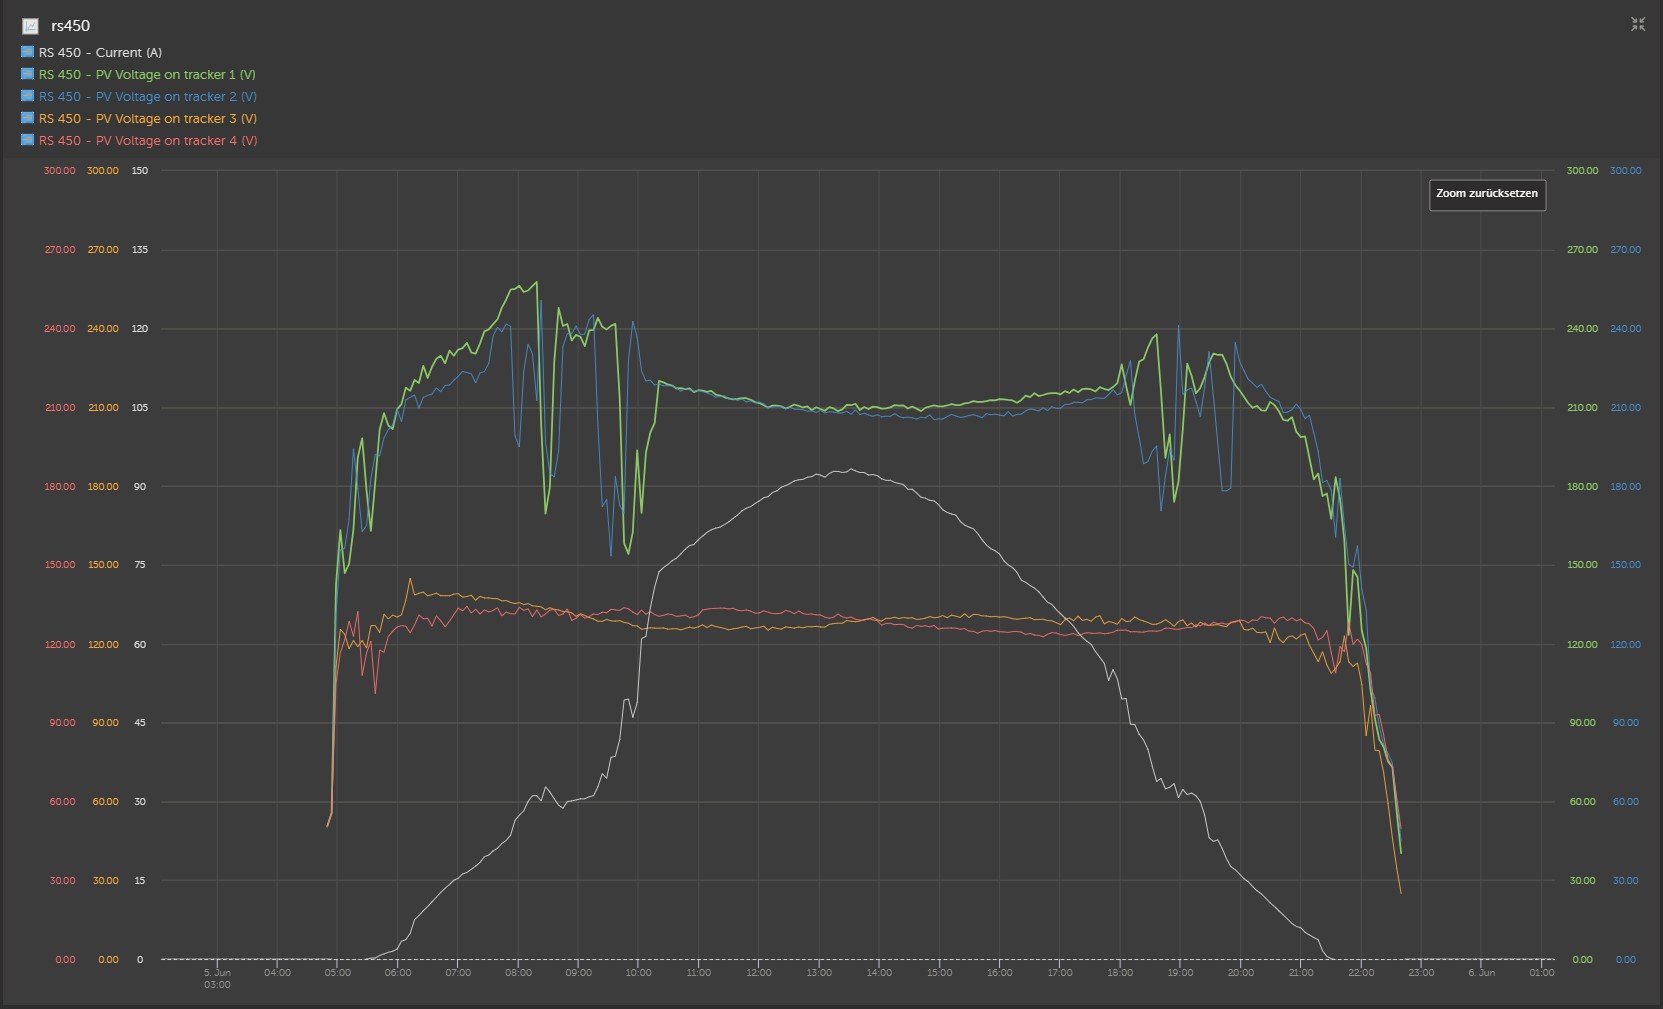
Common misconception is that MPPT will always deliver power and that there's a link to voltage. I use this to show people that due to the varying loads and the tracking on the MPPT, the power/volts link is not true
A couple i use/have similar to others...
sorry and this one...
you mean like that: ?
![]()
![]()
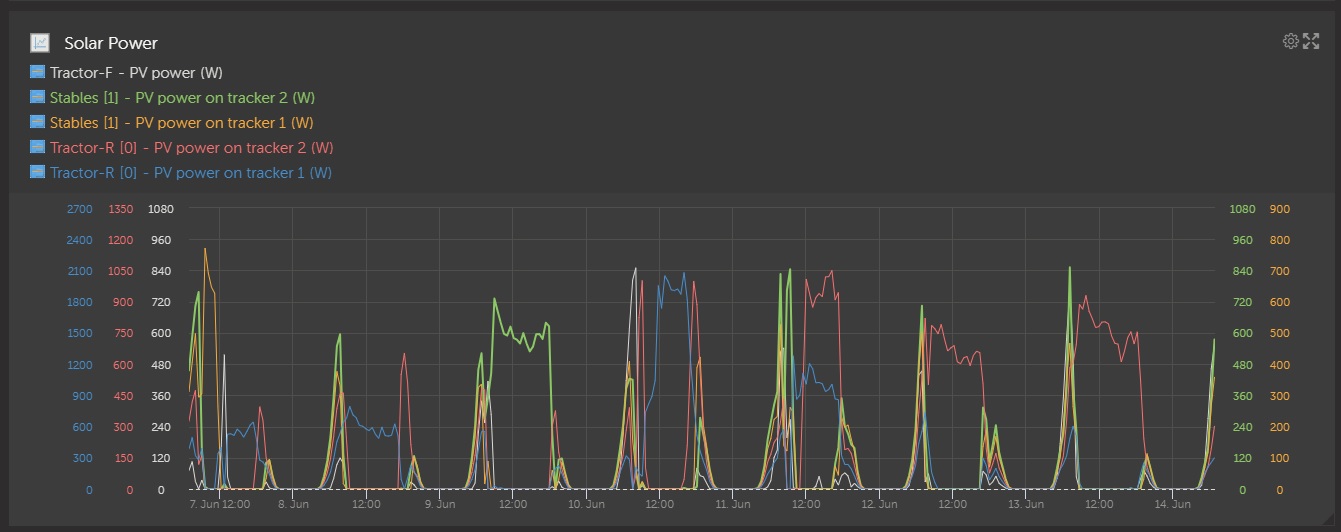
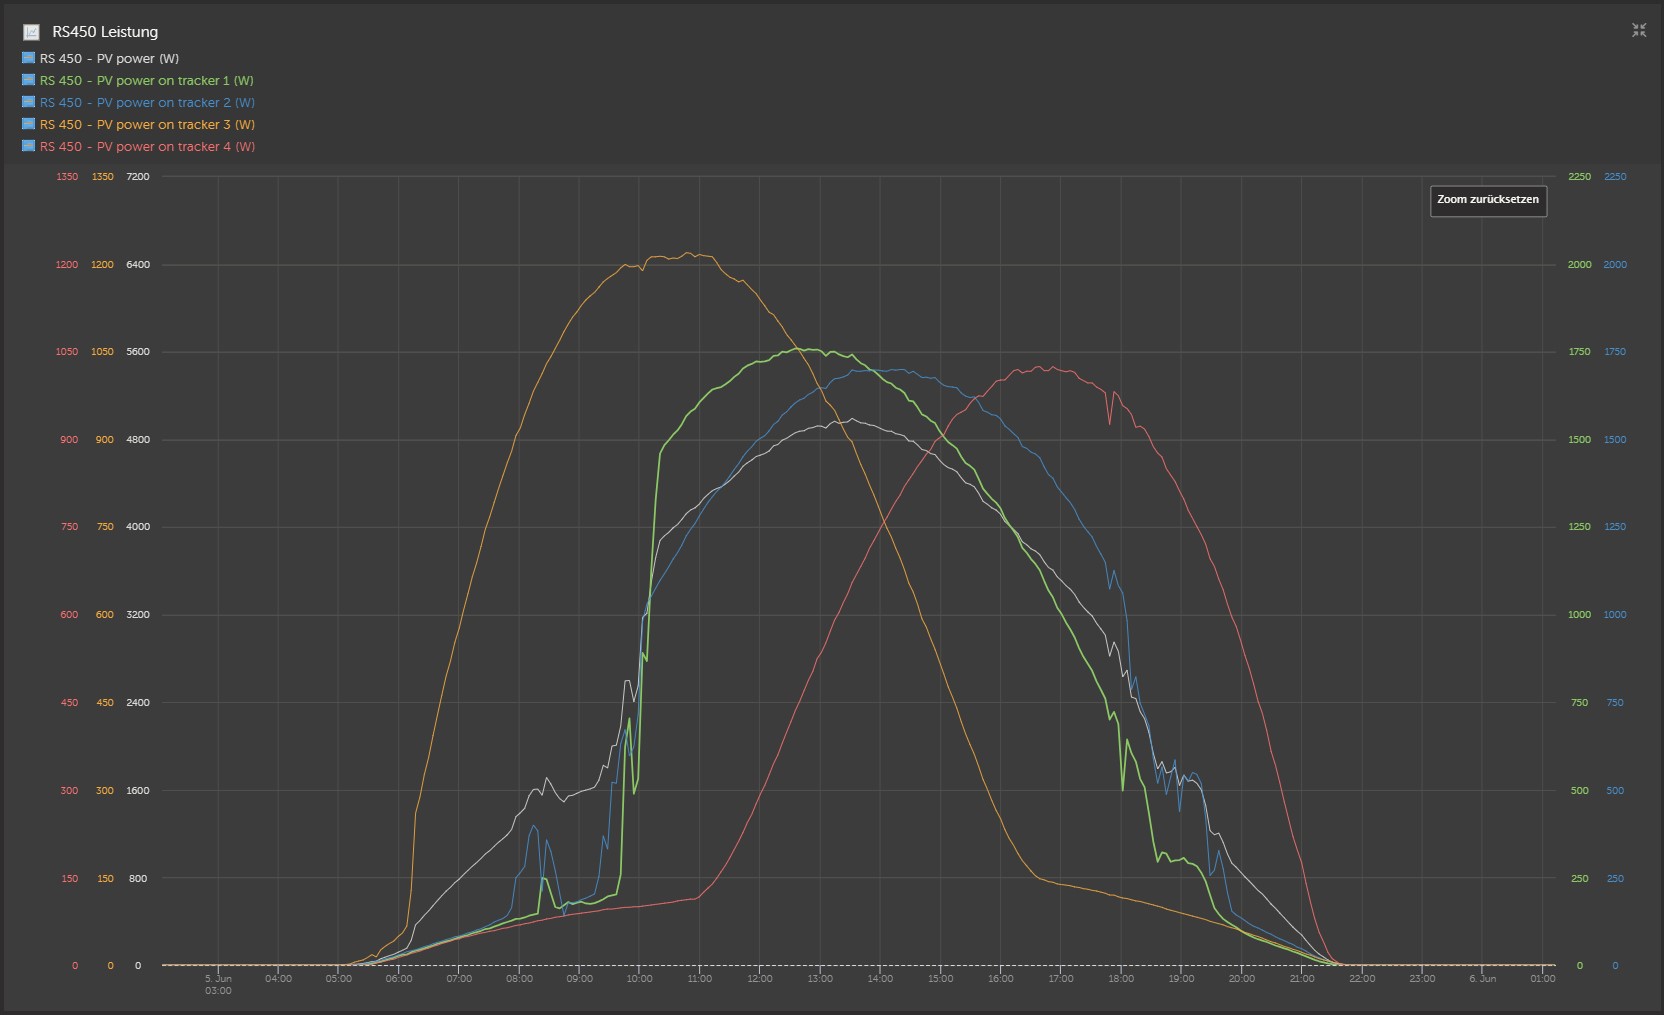
so i am able so see, what the strings are doing over the days,
which trees or objects make shadow, or can be optimized, if modules work as expected... etc.
four strings on one RS450/200 in an onephaseinstallation with MP2 5000 and 4x pylontech us3000c
:)
edit: now i see, the question was already 3 days old?
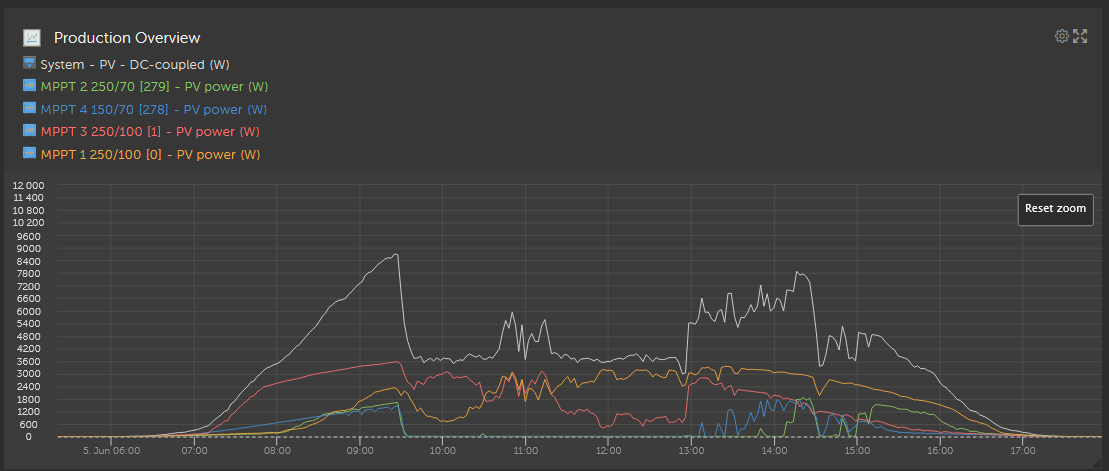
We also use the solar yields like @cacer to see which arrays work when.
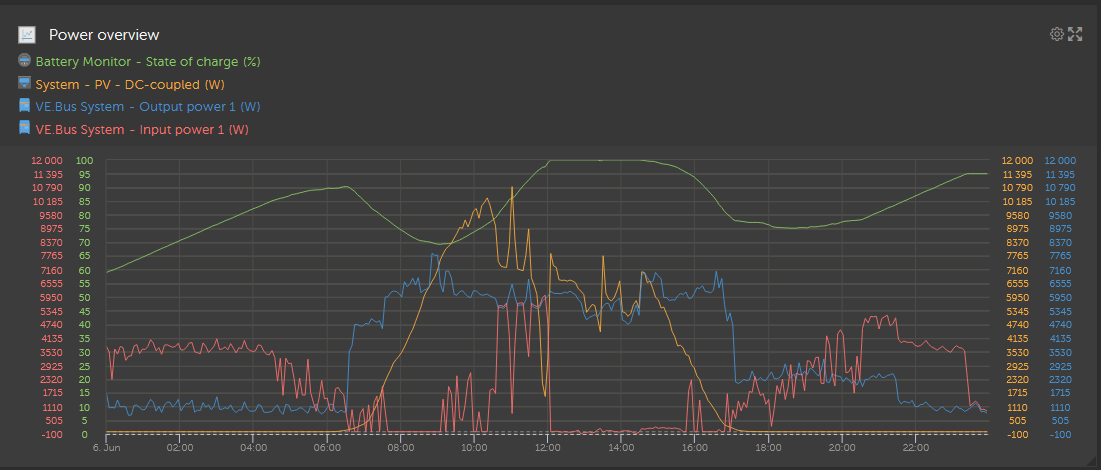
We have another one called the Power Overview, where we can see where the energy being used is being drawn from grid solar or battery.
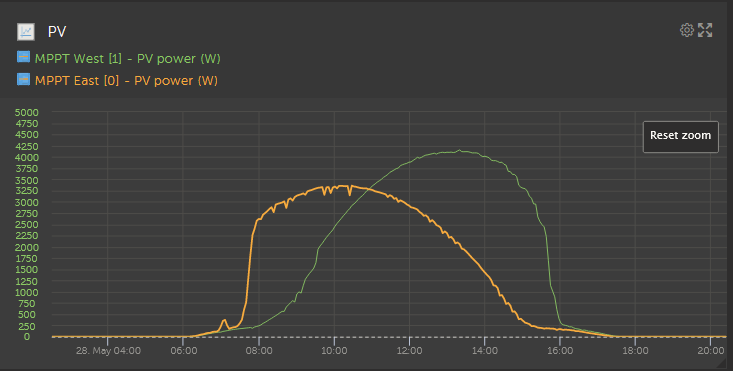
PV production with an East West set up. The East array is a funny jump in the curve there; it has interesting shading cutting off the first hour of the production day almost entirely.
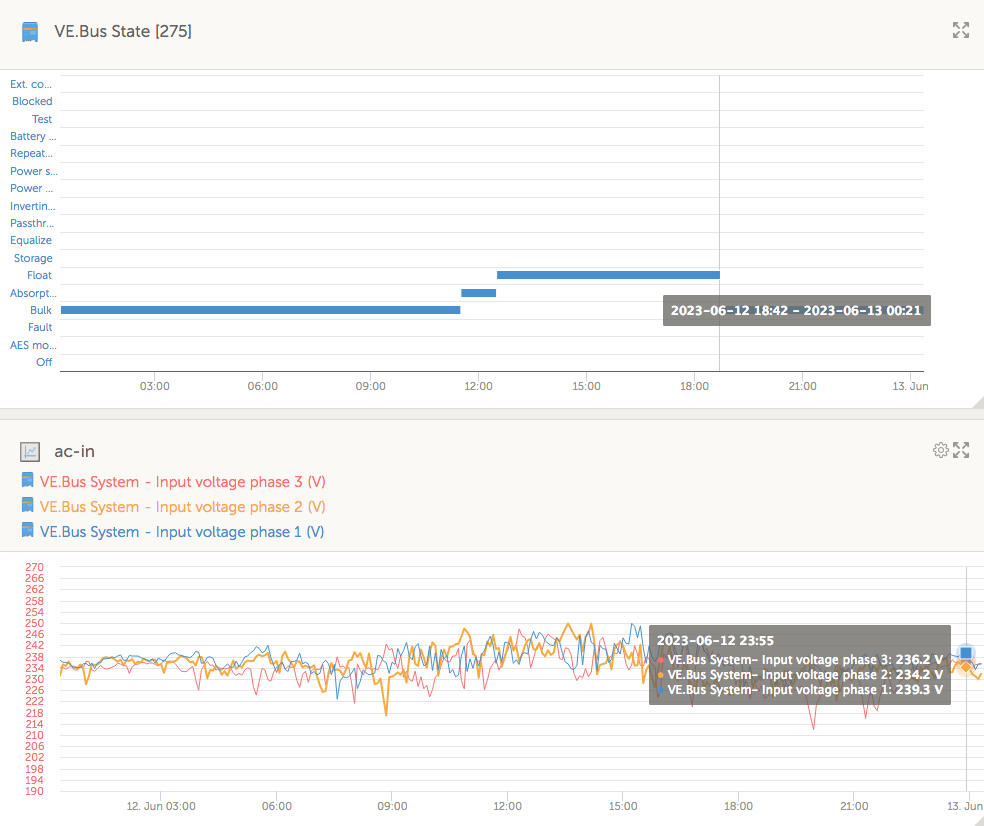
I made a simple custom widget that shows the AC-in Voltages. I needed that since I have sometimes a problem with the high AC-in Voltage on one phase and low on the other.
The only problem I have is that my custom widget has wider X-axis than a standard graph and I cannot place a cursor close to the right extreme to see the Voltage values. When I do that the cursor changes to the width adjustment mode and does not show the values.
We will fix that, so that we add a bit of space to the far right of a custom widget when it has only 1 y-axis.
@Barbara (Victron Energy)
Thank you.
This will make such custom widget consistent with 1 y-axis non custom widget.
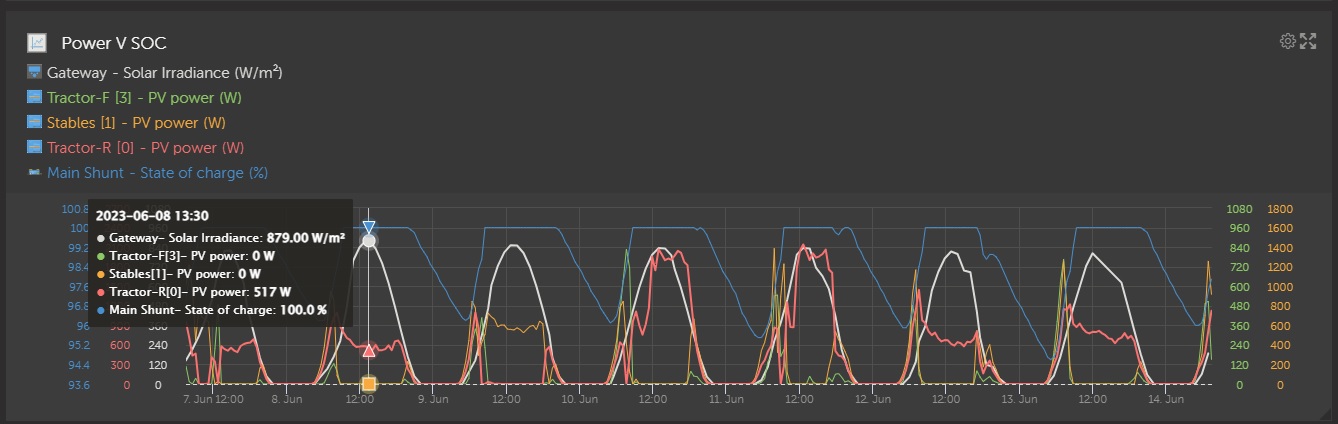
After scratching my head for a while, I was able to use the data from the custom widgets to identify an issue in what I expected from VRM. I always suspected the "System Battery Power" and "System DC System" power was incorrectly calculated. Because the GX device only performs math on one of the SmartShunt volage/current to get these numbers, VRM does the same thing (probably reports it directly from the GX calculation). Anyway, here are the 4 graphs that provide the data: 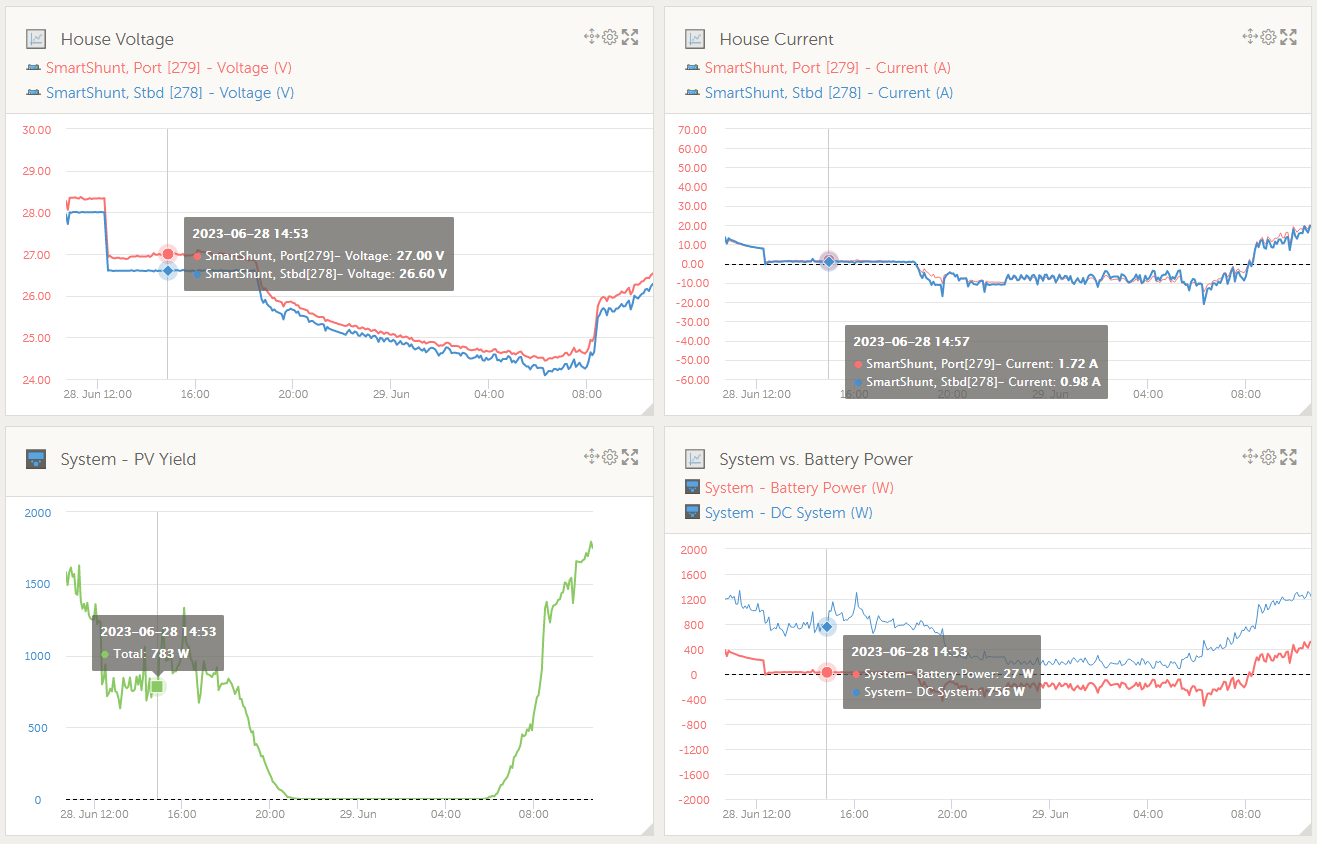
Using this data, I was able to calculate the actual current for each SmartShunt and calculate the actual system wattage: 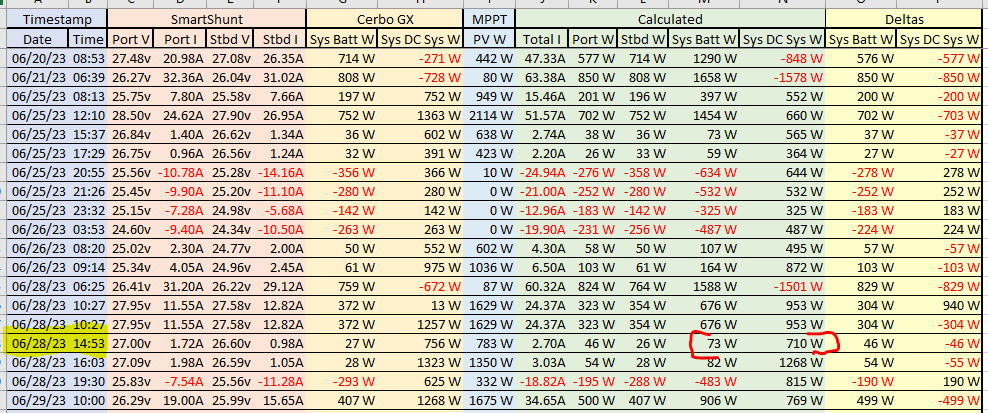
Off to figure out a RPI/Grafana custom solution...
Is the one shunt set as the system battery monitor? And the other for DC loads?
The DC bus voltage current can be different to the shunt as DC power from mppts etc can pass over without heading to the battery. i.e. direct to loads.
The system assumes one main battery and therefore one main voltage as standard users would have. Curious how you do have different voltages there. Are there two separate batteries? Customizing is the way if you are wanting to move outside of mainstream setups.
Voltage on the ve bus can vary as well depending on if the batteries are needing to be charged (higher potential on the dc bus is created) or grid feedback.
756w + 27w does equal 783w in the graphs? Time stamp on the top two is slightly out so not accurate for comaprison there.