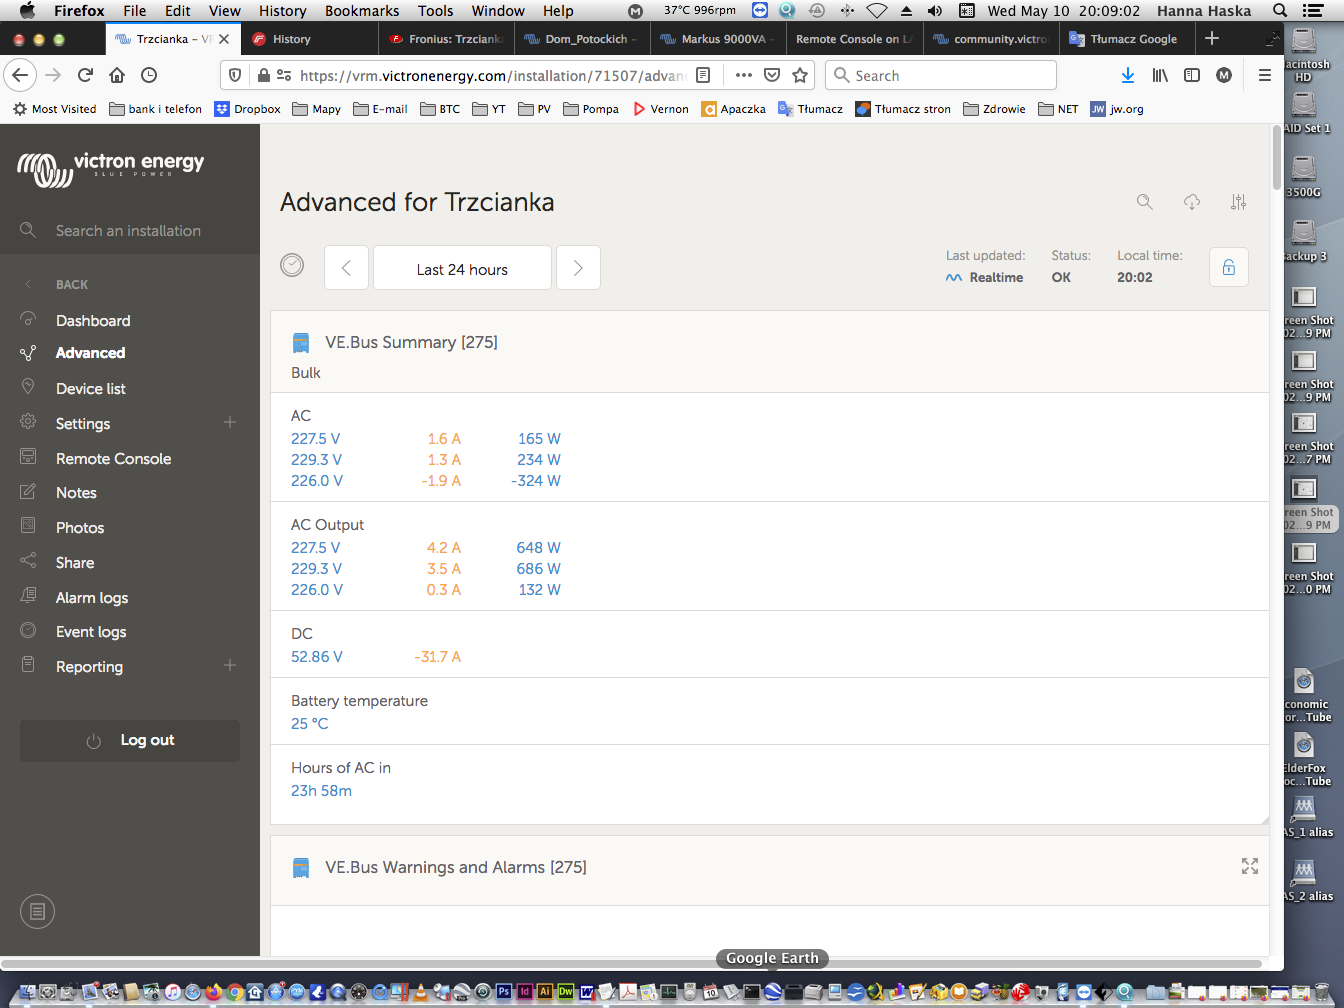
Just recently I noticed that in order to get current "historical data" graph I have to reload the VRM page.
Graph is not updating from the moment I turned my computer on at 9AM
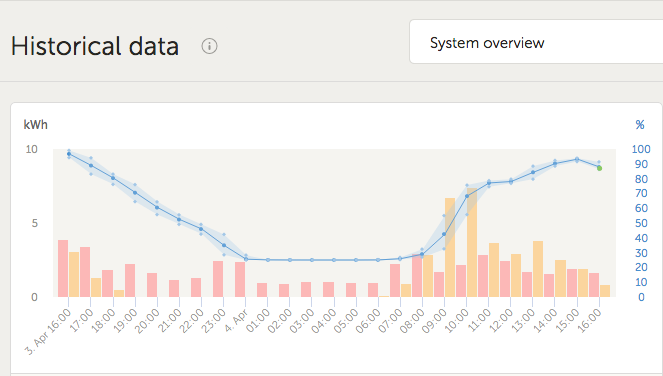
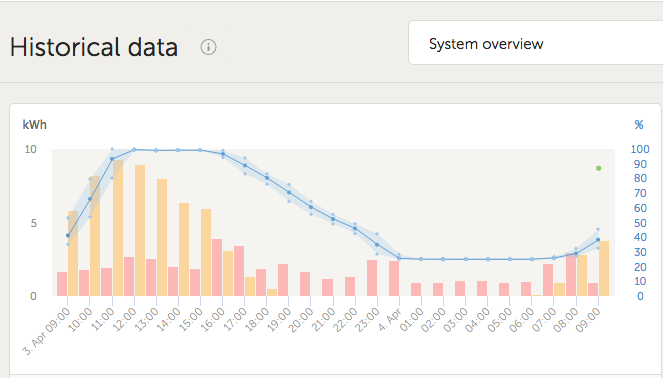 After reloading the VRM page at 16:30, I get it updated.
Every time I want to see the current data graph I have to reload the VRM page.
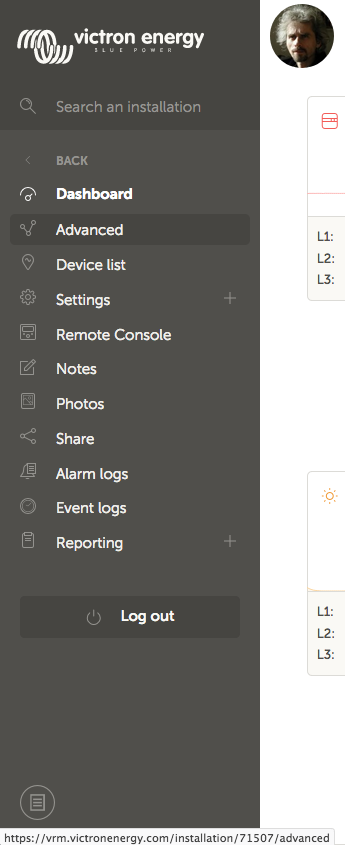
Also the left side bar is not working without reloading the page.
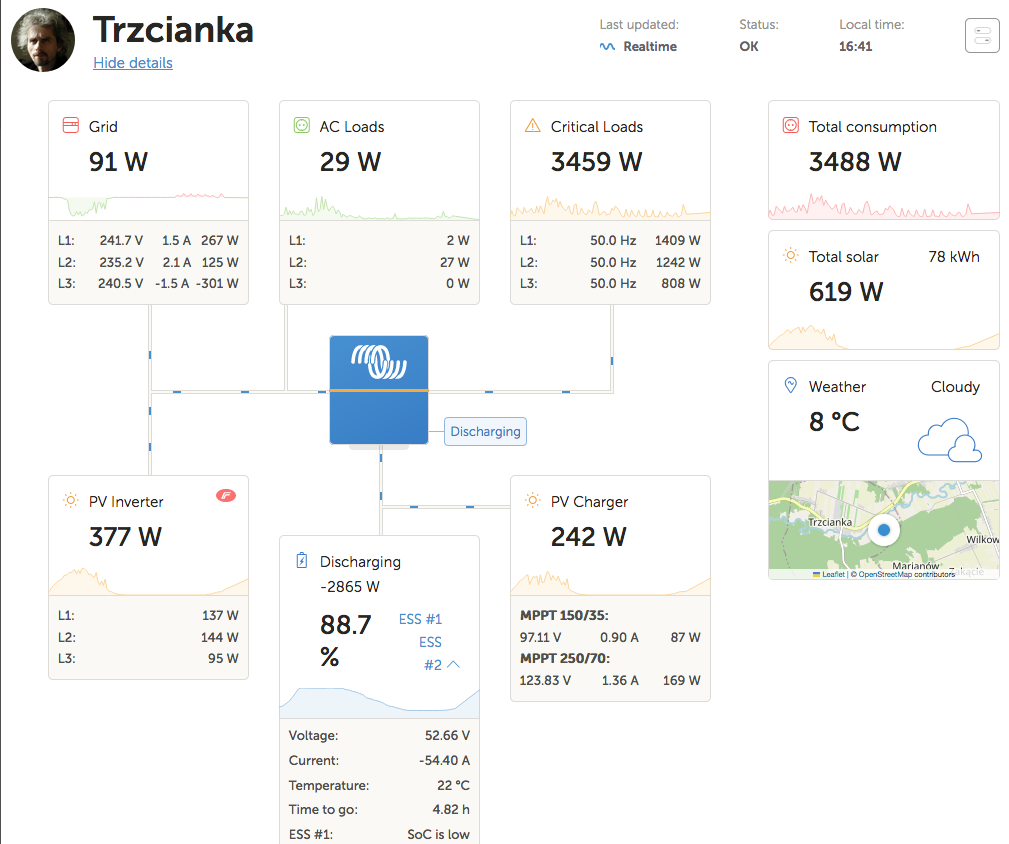
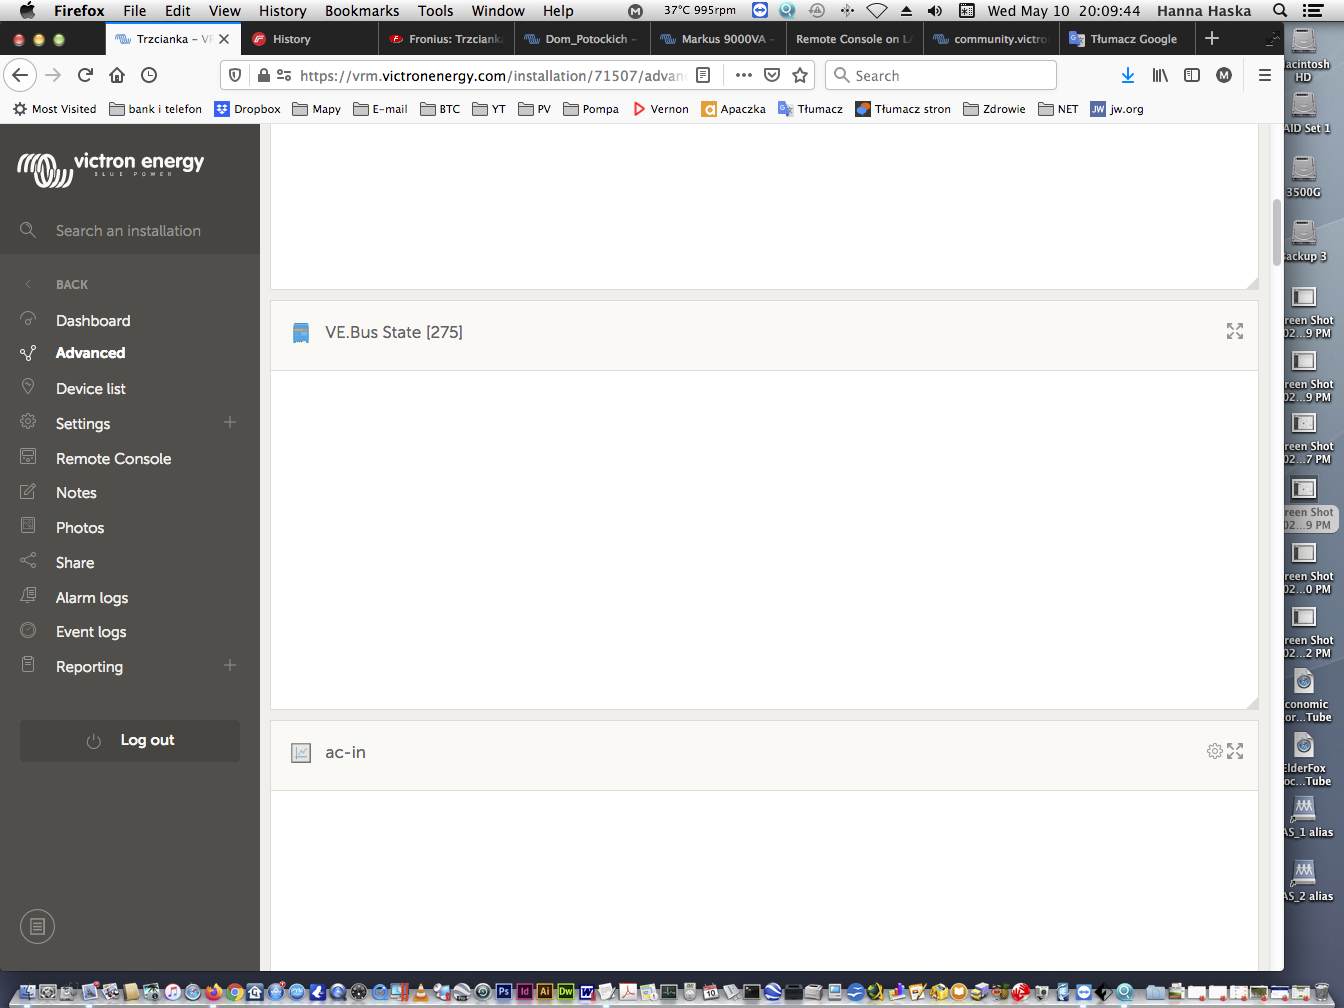
In order to see advanced page (or any other for that mater) I have to reload the VRM page. Without reloading nothing works.

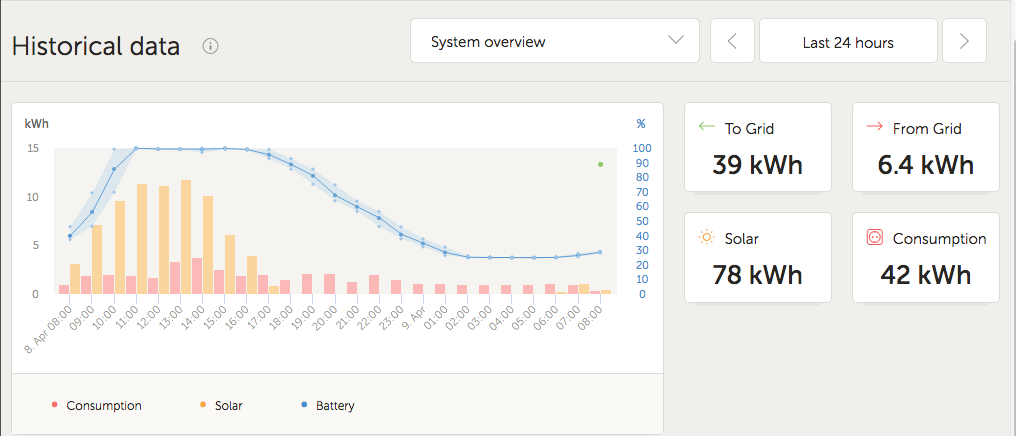
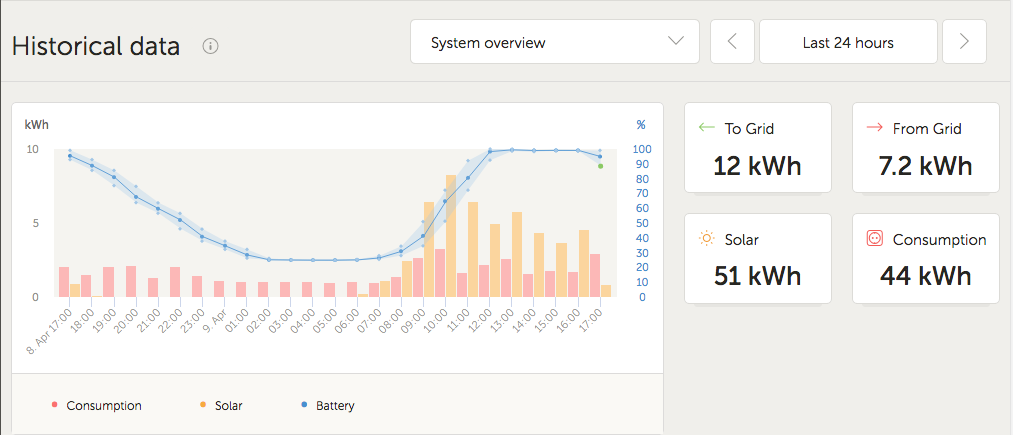
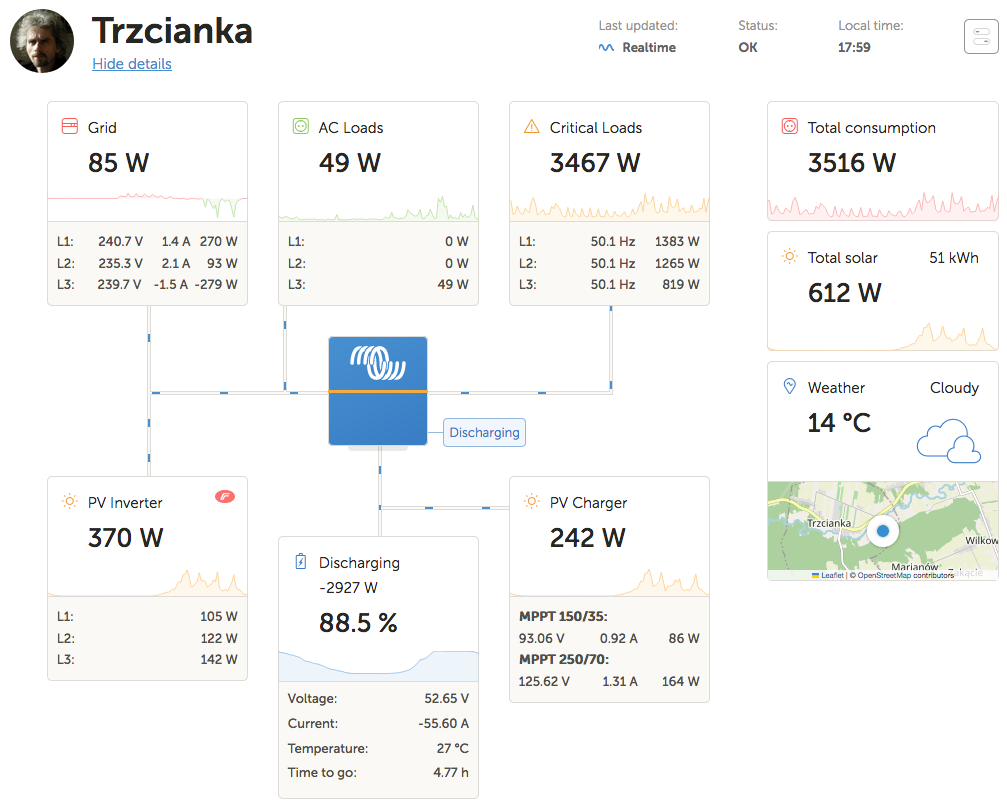
 After reload.
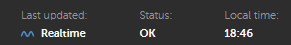
 Before reload.
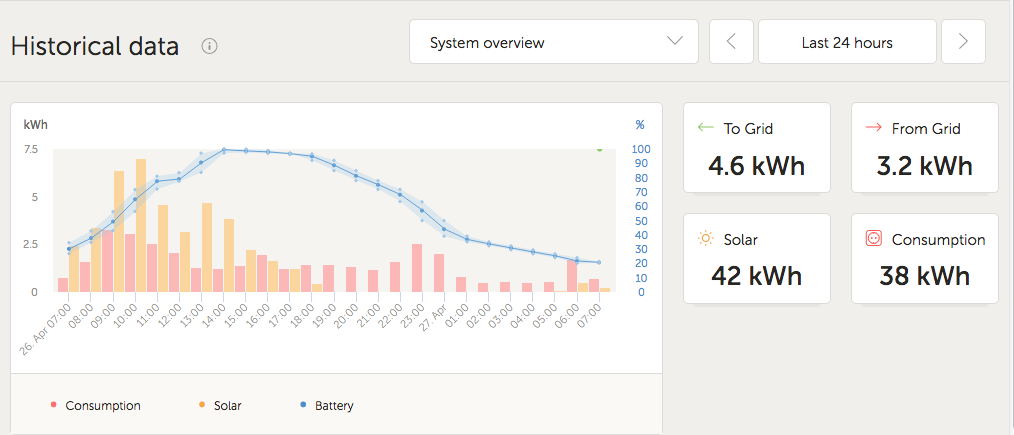 After reload.
 Current FireFox release.
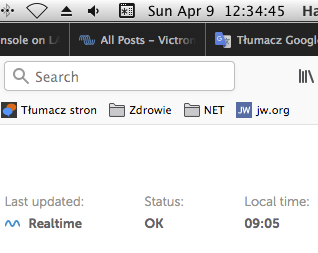
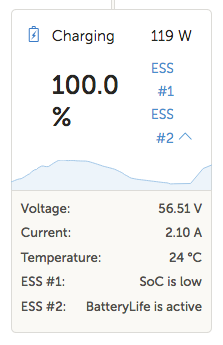
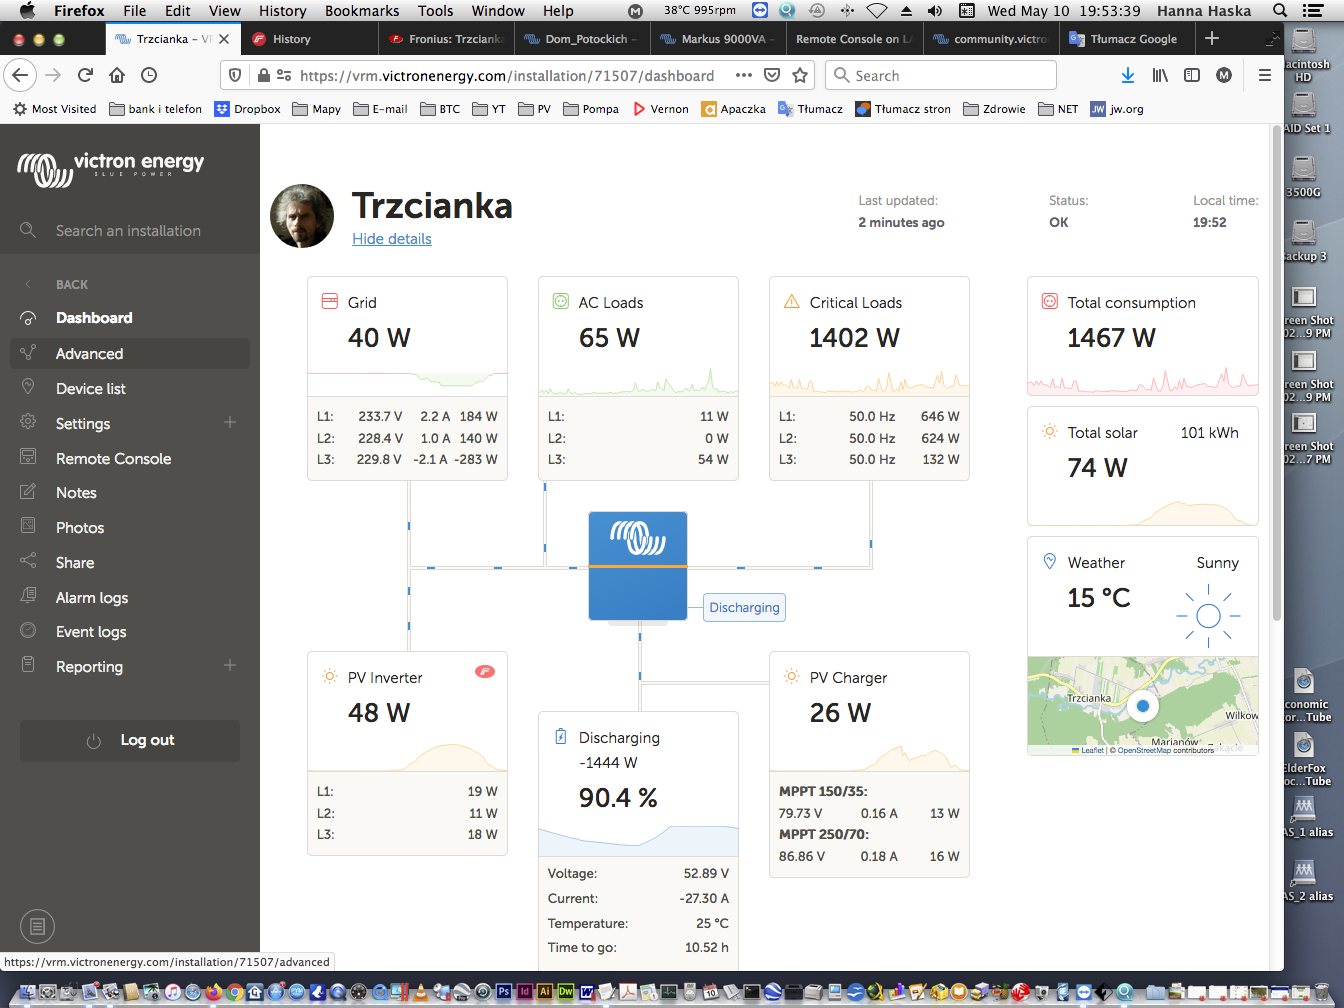 2. I am waiting and waiting and waiting and finally after around 8 minutes this screen appears:
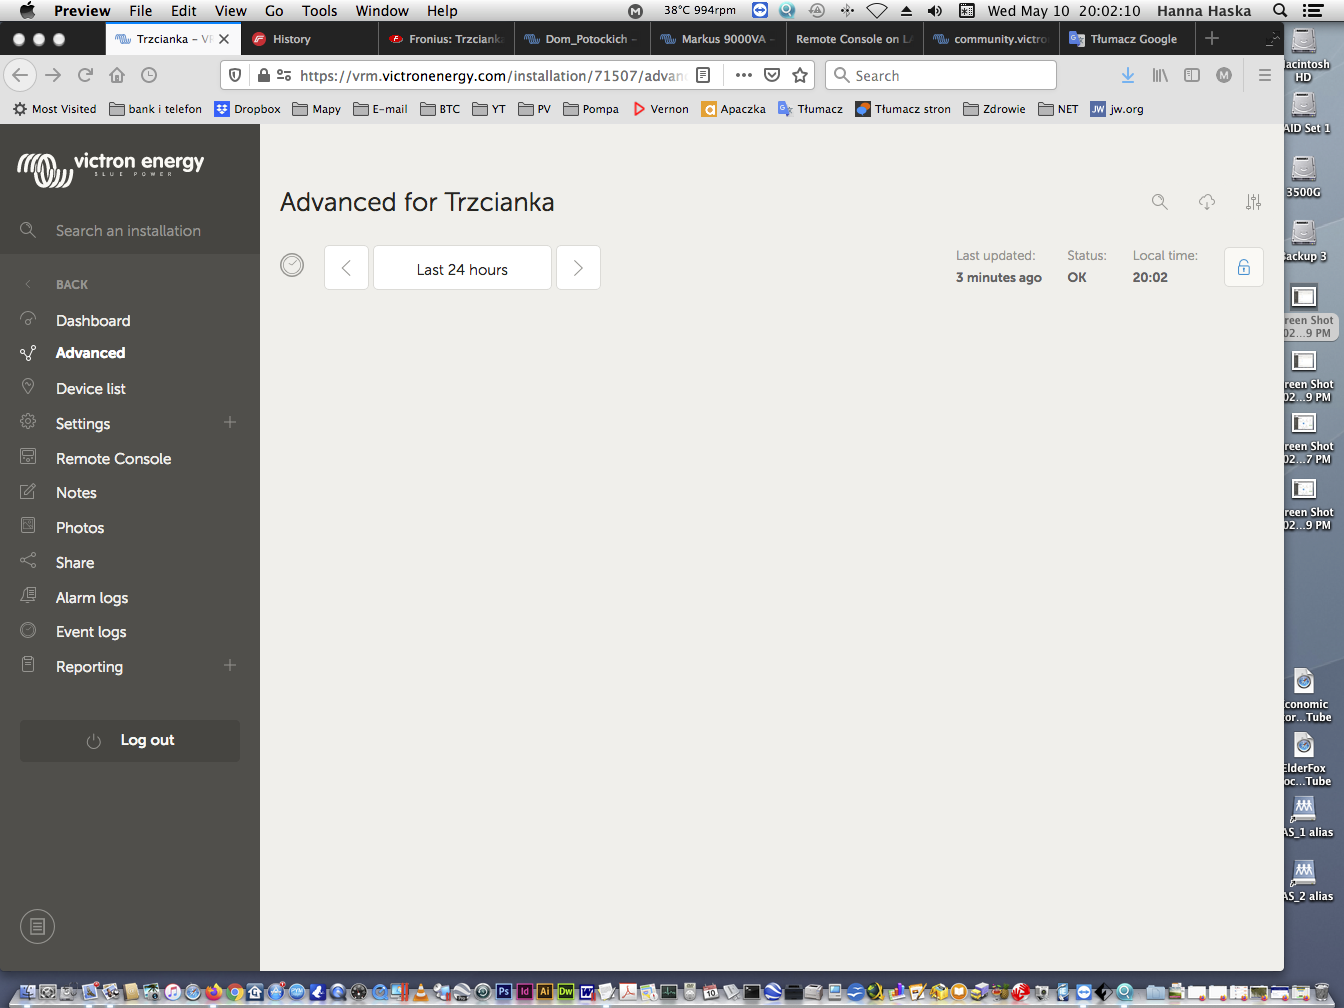
 ..I don't expect the graphs to be hours old. Page refresh necessary to get back to the old 5 min lag on the graphs (i can wear that), but even then I get what's described here..
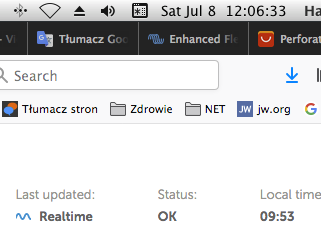
 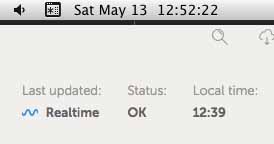 At the moment of this screen shot the difference was 13 minutes but I still see the local time at 12:39 but real time is 13:22 at the end of writing this post.