question

Guy Stewart (Victron Community Manager) avatar image

Custom Widget Beta Feedback

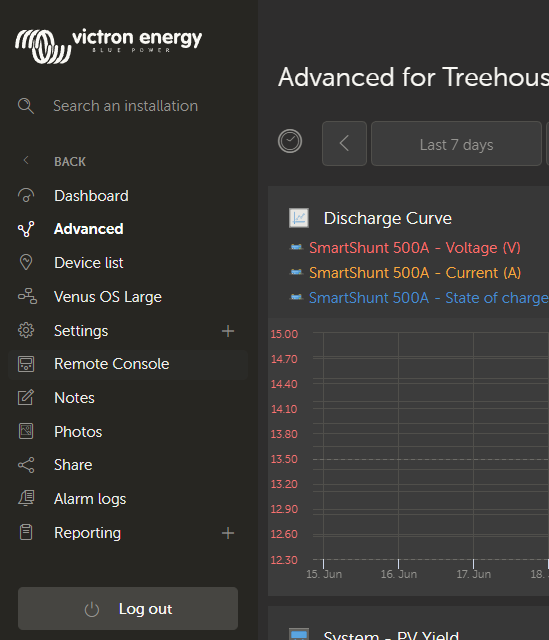
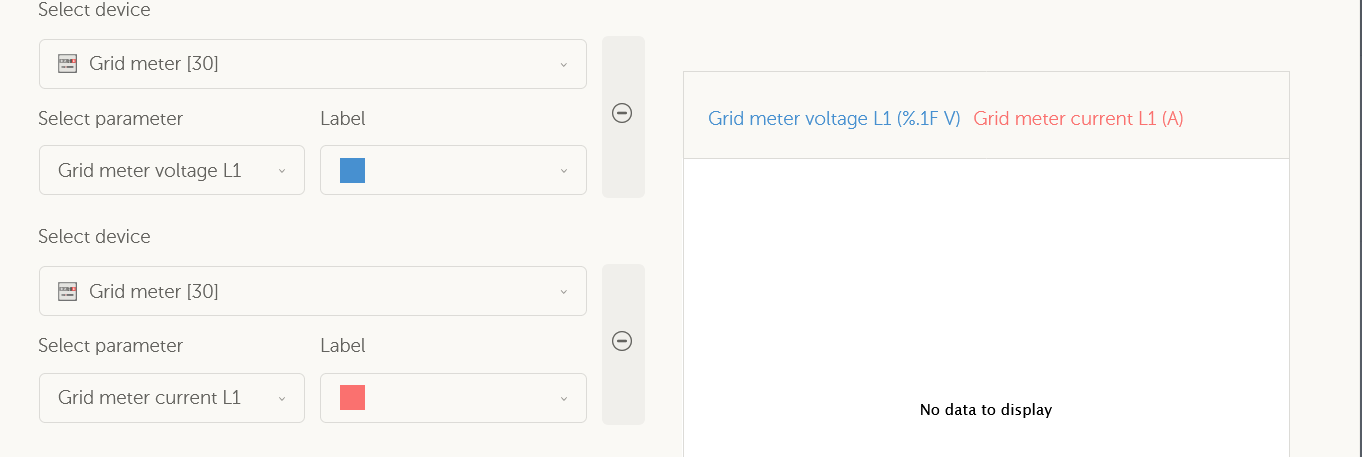
You can now add a customisable widget to the advanced page in your VRM.

While this feature is in BETA, we would like to hear your thoughts, and through your feedback improve it.

You can leave your comments below.
If this is your first time visiting Victron community, please create an account to make a comment.

Edited to add: Great suggestions, please keep them coming, I am taking them all to the team.

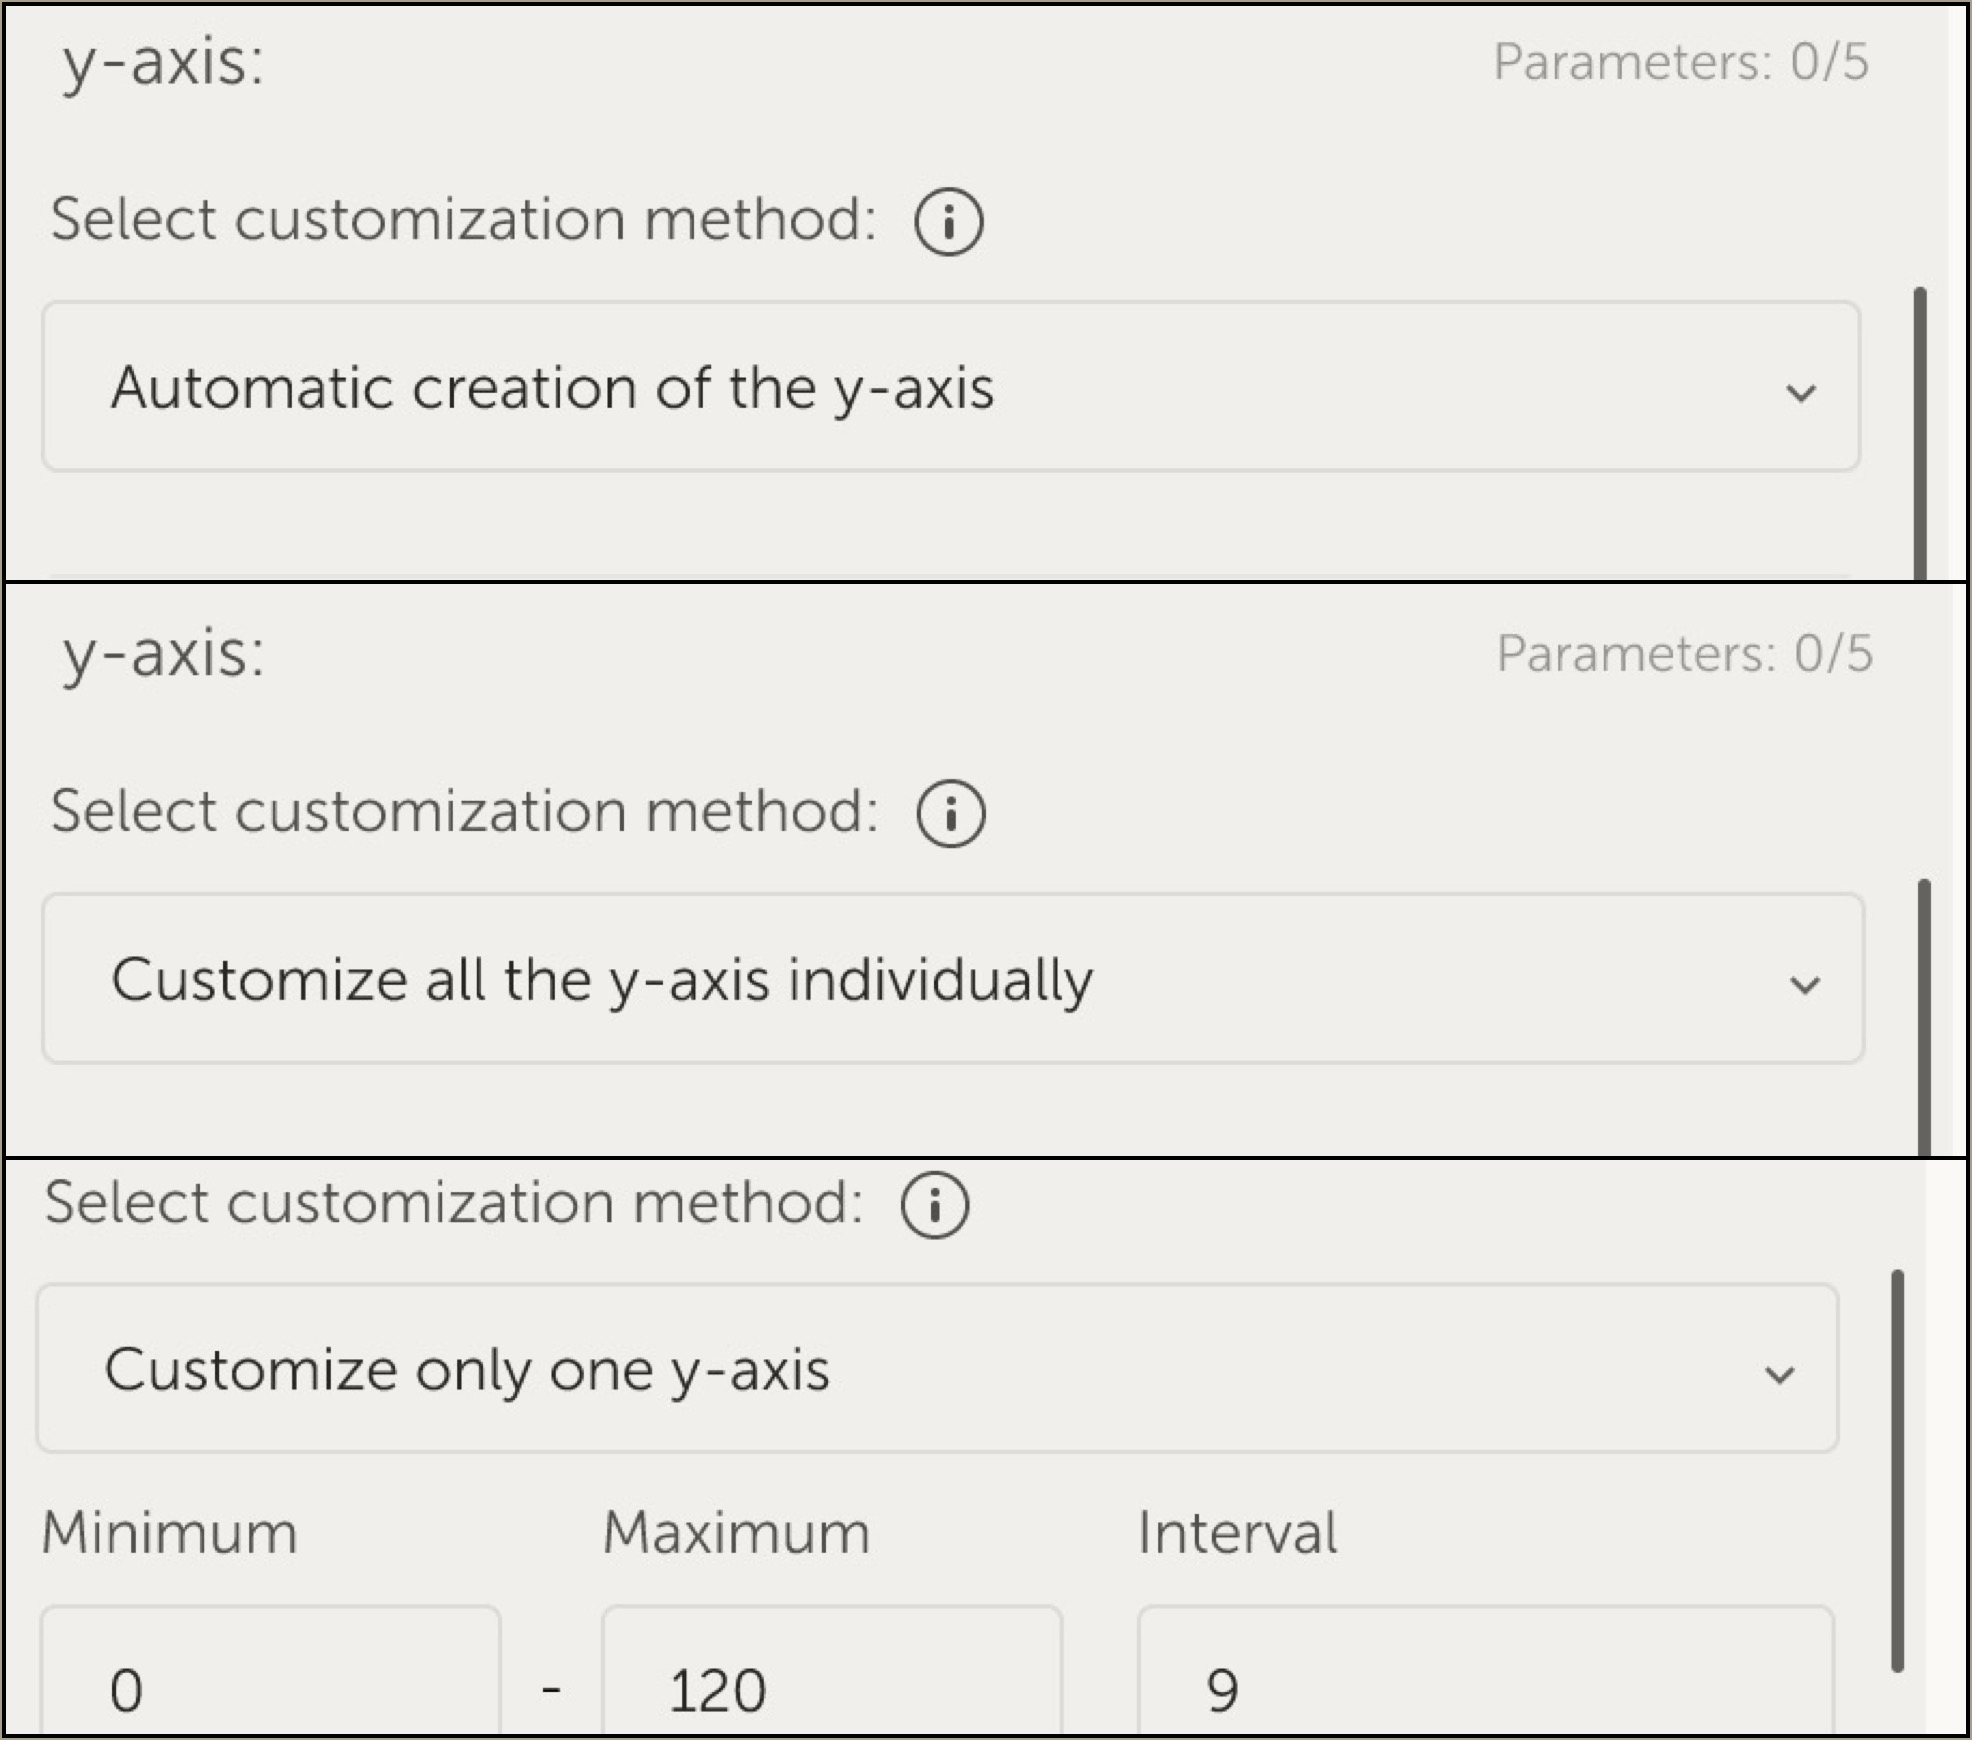
EDIT - NOW TESTING A BETA VERSION OF CUSTOM Y-AXIS - https://community.victronenergy.com/questions/168054/beta-test-update-to-vrm-custom-widgets-to-include.html

VRM
11 comments
2 |3000

Up to 8 attachments (including images) can be used with a maximum of 190.8 MiB each and 286.6 MiB total.

tedownes avatar image tedownes commented ·
Like many others say, a single y axis for measurments with common units would be amazing. Examples. Multiplus power in and out are both measured in watts so i want both on the same Y scale so i can easily visually compare them against each other. Two charge controllers could also be put on the same scale so it is obvious that one is making more power/current rather than having to look at vales on the y axis.


This new widget is great but not allowing the data on the graph to share a scale means it is no easier to compare data, its just becomes a space saving widget. Keep up the good work all.

2 Likes 2 ·
jason-manookian avatar image jason-manookian commented ·

So I've created a few custom widgets and I like that I can track a lot of different things. Currently I'm tracking the output or Current for each solar controller, but I would like to be able to track The combined Current output for both controllers. For example: Today at a peak of PV Watts I have a combined 64.9amps going to my batteries. See image below.


2022-04-12-12-54-45.jpg


it would be nice to see combined the charge current and add that to the System PV Yield Graph

1 Like 1 ·
rmorten avatar image rmorten jason-manookian commented ·
I didn't realize custom widgets were relatively new; I just installed my system in late June. I agree that one of the biggest holes is not being able to stack data.
0 Likes 0 ·
paulcupine avatar image paulcupine commented ·
Perhaps I am just missing it, but how does one edit a widget? Is the only way to delete and re-create?
0 Likes 0 ·
Guy Stewart (Victron Community Manager) avatar image Guy Stewart (Victron Community Manager) ♦♦ paulcupine commented ·
For now it is not possible to edit, but it is on the roadmap.
0 Likes 0 ·
Timo Engelmann avatar image Timo Engelmann Guy Stewart (Victron Community Manager) ♦♦ commented ·
This would be nice!


0 Likes 0 ·
Frank A. avatar image Frank A. commented ·

Voltage, current and frequency values do not seem to be imported in to VRM, (Voltage and current are available in the GX device). Any way to fix this?

1651651196826.png


0 Likes 0 ·
1651651196826.png (35.4 KiB)
Frank A. avatar image Frank A. Frank A. commented ·
Updating the Cerbo GX to fimware v2.85 made Voltage and Current data from the ET340 available in the VRM custom widget. Frequency data not yet available.
0 Likes 0 ·
rasch1966 avatar image rasch1966 commented ·

benutzerdefinierte Widgets sind eine tolle Sache - vielen Dank dafür!

Meine Wünsche:

  • Y-Achse Werte der einzelnen Kurven selbst bestimmen, bspw. bei mehreren Temperaturkurven wäre das sehr hilfreich, die Skalierung zu haben
  • Y-Achse: min. und max. Werte der Anzeige selber definieren

Sonstiges: für Relais-Funktion wäre eine Funktion Zeitschaltuhr eine tolle Sache, diese Fähigkeit dem CERBO zu programmieren.

Vielen Dank und bitte weiter so liebes Victron Team!


0 Likes 0 ·
squowse avatar image squowse commented ·

I can't create a widget for Inverter (Phoenix Smart 12/2000) DC current. The parameter is offered in the dropdown, (along with many other parameters that do not seem related to inverter eg battery voltage).

But no data is displayed and when the widget is saved, nothing is created.

1653494494957.png

0 Likes 0 ·
1653494494957.png (28.5 KiB)
ra-fa avatar image ra-fa commented ·

Me parece una herramienta genial los widgets personalizados. ¿Se podría hacer uno que muestre las temperaturas de los tres Quattros que de 15 kVAs que tengo en la instalación?

0 Likes 0 ·
40 Answers
Guy Stewart (Victron Community Manager) avatar image
Guy Stewart (Victron Community Manager) answered ·


Hi All,

A sneak peek of the custom y-axis selection - this is still at the design stage, so not possible to try yet, but it will be coming.

cleanshot-2022-04-26-at-222148.jpg


Thanks for all the feedback so far, it's all being taken on board. Lots of great suggestions that we will work to add over time.


2 comments
2 |3000

Up to 8 attachments (including images) can be used with a maximum of 190.8 MiB each and 286.6 MiB total.

marekp avatar image marekp commented ·
I keep my fingers crossed for this.
0 Likes 0 ·
yann avatar image yann commented ·
Great news !

I'm waiting for this since the first try :)

will it be possible to have the y axis coupled for multiple values, but still updating the min and max dynamically ? That would be great !


0 Likes 0 ·
nickdb avatar image
nickdb answered ·

Not all the metrics work yet, so testing is limited.

As on a previous thread I opened on the topic:

-inverter energy counters are cumulative and ignore the selected VRM display window.

-GX 'system' data mostly doesn't exist (i.e total system PV)

-Would be great to have a delete/edit option in the custom widget pane.

1 comment
2 |3000

Up to 8 attachments (including images) can be used with a maximum of 190.8 MiB each and 286.6 MiB total.

Ingo avatar image Ingo commented ·
I would like to second the GX 'system' data request by also including the relay(s) status in the custom widgets.
0 Likes 0 ·
netrange avatar image
netrange answered ·

eine kurze Anmerkung zu der Widgets
Ich kann im Moment keinen Koordinatenpunkt mehr "halten" ... also festsetzen um dann zu scrollen ...


a quick note about the widgets
At the moment I can no longer "hold" a coordinate point ... so fix it to scroll ...

2 |3000

Up to 8 attachments (including images) can be used with a maximum of 190.8 MiB each and 286.6 MiB total.

Al avatar image
Al answered ·

Yep, this is a really nice feature!

Someone mentioned before that the Ruuvi names aren't displayed, just 'temperature' hopefully this can be displayed though soon, as it's really hard to remember which colour is which!?

I would also +1 to the others mentioning some way to lock all metrics on the same y axis.

This is highlighted with temperature readings, my Ruuvi's all have their own scale, when they could just have the same:
screenshot-20220329-004732.png
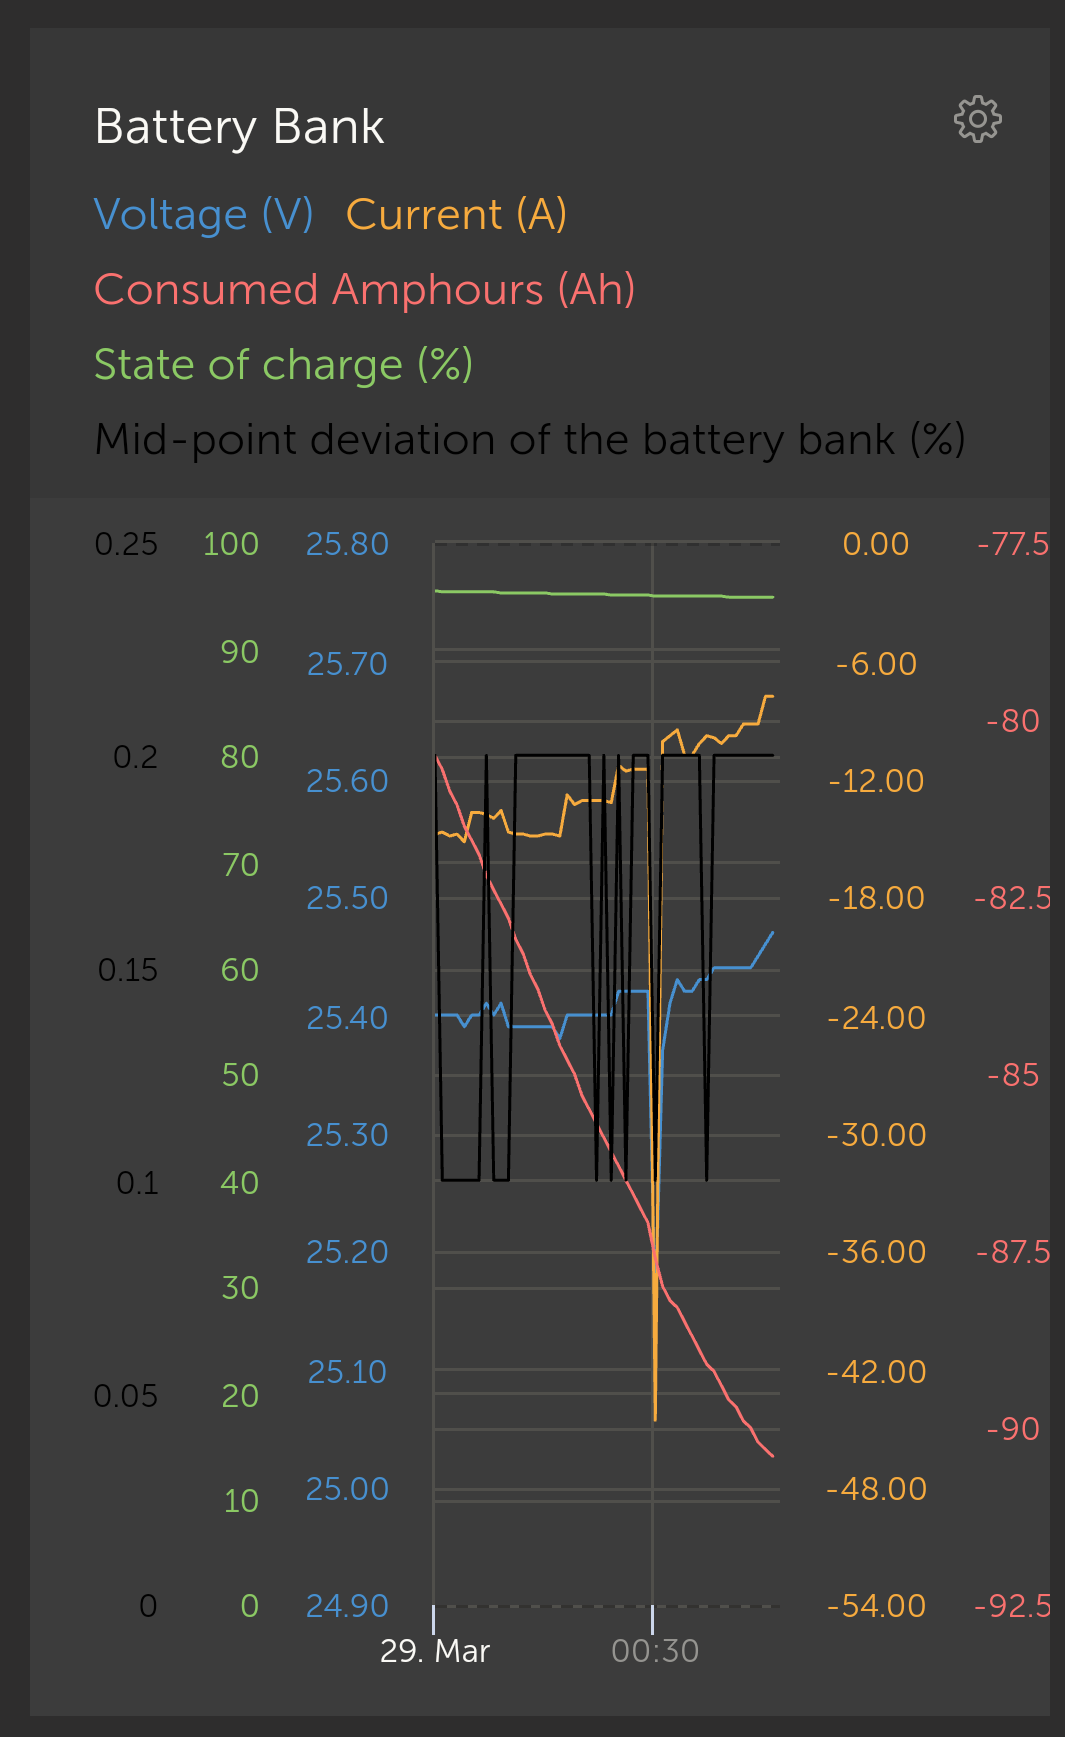
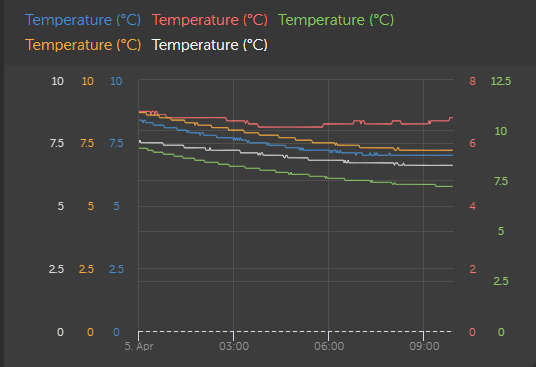
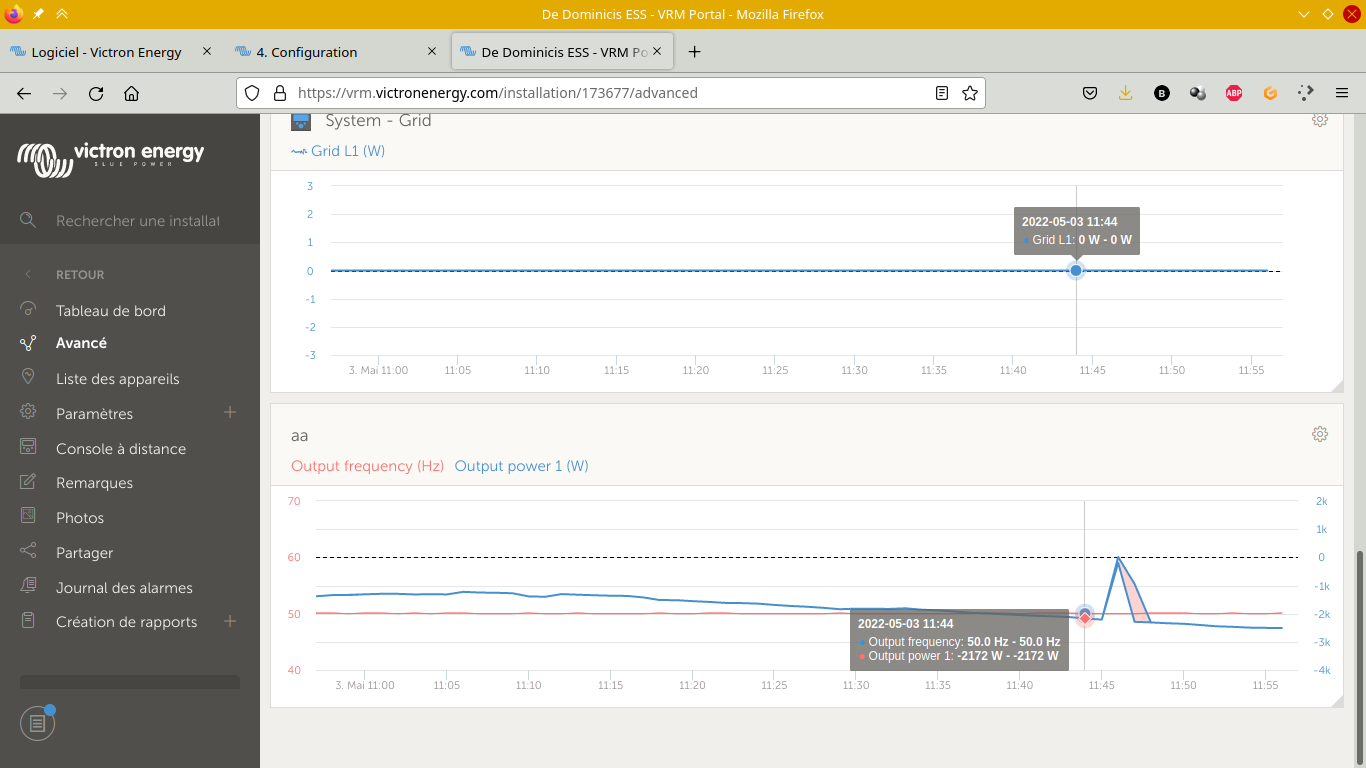
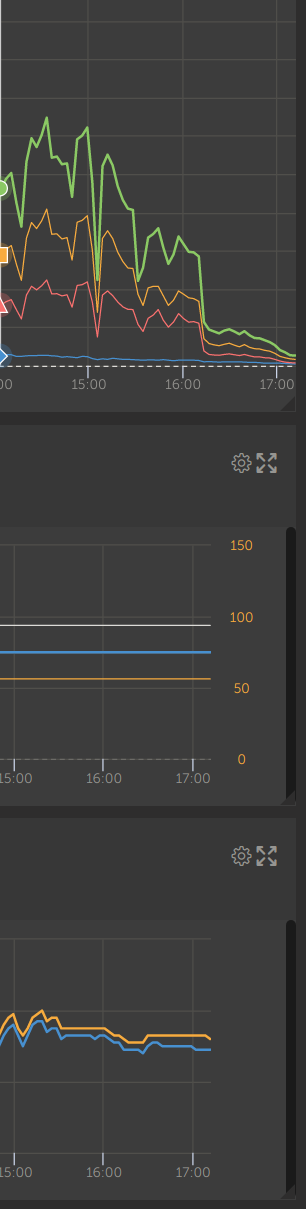
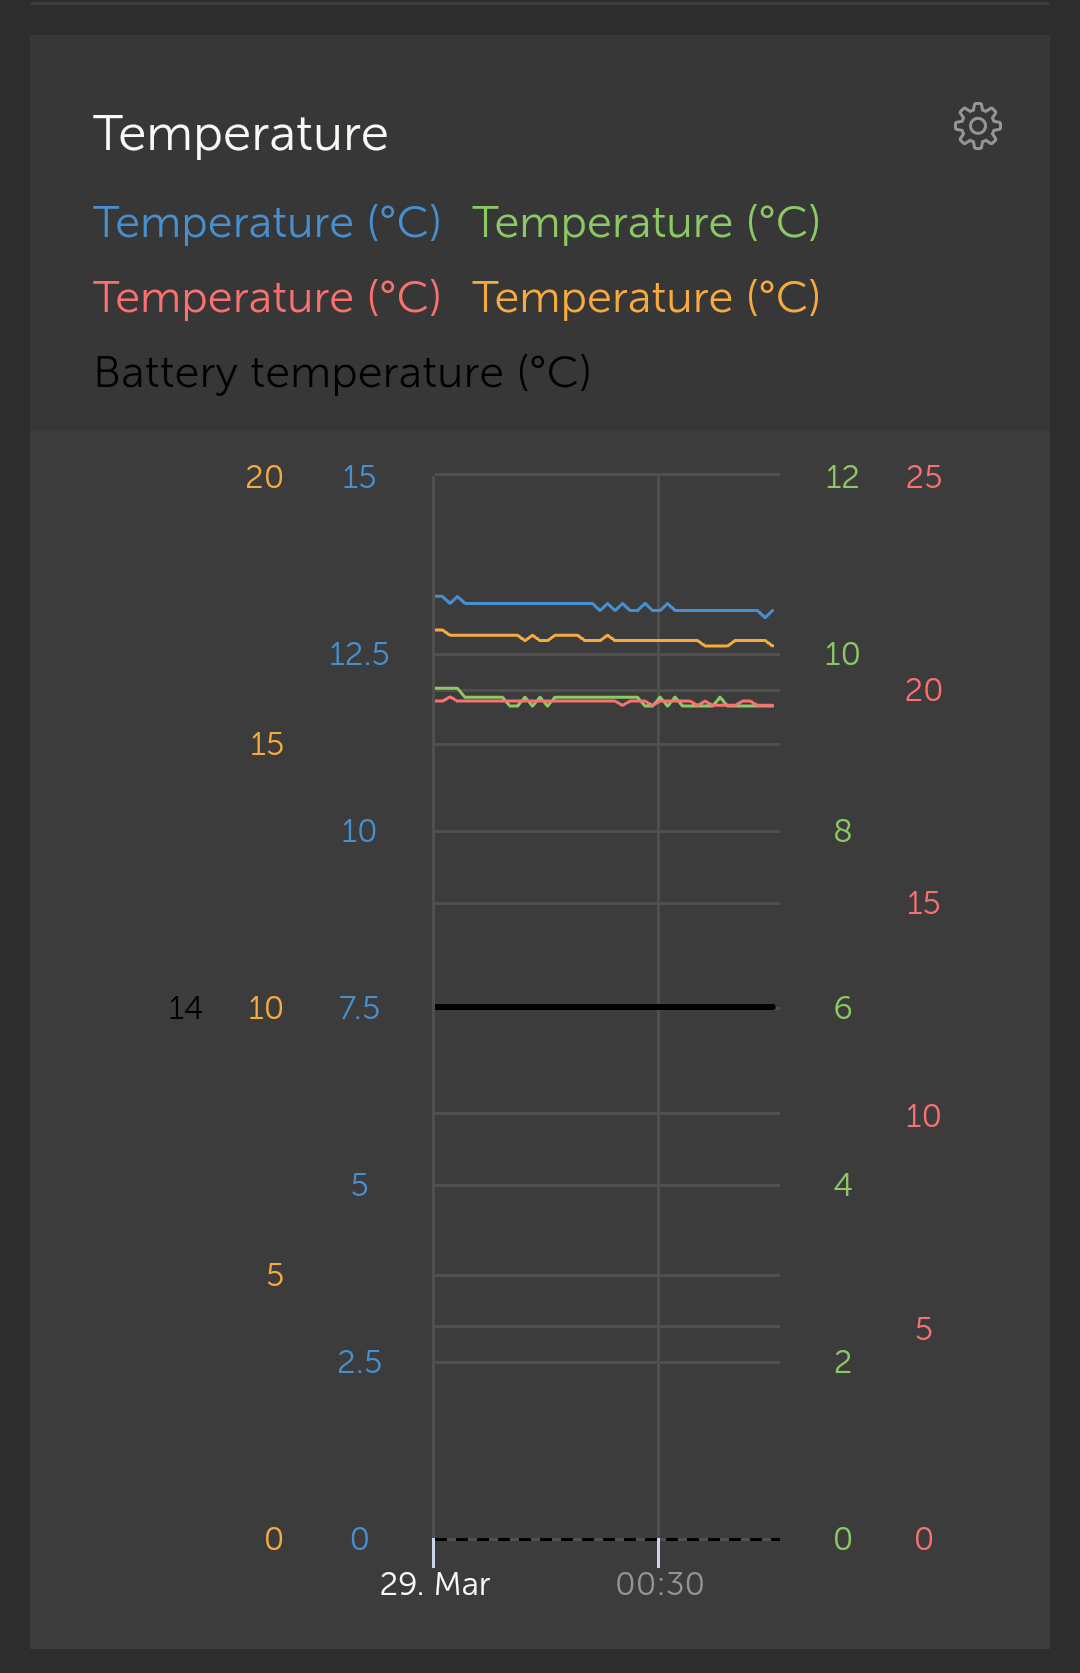
This also has the knock on affect of cramping the space for the data with wide margins for the different scales when viewing on a mobile.

Maybe the y axis scales can be refined somehow to take up less space for mobile view?

screenshot-20220329-004743.png

I can see I would definitely like to add more than 5 metrics to one graph if possible. I could imagine just having a few graphs in the future rather than scrolling through 10+ separate ones in VRM now. Oh and edit option of the graph would be nice too! Otherwise looking forward to it's progress.


1 comment
2 |3000

Up to 8 attachments (including images) can be used with a maximum of 190.8 MiB each and 286.6 MiB total.

matthias-roetzer avatar image matthias-roetzer commented ·
yes +1 on same y-axis for same unit metric, but should be selectable, so same or separate!


0 Likes 0 ·
Phil Gavin avatar image
Phil Gavin answered ·

Like alot.

Using a CG EM24 gridmeter.

The "Grid Total Energy" values don't seem to come through. I can get the values on a Node-RED dashboard, so they do exist.

1648651086956.png


1648651086956.png (18.9 KiB)
2 |3000

Up to 8 attachments (including images) can be used with a maximum of 190.8 MiB each and 286.6 MiB total.

andyn1968 avatar image
andyn1968 answered ·

Hi,

Very nice feature.

As Phil mentions; in general, would be nice with accumulated values (power ...) for three (multi) phase systems.

Thanks.

2 |3000

Up to 8 attachments (including images) can be used with a maximum of 190.8 MiB each and 286.6 MiB total.

vectra avatar image
vectra answered ·

Hallo,
+1 Being able to configure y axis scale

+1 Being able to configure y axis scale as auto or set fixed values.

2 |3000

Up to 8 attachments (including images) can be used with a maximum of 190.8 MiB each and 286.6 MiB total.

bilgebay avatar image
bilgebay answered ·

This is a fantastic tool, thank you! It would be great if we could assign values other then time to the (x) axis. For example, I would like to see voltage value on the y axis and SOC on the x axis. The graph below serves the same purpose but would love to have the ability to assign some other relevant values to the x axis. Thanks again!screen-shot-2022-04-01-at-123826-pm.png


2 |3000

Up to 8 attachments (including images) can be used with a maximum of 190.8 MiB each and 286.6 MiB total.

toby-mills avatar image
toby-mills answered ·

It would be great to be able to add provide my own labels for the series in the graph. For example in this graph 'AC Consumption on Input L1' is 'Non-Critical Loads' and 'AC Consumption on Output L1' is 'Critical Loads'

1649064265937.png


1649064265937.png (32.8 KiB)
2 |3000

Up to 8 attachments (including images) can be used with a maximum of 190.8 MiB each and 286.6 MiB total.

cinergi avatar image
cinergi answered ·

+1 on y-axis ... but not necessarily lock ALL of them to the same ... just a selection. Perhaps even specify my own min/max values for that group.

Would like to be able to do math on multiple values; or at least a "total" function so I can e.g. add L1 and L2 and create a Total graph.

Awesome stuff!

2 |3000

Up to 8 attachments (including images) can be used with a maximum of 190.8 MiB each and 286.6 MiB total.

itsme avatar image
itsme answered ·

Very nice feature! Thank you.

+1 Adding a custom text label for each device. -> otherwise it's hard to separate the infomation

1649145440108.png


1649145440108.png (18.2 KiB)
2 |3000

Up to 8 attachments (including images) can be used with a maximum of 190.8 MiB each and 286.6 MiB total.

nickdb avatar image
nickdb answered ·

Gateway stats still return nothing on any of the options.

2 |3000

Up to 8 attachments (including images) can be used with a maximum of 190.8 MiB each and 286.6 MiB total.

mjs avatar image
mjs answered ·

It would be nice to do math operations. Example I have multiple MPPTs and want to see the difference of generated power etc.

2 |3000

Up to 8 attachments (including images) can be used with a maximum of 190.8 MiB each and 286.6 MiB total.

volkerkuehne avatar image
volkerkuehne answered ·

it would be great to have the opportunity after create the widget also to make a change on it if necessary

2 |3000

Up to 8 attachments (including images) can be used with a maximum of 190.8 MiB each and 286.6 MiB total.

Patrick Wardell avatar image
Patrick Wardell answered ·

Really like it. Would like to be able to create my own lables and to be able to edit something I created.

2 |3000

Up to 8 attachments (including images) can be used with a maximum of 190.8 MiB each and 286.6 MiB total.

gone-sailing avatar image
gone-sailing answered ·

PV Current doesn’t appear to be working.

2 |3000

Up to 8 attachments (including images) can be used with a maximum of 190.8 MiB each and 286.6 MiB total.

luphi avatar image
luphi answered ·

Great job. What about directly entering DBUS path for y-axis?

2 |3000

Up to 8 attachments (including images) can be used with a maximum of 190.8 MiB each and 286.6 MiB total.

mrhappy avatar image
mrhappy answered ·

I absolutely love it. I have cleared out all the standard widgets and now only use two custom ones for exactly what I want. Fantastic! Only thing I come to think about that I would want to see added is an "edit" option in a already created widget.

1 comment
2 |3000

Up to 8 attachments (including images) can be used with a maximum of 190.8 MiB each and 286.6 MiB total.

holger-baer avatar image holger-baer commented ·
If a full edit functionality is too much, a simple renaming of an existing widget would be a first step.
0 Likes 0 ·
mmsi2022 avatar image
mmsi2022 answered ·

Being able to perform mathematics ops between variables would be great.

2 |3000

Up to 8 attachments (including images) can be used with a maximum of 190.8 MiB each and 286.6 MiB total.

maartenvt avatar image
maartenvt answered ·

Make it possible to add up 2 data to 1 total.

In my case I have a 3 kW Fronius inverter and a Victron MPPT with 1kW PV power.


1650980944942.png


I would like to see a graph with the total PV power. It should be available as this data is also shown in the main dashboard.

1650981173231.png


Now it seems only possible to combine the 2 pv yields separate in 1 graph.

For the graph with the 2 pv data separate: make it possible to scale the data the same, besides maximising them both to the graph height. Both could be interesting.


Also make it possible to adjust and change the graph. When you want to change it, you must delete it and make a new one


1650980944942.png (56.1 KiB)
1650981173231.png (6.3 KiB)
1 comment
2 |3000

Up to 8 attachments (including images) can be used with a maximum of 190.8 MiB each and 286.6 MiB total.

yann avatar image yann commented ·
hi

there is an existing widget for that, it is located at "system > PV Yield"

0 Likes 0 ·
iand avatar image
iand answered ·

My boat will have 3 separate MPPT controllers -- it would be useful to be able to plot the total power as well as individual ones.

2 |3000

Up to 8 attachments (including images) can be used with a maximum of 190.8 MiB each and 286.6 MiB total.

David avatar image
David answered ·

Custom labels would be great. I have three MPPT's and have put the PV Power for each into a widget - so I can compare the output - However as there are no custom labels, I cannot tell them apart.

2 comments
2 |3000

Up to 8 attachments (including images) can be used with a maximum of 190.8 MiB each and 286.6 MiB total.

David avatar image David commented ·

This is an example of three MPPT 150/35's.vrmcustomwidget.png

0 Likes 0 ·
vrmcustomwidget.png (60.4 KiB)
iand avatar image iand David commented ·
So can you display the total power for all 3 MPPTs or only individual ones?
0 Likes 0 ·
yann avatar image
yann answered ·

there seems to be a bug in the displayed values, and with the min/max display : look at this one, L1 power is in blue, frequency is in red. but the displayed value under the mouse cursor, colors are switched over, and in the graph itself, when there is a min/max zone for the blue curve (L1 power) the filling is red, witch is obviously wrong

screenshot-20220503-115757.png


2 |3000

Up to 8 attachments (including images) can be used with a maximum of 190.8 MiB each and 286.6 MiB total.

mariner62 avatar image
mariner62 answered ·

Great feature, thanks.
It would be nice to be able to customise the Y-Axis scale for each parameter displayed rather than auto-scaling from zero.

2 |3000

Up to 8 attachments (including images) can be used with a maximum of 190.8 MiB each and 286.6 MiB total.

e-cat avatar image
e-cat answered ·

Please add wattage and kilowatt to the fields thanks

2 |3000

Up to 8 attachments (including images) can be used with a maximum of 190.8 MiB each and 286.6 MiB total.

gregoryx avatar image
gregoryx answered ·

Much thanks for the new feature! Didn't know I needed this and now I do. Decreases my urge to go NodeRed / Grafana.

Needs / observations same as others' feedback:

  • labels per device
  • y scale configurable per devices
  • formulas (eventually)
2 |3000

Up to 8 attachments (including images) can be used with a maximum of 190.8 MiB each and 286.6 MiB total.

rspott avatar image
rspott answered ·

Please consider metrics math. AWS has an excellent primer on time series data here:
https://docs.aws.amazon.com/AmazonCloudWatch/latest/monitoring/using-metric-math.html

Examples would be things like addition of all solar chargers in a stacked graph like this example:
1653516668894.png
Basic arithmetic would be a GREAT starting point: + - * /
Simple statistics would also be a great thing to have.

Things we can get out of this:
Total solar output over a period of time series data.
Average usage etc over a period be it days or weeks or hours.


1653516668894.png (144.0 KiB)
2 |3000

Up to 8 attachments (including images) can be used with a maximum of 190.8 MiB each and 286.6 MiB total.

tilo avatar image
tilo answered ·

Add the possibility to compare values from different installations in VRM. For example the PV power or the output power of 5 similar installations who might be in a group. Like this it would be easier to see if one is somehow abnormal.

If one installation is behaving "strange", it would be nice to have an alert, for example if one value is more than 20% different from the same value in another installation (math function required).

2 |3000

Up to 8 attachments (including images) can be used with a maximum of 190.8 MiB each and 286.6 MiB total.

suavek avatar image
suavek answered ·

Optional single Y - axis would be great. You could use it to comparing voltages, currents, temperatures, etc. Now it's almost impossble to track. Lets have a look at the screenshot below and check, when the blue one has lower value, than the red one and whe they show the same temperature.

1654275972647.png


1654275972647.png (19.5 KiB)
2 |3000

Up to 8 attachments (including images) can be used with a maximum of 190.8 MiB each and 286.6 MiB total.

dansonamission avatar image
dansonamission answered ·

It would be good if we could edit the name of the parameter we have added to the graph. For example I have added 4 temperature probes to one graph, but they are all called temperature and we have no way of knowning which one is which without memorising the instance number on the end.

1 comment
2 |3000

Up to 8 attachments (including images) can be used with a maximum of 190.8 MiB each and 286.6 MiB total.

dansonamission avatar image dansonamission commented ·
also to add to this, allow us to set the graph axis scales. Again with the temperatures, they are using different scales, they're all different. We have 20-30c, 0-30c and 0-25c. At a glance it makes it hard to compare temperatures of different devices. Over the last 24 hours it looks like one is half of another, but actually they are within 1 degree of each other, but because of the scale if doesn't look like that.
1 Like 1 ·
stourajiciajtak avatar image
stourajiciajtak answered ·

The graph for consumption now shows only the individual phases L1, L2 and L3. Please add the option to display the total sum.

2 |3000

Up to 8 attachments (including images) can be used with a maximum of 190.8 MiB each and 286.6 MiB total.

olafd avatar image
olafd answered ·

Hello, after the last code change for ‘custom widgets’, some weeks ago, they show up, but no graphs.

Before that code change, the chart rendering was OK.


The recent code change on 2022-06-15 does the some for the Solar Charger PV Current and Voltage.


Could you please check the compatibility with older Browsers when you do code changes.

Often it’s only a small formating issue that e.g. blocks the rendering.

Many Thankx for that in advance.


Which of the recent code changes are working here with

Blisk (8.0.201.218 | ChromeBase: 61.0.3163):

# Ruuvi-Widgets with temperature, humidity and pressure chart.


Which are broken:

# The last Custom-Widget-Change

# The last Solar Charger PV Current and Voltage Change20220619-vrm-portal-missing-graphs-after-vrm-updat.png


1 comment
2 |3000

Up to 8 attachments (including images) can be used with a maximum of 190.8 MiB each and 286.6 MiB total.

olafd avatar image olafd commented ·

Oh that was fast - thanks very much for the coding - the ‘Solar Charger PV Current and Voltage’ is working again.

1 Like 1 ·
eappel avatar image
eappel answered ·

Would it be possible dock/hide the navigation menu on left?

1655814398122.png


1655814398122.png (47.8 KiB)
1 comment
2 |3000

Up to 8 attachments (including images) can be used with a maximum of 190.8 MiB each and 286.6 MiB total.

olafd avatar image olafd commented ·

That’s already possible. You have to make the BrowserWindow smaller and the navigation menu hides.

0 Likes 0 ·
pedaaa avatar image
pedaaa answered ·

i really, really miss "total power" in [W] for all devices. So L1+L2+L3 summed.

like:

- total power to/from grid (L1+L2+L3)

- total power PV-Inverter 1 (L1+L2+L3)

- total AC-consumption on Output (L1+L2+L3)

- total AC-consumption on Input (L1+L2+L3)

Or can i show this already somehow?


The only thing i can find like this, that is somehow satisfying is: System PV-Yield (which shows total PV-power)

1 comment
2 |3000

Up to 8 attachments (including images) can be used with a maximum of 190.8 MiB each and 286.6 MiB total.

marommel avatar image marommel commented ·
the same for me...
0 Likes 0 ·
rmorten avatar image
rmorten answered ·

Being able to configure the GX device so it understands which modules (particularly SmartShunts) are working in parallel would be very helpful. I am sure I am not alone but I have two parallel house battery banks with separate (and parallel) SmartShunts; one for each battery bank. Both the GX device and the VRM system device fail to add the SmartShunt current together for calculating wattage and current in most graphs.

2 |3000

Up to 8 attachments (including images) can be used with a maximum of 190.8 MiB each and 286.6 MiB total.

rmorten avatar image
rmorten answered ·

I think I might have seen something like this in another post so please forgive me if it is already being looked at. If I have two devices that work in parallel, I should be able to control how they appear in the Y axis rather then them automatically getting a secondary or alternate Y axis range, I would like to have the option of them being in the same range.

2 |3000

Up to 8 attachments (including images) can be used with a maximum of 190.8 MiB each and 286.6 MiB total.

Gian avatar image
Gian answered ·


I want to share custom IMT si-rs485tc-t-mb solar irradiance sensor widget, you can see the radiation curve and the cell temperature, in the original widget it only shows the cell temperature, not the graph. I hope that other users who have this sensor can also do it to have the complete information.

best regards

1665894911630.png


1665894911630.png (126.5 KiB)
2 |3000

Up to 8 attachments (including images) can be used with a maximum of 190.8 MiB each and 286.6 MiB total.

aplord avatar image
aplord answered ·

Deliver improvements in agile increments?

I am new to this thread and see that others have already made all of my suggestions over the past 6 months. Victron are some of the changes proving difficult? Might you be able to release some of the simple improvements quickly, whilst working longer on some of the more complicated ones? e.g:

  1. Custom labelling would seem like a relatively simple change which would give big usability benefit.
  2. Then aligned/common/custom Y axis
  3. Then calculations, stacking, etc
1 comment
2 |3000

Up to 8 attachments (including images) can be used with a maximum of 190.8 MiB each and 286.6 MiB total.

I know it’s a frustrating wait and we were SO CLOSE to deploying the improvements, but this is software development ;) and the changes broke another existing feature so it’s back to testing.


The VRM dev team is working really hard at the moment with a long list. We all thought this one would be well finished by now, and I’ll keep pushing for it to be a priority, but that is why it hasn’t yet been deployed.

1 Like 1 ·
Guy Stewart (Victron Community Manager) avatar image
Guy Stewart (Victron Community Manager) answered ·

Hi All,

The number one request;

We are now testing a beta release of custom y-axis for custom widgets - please help us test it here - https://community.victronenergy.com/questions/168054/beta-test-update-to-vrm-custom-widgets-to-include.html

Looking forward to good feedback so we can release :)

2 |3000

Up to 8 attachments (including images) can be used with a maximum of 190.8 MiB each and 286.6 MiB total.

steffen-graap avatar image
steffen-graap answered ·

It would be nice if the data area of the widgets were the same width. In this way, temporal relationships could be better recognized. Since the user-specific widgets do not have a right Y-scale, they are wider. With the standard widgets, this is solved uniformly. See photo.
widget.png


widget.png (37.3 KiB)
2 |3000

Up to 8 attachments (including images) can be used with a maximum of 190.8 MiB each and 286.6 MiB total.