article

Dirk-Jan Faber (Victron Energy) avatar image
Dirk-Jan Faber (Victron Energy) posted

Node-RED: Fetch forecasted solar yield

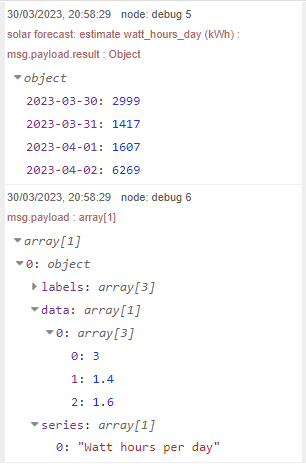
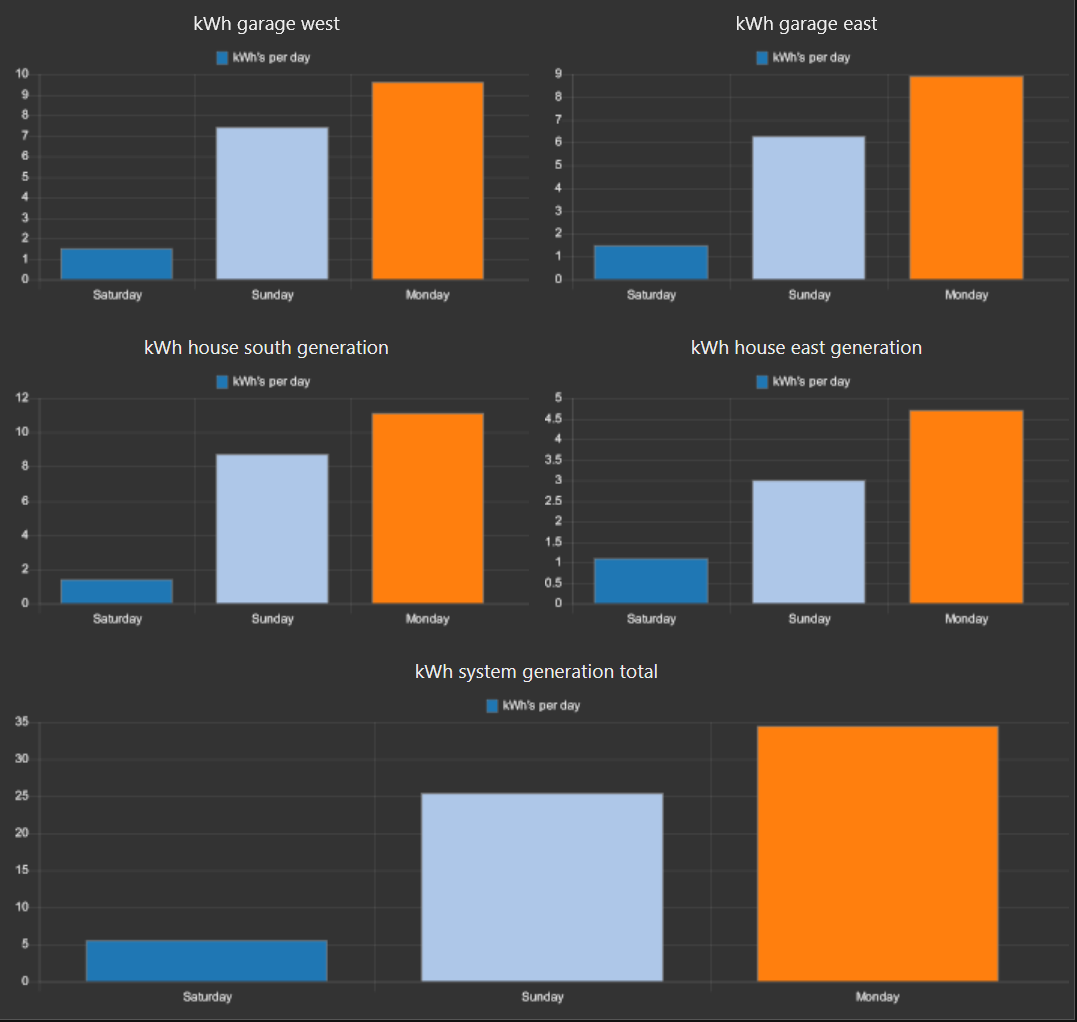
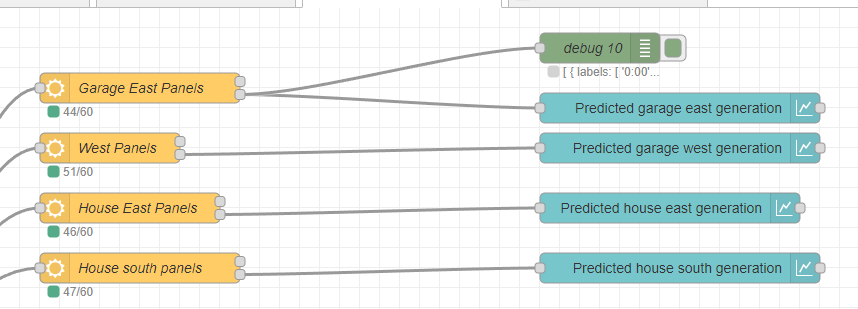
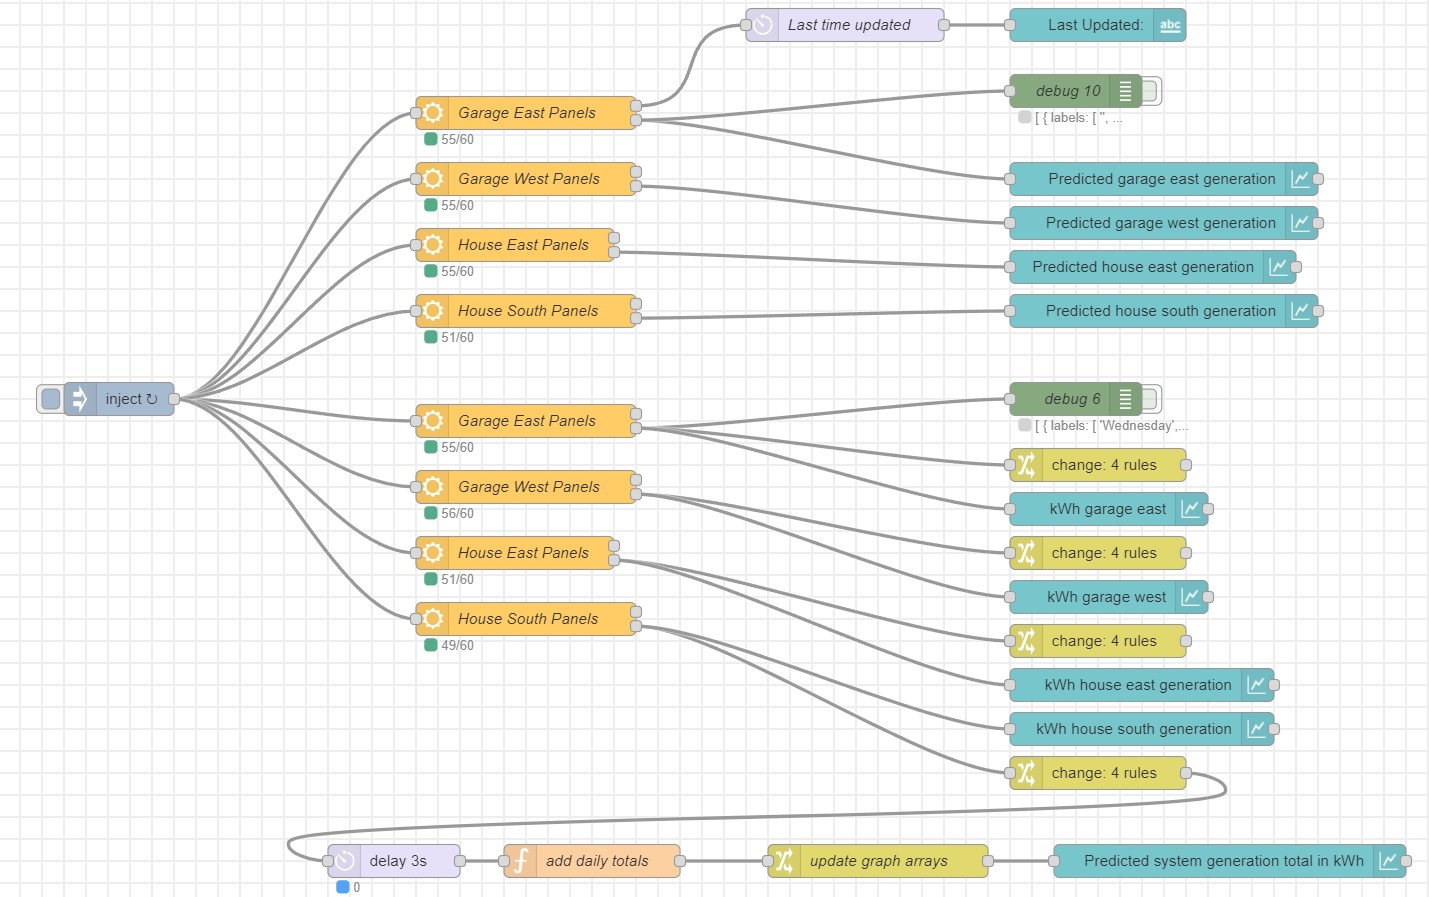
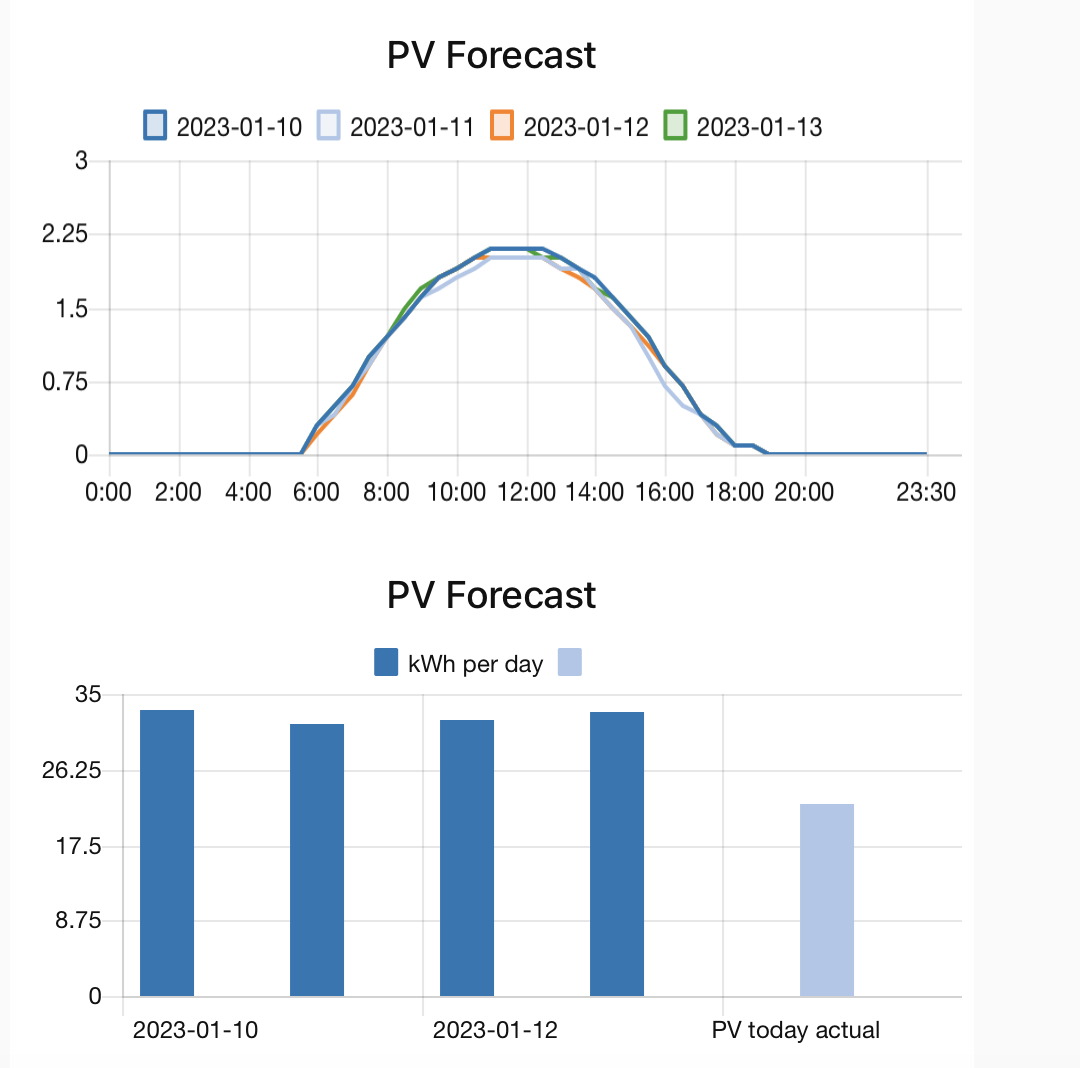
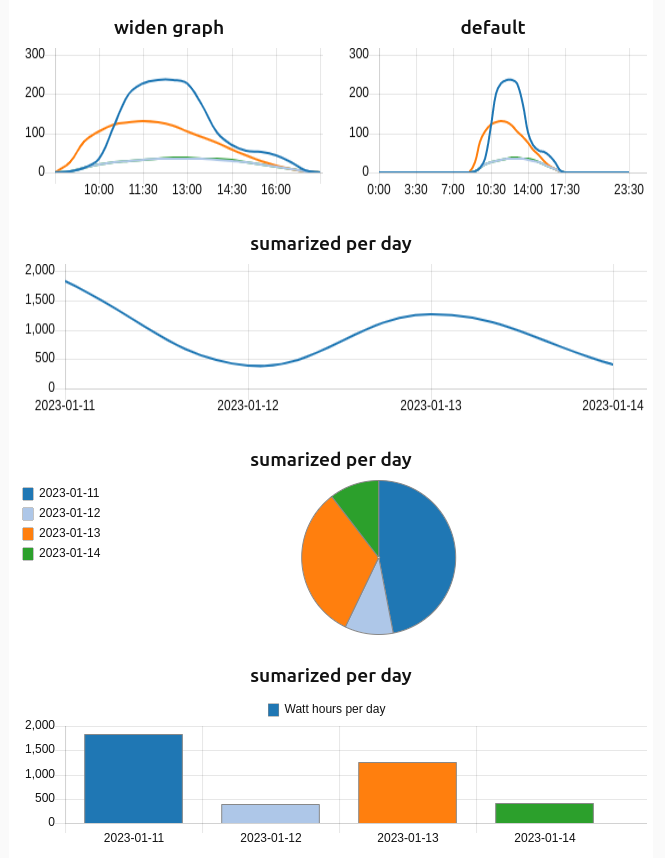
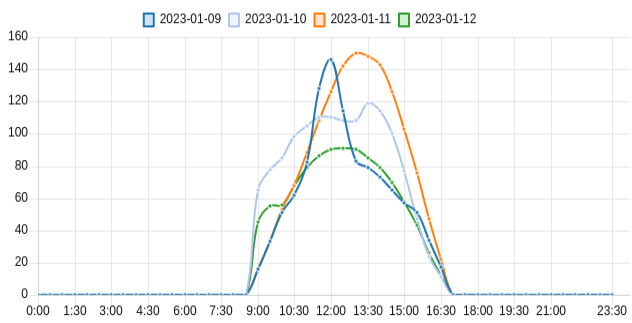
As briefly shown during todays webinar, I've created a simple subflow that allows to easily fetch the predicted solar yield for a given location. I believe that this subflow can be very useful for determining how and when to charge your batteries.

Under the hood it uses the public API of https://forecast.solar/. That is free for 12 queries per ip per hour, but if you start using it, please consider creating a personal account.forecast-solar.png
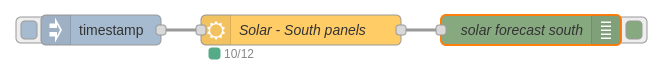
Configuration is straightforward:

forecast-solar-config.png

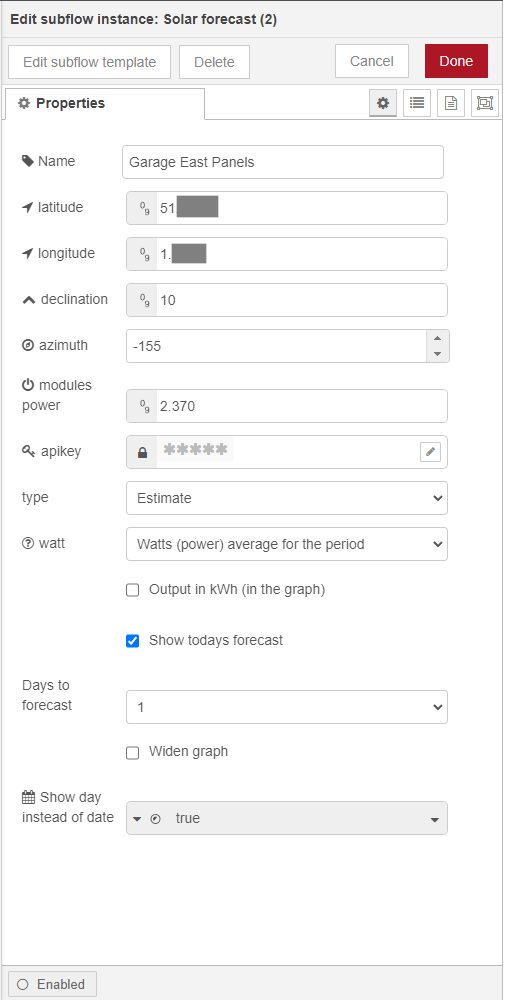
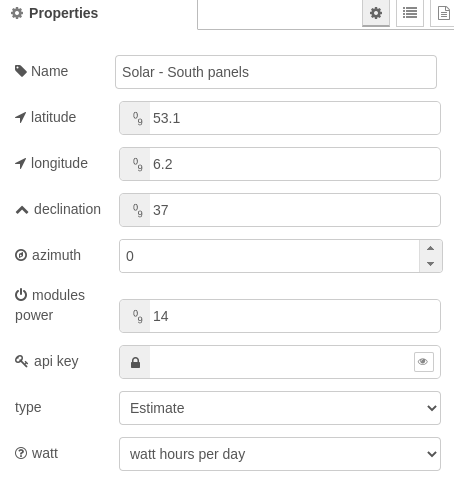
All fields are quite self explanatory and the documentation of the modules also gives more information on each field. The api key is not required, but with it you will be able to query more often.

My subflow can be found on https://flows.nodered.org/flow/d83d3224f241ec4abf6f9f119bbee9cc. In order to get the flow into Node-RED, copy the flow from the linked page and import it into Node-RED (ctrl-i).

Of course there are alternatives out there:

- https://flows.nodered.org/flow/a1907502b7256a0e4bcf408fbee93411 uses solcast for doing the same thing. But that one requires a bit more manual adjusting and a (also free) registered API account.

Node-REDsolar
59 comments
2 |3000

Up to 8 attachments (including images) can be used with a maximum of 190.8 MiB each and 286.6 MiB total.

Dirk-Jan Faber (Victron Energy) avatar image Dirk-Jan Faber (Victron Energy) ♦ commented ·

I have updated the flow with an example showing how to combine different solar arrays into a single graph.


1 Like 1 ·
Dirk-Jan Faber (Victron Energy) avatar image Dirk-Jan Faber (Victron Energy) ♦ commented ·

I've just updated the subflow to make it easy to generate a graph from it. All that is needed is to connect a line or bar chart to the second output of the subflow.
1673277033248.png

0 Likes 0 ·
1673277033248.png (38.8 KiB)
nickdb avatar image nickdb ♦♦ Dirk-Jan Faber (Victron Energy) ♦ commented ·

I’ve been using the original subflow for a while now, just parsing it with a function to extract the forecast in kWh to make it easier to use for my purposes. It has been surprisingly accurate.

0 Likes 0 ·
wkirby avatar image wkirby ♦♦ Dirk-Jan Faber (Victron Energy) ♦ commented ·

Thanks for this. It seems to work pretty well.
I experiment with is some more. I wonder how well it will work long term for UK, it's hard to tell what the weather will be for the next 5 minutes let alone the next day!

0 Likes 0 ·
nickdb avatar image nickdb ♦♦ Dirk-Jan Faber (Victron Energy) ♦ commented ·

@Dirk-Jan Faber If you use the watt hours summarised per day as primary output, then the secondary graph output produces "NaN"

screenshot-2023-01-10-at-061307.pngIt works fine if you use the hourly forecast.

(it would be great if it could output in kWh also) but I just edited your create graph output function and replaced the following line, which converts to kWh, rounded to 1 decimal.

m.data[m.series.length - 1][h*msg.resolution+offset] = Math.round(msg.payload.result[key]/100)/10;
0 Likes 0 ·
Dirk-Jan Faber (Victron Energy) avatar image Dirk-Jan Faber (Victron Energy) ♦ nickdb ♦♦ commented ·

Just updated the subflow. Apart from handling this error (by creating a specific graph for the watts hours sumarized per day) it also handles errors in general. And it adds a "kWh" output checkbox to the properties pane.

1 Like 1 ·
nickdb avatar image nickdb ♦♦ Dirk-Jan Faber (Victron Energy) ♦ commented ·

Excellent, thanks @Dirk-Jan Faber

1 Like 1 ·
ronski avatar image ronski Dirk-Jan Faber (Victron Energy) ♦ commented ·

When I have "kWh" selected the bar graph shows "Watt hours per day" when I hover over each day in the chart, it appears the message hasn't been updated to reflect kWh's.

1680206863862.png


I'm very new to Node Red, I have nodes fetching the forecast for four arrays, how can I add up each day for the four arrays. Basically I can't work out how to access the array data, the rest I know. Edit: Actually think I've worked this bit out.


0 Likes 0 ·
1680206863862.png (18.5 KiB)
ronski avatar image ronski ronski commented ·

@Dirk-Jan Faber As a suggestion can we have an option for the day name instead of the date, it makes the graphs much clearer.

I've altered the array for the bar graphs, but still need to do it for the line graphs.

I've also corrected watts per day which was incorrectly shown when kWh's was selected (see my previous comment).

1680344098729.png

0 Likes 0 ·
1680344098729.png (102.4 KiB)
Dirk-Jan Faber (Victron Energy) avatar image Dirk-Jan Faber (Victron Energy) ♦ ronski commented ·

Thanks for the suggestions. I've implemented them in the subflow and released version 0.0.8.

0 Likes 0 ·
ronski avatar image ronski Dirk-Jan Faber (Victron Energy) ♦ commented ·

Thanks, quick question, how do I update the node with out breaking things?

If I import the node again it imports a copy, I tried again with view nodes option but ended up in a right mess, and had to restore a backup of my flow.

I've currently got two Solar Forecast nodes, the old one and the new one.

0 Likes 0 ·
ronski avatar image ronski Dirk-Jan Faber (Victron Energy) ♦ commented ·

@Dirk-Jan Faber Did you update all outputs to display day name? As its working on the bar graphs, but not the line graphs. Thanks.

0 Likes 0 ·
Dirk-Jan Faber (Victron Energy) avatar image Dirk-Jan Faber (Victron Energy) ♦ ronski commented ·

It works on my test setup. What type and watt settings are you testing with?
1680523937873.png

0 Likes 0 ·
1680523937873.png (22.8 KiB)
nickdb avatar image nickdb ♦♦ Dirk-Jan Faber (Victron Energy) ♦ commented ·

It is working fine. Error I made was to enter the panel output in Watts, instead of kW as is intended.

1 Like 1 ·
ronski avatar image ronski Dirk-Jan Faber (Victron Energy) ♦ commented ·

Thank you for the reply, here's what I have

1680540337402.png

The four below do the line graphs, I've only updated the top one to use the new node.

1680540019848.png

As you can see, it still shows the dates.

1680540050522.png

The bar graphs which use "Watt hours (energy) summarized for each day" and set to output in kWh does indeed show days.


Changing the line graph to "Watt hours (energy) summarized for each day" does display day names.

"Watt hours (energy) summarised over the day" displays dates.

"Watt hours (energy) for the period" displays dates.

Changing to kWh doesn't make a difference.


0 Likes 0 ·
1680540019848.png (40.8 KiB)
1680540050522.png (40.6 KiB)
1680540337402.png (45.0 KiB)
Dirk-Jan Faber (Victron Energy) avatar image Dirk-Jan Faber (Victron Energy) ♦ ronski commented ·

I had overlooked that the date also can end up in the legend. I've released version 0.0.9 that fixes that.

0 Likes 0 ·
ronski avatar image ronski Dirk-Jan Faber (Victron Energy) ♦ commented ·

Thank you, I can confirm that works.

However I have noticed another small issue, it always displays 4 days including today, it does this in the previous version as well (I didn't realise until just now), it didn't in the prior version to that.

If I uncheck "Show today's forecast", then it will display three days, regardless of the amount of days set.


0 Likes 0 ·
Dirk-Jan Faber (Victron Energy) avatar image Dirk-Jan Faber (Victron Energy) ♦ ronski commented ·

And yet another version, fixing that too.

1 Like 1 ·
Show more comments
gnagflow avatar image gnagflow ronski commented ·

Hello, i am just trying since some hours how to summurise multiple pv forecasts as you show it in your graph, e.g. PV panels east, panels south, panels west ... to make one graph for the total production.

Could you share your flow or give some advice.

thank you!


0 Likes 0 ·
ronski avatar image ronski gnagflow commented ·

I'm at work at the moment, will upload the flow tonight.

1 Like 1 ·
ronski avatar image ronski gnagflow commented ·

Here you go, may be not the best way, but it works for me.


solarforecastflow.jpg

SolarForecast.zip

0 Likes 0 ·
gnagflow avatar image gnagflow ronski commented ·

Very nice, thank you very much.

1 Like 1 ·
johnone avatar image johnone commented ·

Thanks for sharing this - obvs, forecasting is an important part of optimising self-consumption. First thing for me is exploring accuracy - yesterday's forecast accurately predicted the likely low yield today, given unrelenting rain (UK Midlands).

I have a 1770Wp free-standing, facing due south, array - will write a bit of python to collect the day's forecast at 1am (when E7 cheap rate starts) and, that evening, compare with the actual yield for the day. Will report back in a week.

Edit: sorry, should have said, going to use Solcast data as the forecasts are based on location, declination, azimuth/orientation AND weather (essential for the UK!). It seems the 'forecast solar' data is only based on location, declination, azimuth/orientation??

0 Likes 0 ·
nickdb avatar image nickdb ♦♦ johnone commented ·

It takes weather into account, there is a separate estimate they provide called "clear sky" which gives the theoretical maximum.

From their site:

Restful API for Solar production forecast data and Weather forecast data

0 Likes 0 ·
Dirk-Jan Faber (Victron Energy) avatar image Dirk-Jan Faber (Victron Energy) ♦ johnone commented ·

According to https://forecast.solar/ : "The always weather based solar production forecast, historic averages and clear sky optimum provides watt powers and kilo watt energy data."

So that means that the weather is taken into account. Note that neither I or Victron have any affiliation with them. I just made the flow to use their api.

0 Likes 0 ·
johnone avatar image johnone Dirk-Jan Faber (Victron Energy) ♦ commented ·

Thanks @Dirk-Jan Faber, it seems a little ambiguous to me. On the page you've linked to it says: "the current weather is thus not included in the calculation" (not is their bold). This is a critical issue for the UK. I think the bit @nickdb has very helpfully underlined refers to the option of subscribing to current weather data, in the 'Professional' package.

I'm not sure - is the 'forecast solar' data based on historic weather or current weather?

0 Likes 0 ·
nickdb avatar image nickdb ♦♦ johnone commented ·

It definitely takes weather into account. I have been using this for some time on the public API and the forecasts have varied appropriately with weather, and not been too far off (considering we have lousy weather forecasts here).

I recently updated to the private plan for more calls mainly, where I noticed the clear sky option.

The pro plan gives detailed data about the actual weather but if you read their splurb below:

Solar production

(All plans)

The always weather based solar production forecast, historic averages and clear sky optimum provides watt powers and kilo watt energy data.

0 Likes 0 ·
johnone avatar image johnone nickdb ♦♦ commented ·

I emailed them for a definitive answer - it's not clear if the yield forecasts are based on historic weather data (which, here in the UK, is less useful given climate change) or if they are based on actual weather forecasts: i.e. 'awlays weather based' could mean based on historic data.

0 Likes 0 ·
johnone avatar image johnone johnone commented ·

Reply from forecast solar ...

Hi,

there are 2 parts used

- Historic data as the base for calculation

- Actual weather forecast for the location (with a possible offset because there are not so many stations around), here the cloud coverage factor and the temperature forecasts, the cloud coverage is the most important, the temperature is only relevant in hot summers when the modules can have > 70 °C which lowers the performance.

Regards

Knut

0 Likes 0 ·
nickdb avatar image nickdb ♦♦ johnone commented ·

They seem to tap into wunderground. Fortunately we have no shortage of weather stations.

You'd think historic would be perfect for the UK - damp and dark every day ;)

0 Likes 0 ·
johnone avatar image johnone nickdb ♦♦ commented ·

Some days it's dark then damp. I too signed up to private for more calls - python requests and json proving a bit fiddly ...

0 Likes 0 ·
nickdb avatar image nickdb ♦♦ johnone commented ·

For testing I just reconstructed a sample message and injected that to make sure it all worked, saved using all the api calls.

0 Likes 0 ·
Dirk-Jan Faber (Victron Energy) avatar image Dirk-Jan Faber (Victron Energy) ♦ johnone commented ·

The professional account seems to add a weather forecast via the same API. See the example on http://doc.forecast.solar/doku.php?id=api:weather.

If the current weather predictions weren't taken into account, the 3 day estimate graph (from my home in NL) would not differ a lot on a daily basis:
1673349827636.png

0 Likes 0 ·
1673349827636.png (19.0 KiB)
nickdb avatar image nickdb ♦♦ Dirk-Jan Faber (Victron Energy) ♦ commented ·

We are in a sunny spell, so it is correctly predicting some consistent yields.

The last few days it has been all over the show with cloud and showers.

screenshot-2023-01-10-at-133426.png

0 Likes 0 ·
johnone avatar image johnone commented ·

Collecting hourly forecast.solar data in a db, but seeing big variation when doing an estimate/watthours/day/ call for my location and my little 45/0/1.77 array. In the last 3 hours:

{'2023-01-11': 3068, '2023-01-12': 829, '2023-01-13': 1472, '2023-01-14': 967}

{'2023-01-11': 2609, '2023-01-12': 824, '2023-01-13': 962, '2023-01-14': 1132}

{'2023-01-11': 1781, '2023-01-12': 946, '2023-01-13': 2230, '2023-01-14': 1051}

Yesterday the forecast for today went as high as 3303W - was wondering if I'd need sun cream, but no it's partly cloudy with rain on the way! Anyone else seeing this level of variation? Have I gotten something wrong??

0 Likes 0 ·
nickdb avatar image nickdb ♦♦ johnone commented ·
Just make sure you have all the settings right, originally what threw me was the azimuth, North was -180 instead of 0 as I had expected. Being southern hemisphere our weather patterns are a tad different. I do see it sometimes being a little optimistic but it does seems to start correcting itself.
0 Likes 0 ·
johnone avatar image johnone nickdb ♦♦ commented ·

Thanks - it's all set-up ok. It's the wild variation from one hour to the next which is the problem. Today's 'Watt hours (energy)' forecast has gone from 3068W, down to 1781W, then back up to 3844W. On what is another rainy day with periods of heavy cloud, the current forecast is for 3546W from my little 1.77Wp array at 52 deg North! Cebo GX says total so far today is 700W at 15:30.

I'm trying to establish accuracy/reliability. I'm not that interested in 'it seems quite good' or 'it does seems to start correcting itself'. Instead, I'm looking at actual data. So far, it doesn't look good. I'll report back with a week's data - in the meantime, has anyone else seen wild variations? Has anyone else looked at accuracy/reliability?

0 Likes 0 ·
nickdb avatar image nickdb ♦♦ johnone commented ·

You and I are probably on opposite extremes of the weather. I would imagine hourly forecasting in variable weather can be problematic. Would be interesting to compare to the other api.

Today I was forecast 35.1 kWh and I’ve used 32.5, granted some left unused but the temps were much hotter than forecast so I suspect they failed to calculate how much it would actually derate.

0 Likes 0 ·
wkirby avatar image wkirby ♦♦ johnone commented ·

For me, Monday's and today's estimates were pretty close to what I actually got.
Tuesday's estimate was way off. My estimate was for 1.7kWh, but I actually got 600Wh. I wonder if the Forecastsolar people have any idea of just how dark and grim the British weather can actually get. A 1kW array is generating 1.7W at noon for example. Their idea of thick black cloud may less than Britain is actually capable of.
I'm recording each day's estimate and actual values to see if a reliable pattern can be formed.

0 Likes 0 ·
semlohnhoj avatar image semlohnhoj johnone commented ·

I've setup a flow in nodered to use the energy.solar data as well. Made me laugh when I read you guys are doing the same :)


I'm on Anglesey in North Wales UK and I get the same kind of grim weather as wkirby so the predictions are somewhat unreliable. I've set the flow up to only charge the batteries to the point where solar shouldn't bring them back to 100% during the day (as I don't do feed in). I can see though that this is going to be an itterative process with terrible noise. I suspect even if I bothered to try and train an ML model on a years worth of data it wouldn't reasonably predict the right settings. Fun to try though. I also suspect using a manual set of charge values based on solar prediction would need to be time-of-year specific especially in my case as the panels on side of my house have all sorts of shading that will vary during the year because of the sun's angle and obstructions (houses, trees, neighbours TV aerial!, even the hedge in the garden :) ).


0 Likes 0 ·
Dirk-Jan Faber (Victron Energy) avatar image Dirk-Jan Faber (Victron Energy) ♦ commented ·

For the graph output there are some extra settings available:

  • Output in kWh - when checked output can be set to kWh instead of Wh
  • Show todays forecast - whether or not to include todays forecast
  • Days to forecast - the number of days to forecast (excluding today). Note that you can not get more days forecasted than your API key allows.
  • Widen graph - widen the graph to only show non-zero values


1673452480695.png

0 Likes 0 ·
1673452480695.png (77.5 KiB)
nickdb avatar image nickdb ♦♦ Dirk-Jan Faber (Victron Energy) ♦ commented ·

@Dirk-Jan Faber I think there is an error with the "estimate for the period" chart output, selecting the number of days to forecast doesn't seem to have an effect.

0 Likes 0 ·
Dirk-Jan Faber (Victron Energy) avatar image Dirk-Jan Faber (Victron Energy) ♦ nickdb ♦♦ commented ·
That should be fixed now.
1 Like 1 ·
Dirk-Jan Faber (Victron Energy) avatar image Dirk-Jan Faber (Victron Energy) ♦ nickdb ♦♦ commented ·

Thanks for the report. It will probably take a few days before I get around to fixing that.

0 Likes 0 ·
johnone avatar image johnone commented ·

Quick update on accuracy/reliability of forecast data. It's a good time to gauge accuracy as in the UK this morning there's a bog-standard Atlantic jet-stream produced weather system which has been accurately forecast - over the last 3-4 days - to arrive overnight. Currently, in the Midlands at 52 deg North it's overcast but clearing. Given yields over the last few weeks - with max sun altitude of 15deg, now 16 deg in mid-January - harvesting 1kW today looks very optimistic. Following data gathered by python script into a db:
Time of forecast / yield-for-the-day forecast for 1.77kWp free-standing, south facing array
Solcast
21:02 2448W
00:02 2783W
03:02 2794W
06:02 977W
forecast.solar
21:02 4196W
00:02 5112W
03:02 4129W
06:02 1501W

EDIT: actual yield for today: 960Wh (Pmax 1076W). Snowing at midday. Yes, Solcast was very accurate at 6:02 - of course, though, that's way too late for deciding whether or not to fully charge the battery in cheap rate period. 6:02 is more of an observation than a forecast!

0 Likes 0 ·
nickdb avatar image nickdb ♦♦ johnone commented ·

I found it tends to overestimate, so I lowered the panel size slightly to where I was more confident in the forecast.

0 Likes 0 ·
johnone avatar image johnone nickdb ♦♦ commented ·

Yes, lots of examples where 6kWh is forecast for a day - figures only possible in our summer. The problem today, though, was both APIs not taking account of the weather forecast!

0 Likes 0 ·
johnone avatar image johnone commented ·

Another big clue to the inaccuracy - today is sunny (not cloudless, and started out misty). Max sun altitude for my location (52 deg N) today is 17 deg. Expected max yield for the 1.77kWp array is around 2.5kWh. Forecasts:
Solcast
21:02 6785Wh
00:02 7066Wh
03:02 7124Wh
06:02 6416Wh

forecast.solar

21:02 6398Wh
00:02 6417Wh
03:02 5905Wh
06:02 5645Wh

You'd have thought they would use the easily available 'clear-sky irradiance' data as a baseline, then factor in the weather. Here's a January daily 'average daily irradiance' graph for my location from PVGIS.

Clearly, 6-7kWh for my 1.77kWp array is simply not anywhere near possible in January - why don't the APIs use PVGIS data?

pvgis-irradiaion-jan-52n.jpg

0 Likes 0 ·
krafty avatar image krafty johnone commented ·

I gave up fiddling about with 'forecast.solar' etc a while ago... I just tried it again (for today) and their forecast was out by 5 x.


Now I simply pull the (free) 3-hour cloud cover figures from openweathermap at 5am, average them, add ~20 and set that as my SOC target to hit before the cheap juice ends at 7am.


Last year, I had the various forecasts all feeding their (wildly!) varying figures into a db for a while for comparison. The method above emerged the clear winner. :D

0 Likes 0 ·
fish avatar image fish commented ·

Dirk Thanks for the ideas, I've now got your bit and a Solcast one averaging and setting the charge levels each night for my kit dependant on the forecasts. It also emails the figures used each day... Cheers

0 Likes 0 ·
joolster avatar image joolster fish commented ·

Hi all,

What's your current best view regarding long term accuracy for solcast and forecast.solar?

From my calculations (and just for the last 3 days), it looks like both are +/- 30% (approx) on the real production values, and typically their forecast is optimistic.

Does this correlate with what you've been seeing?

If this is true then a sensible ESS off-peak charging scenario would be to take the solar forecast numbers, factor down to 75%, and subtract this from target SOC (obviously converting between kwh, battery capacity etc) and charge to this level off peak - this would minimise solar 'waste' (export to grid), maximise off-peak (lower cost charging) etc

What do you think?

Thx, Julian

0 Likes 0 ·
tomcat avatar image tomcat commented ·

Hi, thanks for sharing.

Im relativly new to node red. Ist there a way to get the estimated production from doing the request to the end of the day?

If not I want to suggest it :)

Why im asking is, I try to consume as most as possible with different loads directly wihout touching the battery but still want to get the battery full at the end of the day.

So I need to know when to stop direct consumpten to get enough to get the battery full.

I know I could charge the battery first and start direct consumption after its full but my heat pump has high load from 4-6kw/h and Im running it whern sun deliveres enough to not touch the battery and in most cases the battery is not full when this period starts. I hope you understand what im trying to say achieve :D

0 Likes 0 ·
ronski avatar image ronski tomcat commented ·

I'm also very new to Node Red, and JSON, but I have done a bit of programming in the past so starting to pick it up.

What you're asking could be done, but it would be very inaccurate, mine is currently predicting 28.1kWh for today, it's 5pm and I've generated 41.23kWh so far - the weathers been great, pretty much as per the weather forecast, so not even a difficult day to predict.

I've logged a weeks worth of predicted values from the night before, and actual values generated, and they range from 20% to 50% more than estimated. I believe I have everything set correctly as well.

For me it's just an indication, a guide as such, but from Tuesday my game plan changes as I've moved to Octopus Flux.

0 Likes 0 ·
tomcat avatar image tomcat ronski commented ·

Hm I was doing it manually for 2 weeks now. I charged to 60-70% turned the heat pump on and turened it off when remaing predicted solar power was enough to fill the battery up to 90-100%.

In 80% if my manuall tries I succeeded. The prediction of the whole day in the morning is not that accurate true but the next 2-4h is fine in most cases :D. For the cases where I get more than prediced I will install a 0-100% controlleable electrical heater into my buffer tank.

0 Likes 0 ·

Article

Contributors

dfaber contributed to this article