question

jimf909 avatar image
jimf909 asked

How to adjust VRM time or date grain?

When using VRM, is it possible to set the time or date grain to a full calendar day when looking at history and if so, how can this be done?

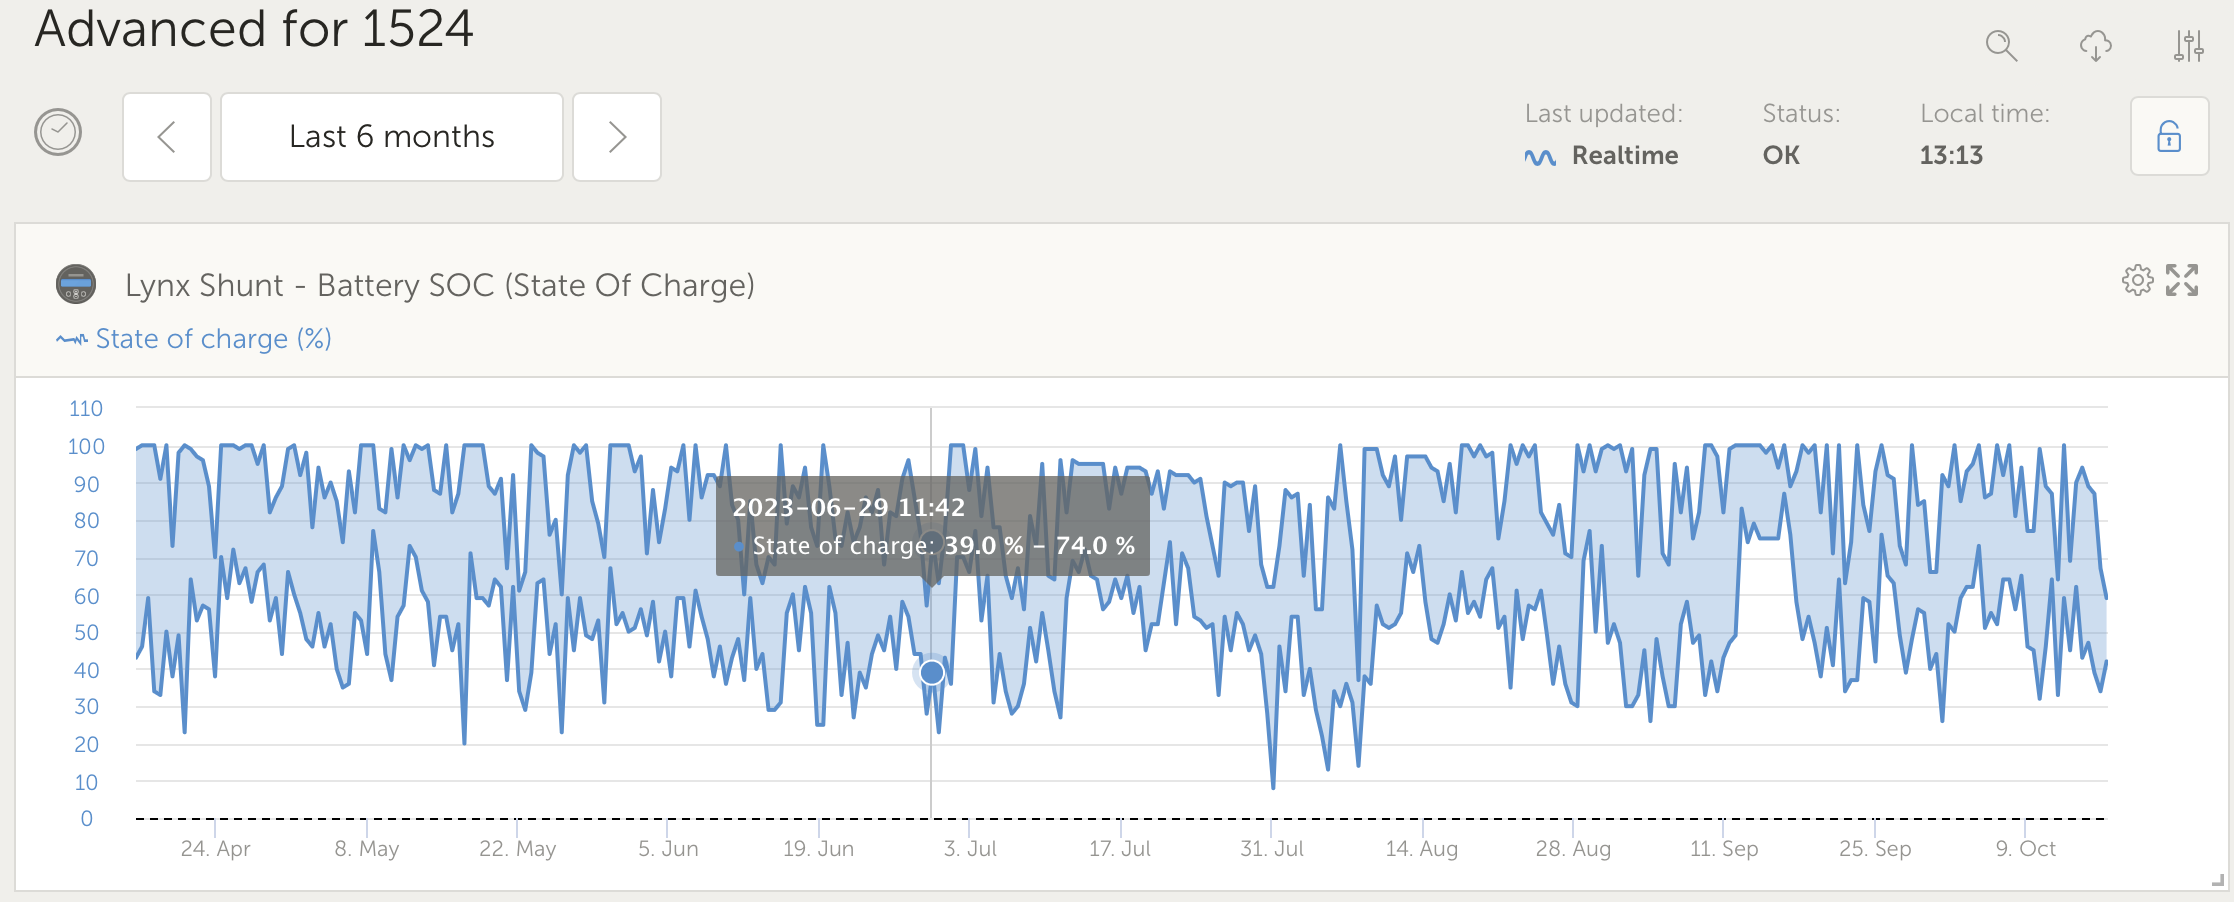
Example: I'd like to view daily PV yield for the past 6 - 12 months at the calendar day grain. When I select an extended date range on the dashboard it displays aggregated PV yield at the calendar week grain. When I select an extended date range on the the Advanced tab it displays data for apparently random time stamps across the date range.

vrm.png


Thanks.

Jim

VRMvrm advanced
vrm.png (742.1 KiB)
2 |3000

Up to 8 attachments (including images) can be used with a maximum of 190.8 MiB each and 286.6 MiB total.

4 Answers
kevgermany avatar image
kevgermany answered ·

The metrics are compressed/averaged to fit the screen.

I don't see that metric in my system.

However under solar charger there's one called yield today. If you zoom in to where you can see individual days, I believe the flat topped area is the value you need. I think the same will happen on yours. The shot I've attached is a zoom in on a 6 month graph.

screenshot-2023-10-14-03-34-37-338-nlvictronenergy.jpg


2 |3000

Up to 8 attachments (including images) can be used with a maximum of 190.8 MiB each and 286.6 MiB total.

jimf909 avatar image
jimf909 answered ·

@kevgermany, thanks for your response!

1 - The metric in my screenshot is PV Yield from the Cerbo metrics.

2 - I was hopeful I'd find the Daily Yield metric you shared under my solar charge metrics but it wasn't there, it only had a duplicate PV Yield display that showed random times during the day as in my first screen shot.

3 - Because of your prompt to poke around in my metrics I went to Custom Widget and was able to create a widget for Solar Yield Today. Below are the screenshots of the graphs: the first shows solar yield at apparently random times during the day and the second, the custom widget, shows solar yield aggregated by day. The difference in value is evident in the Y-axis.


It is odd that it still provides multiple data points per day at apparently random times but choosing the highest per day should equal the yield for the day.

vrm2.png

Thanks for pointing me in the right direction!

If other users can help clarify how to get a single data point per day (max total solar yield), I'm interested in any tips you can share. Thanks.


vrm2.png (1.5 MiB)
1 comment
2 |3000

Up to 8 attachments (including images) can be used with a maximum of 190.8 MiB each and 286.6 MiB total.

kevgermany avatar image kevgermany ♦♦ commented ·
I've already raised the multiple points per day with @Guy Stewart (Victron Community Manager) . It's not the only metric doing it. I think the peak is correct, but no guarantee yet.
1 Like 1 ·
Guy Stewart (Victron Community Manager) avatar image
Guy Stewart (Victron Community Manager) answered ·

Hi @jimf909,

VRM has a maximum allowed time period for each interval. This is:

  • 31 days for 15 minutes
  • 31 days for hours
  • 180 days for days
  • 140 days for weeks
  • 24 months for months
  • 5 years for years

Note VRM only keeps 6 months of advanced data.

Dashboard data is kept for 5 years.


Increasing the resolution at long intervals puts too much load on the VRM servers for each request and they can end up taking too long to process, which causes other issues.

The workaround solution is to do a manual download of the data into an XLSX or CSV document and then create the charts yourself on your computer with Excel (or similar) at the full resolution.


2 |3000

Up to 8 attachments (including images) can be used with a maximum of 190.8 MiB each and 286.6 MiB total.

jimf909 avatar image
jimf909 answered ·

@Guy Stewart (Victron Community Manager), thank you for the explanation and the tip to download the data.

Is there a way that I can select the time period displayed? e.g. The dashboard defaults to displaying: calendar days when I select Last 30 Days; calendar weeks when I select Last 90 Days; and months when I select Last 6 Months.

Is it possible to select Last 90 Days and ask it to display data for days instead of weeks?

Similarly, on the advanced tab when I select Last 6 Months I still see multiple data points for single dates reported at seemingly random time stamps - is there a selector where I can choose 'display data for a full calendar day' or some such thing?

vrm4.png

Thanks for your support and patience!

Jim


vrm4.png (330.4 KiB)
2 |3000

Up to 8 attachments (including images) can be used with a maximum of 190.8 MiB each and 286.6 MiB total.

Related Resources