question

multivictor avatar image
multivictor asked

New temporary (?) graph in VRM

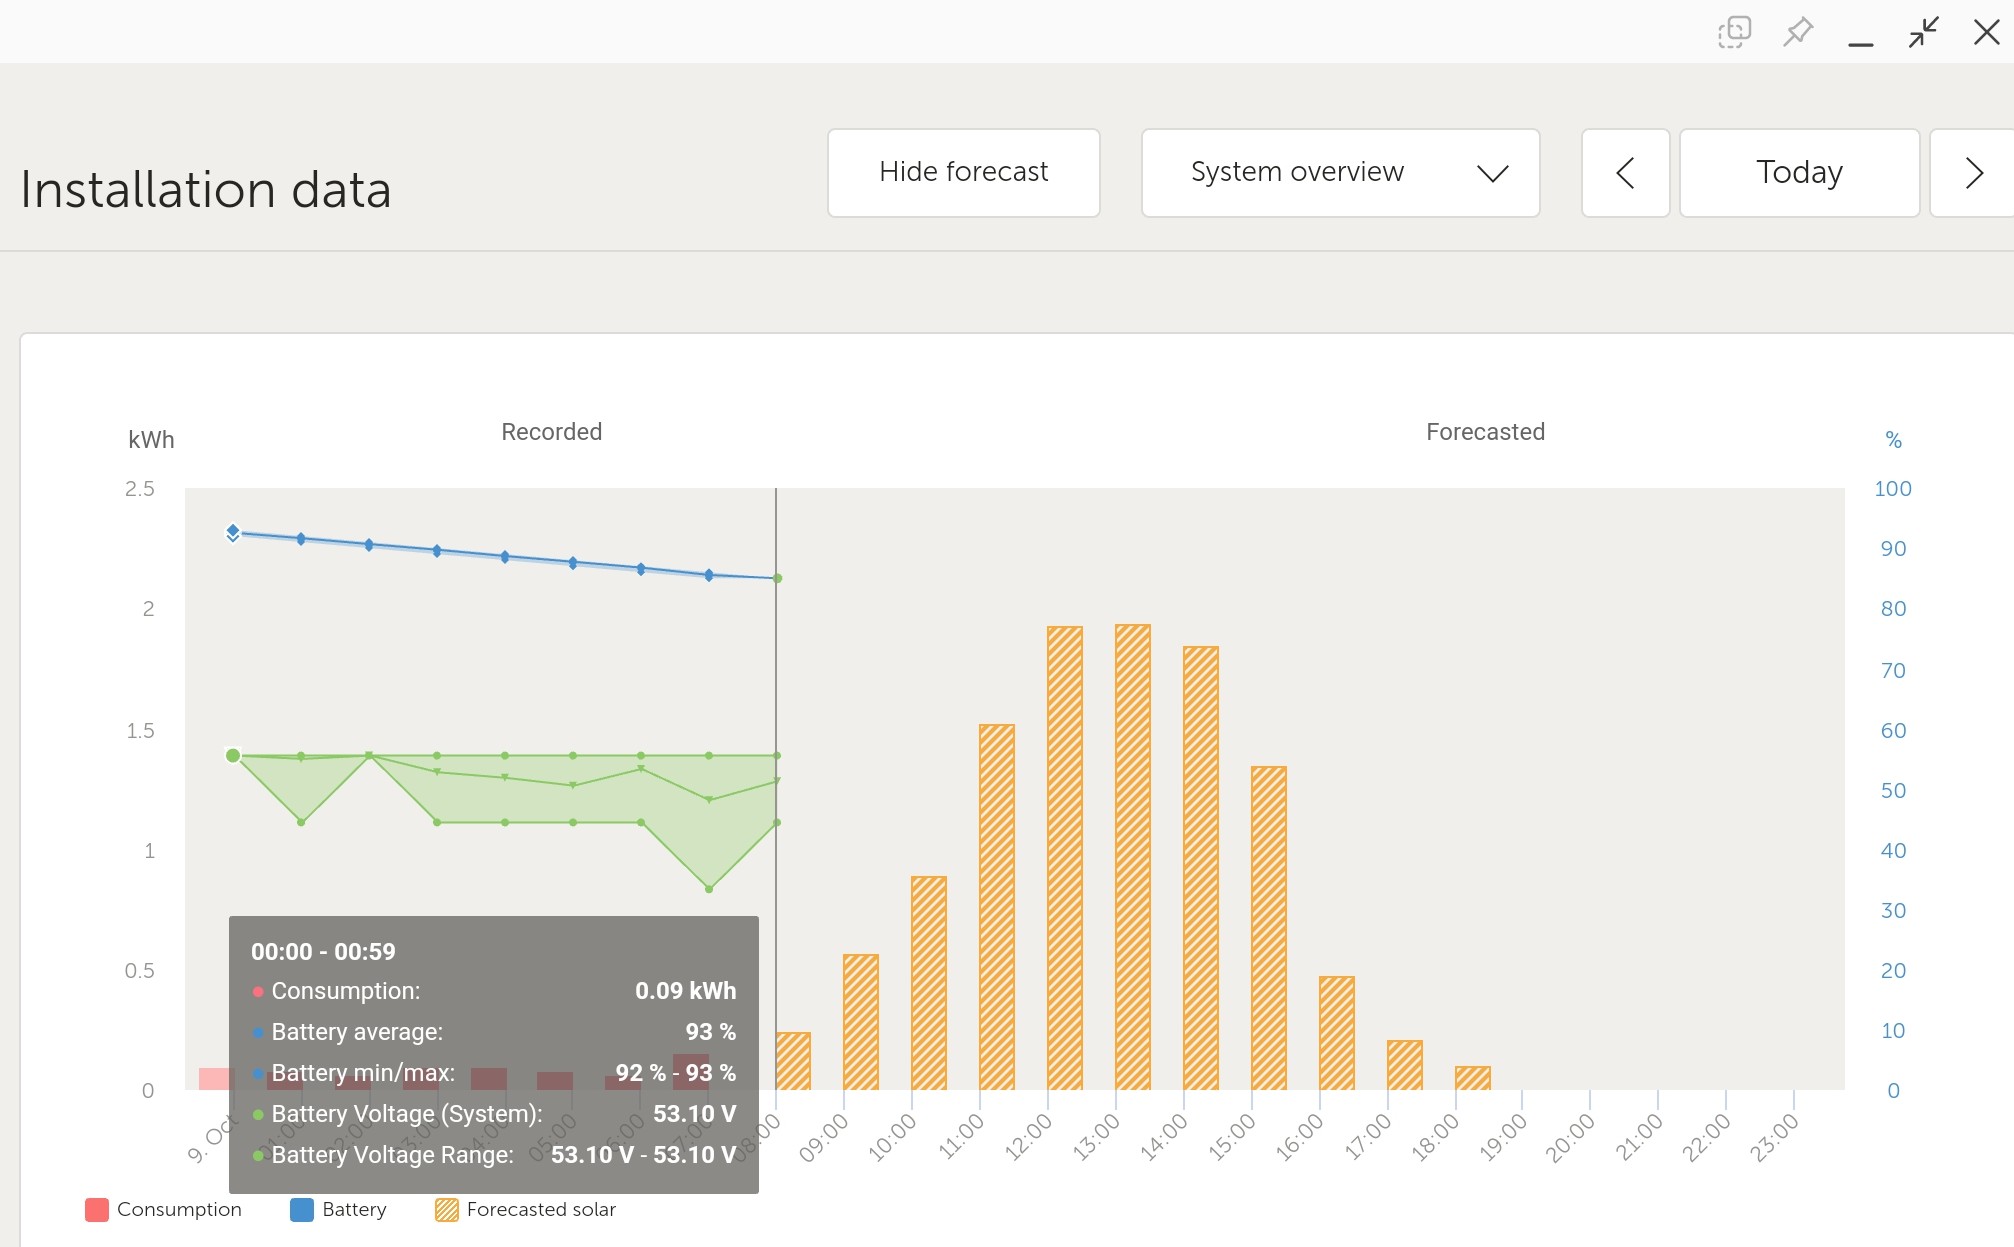
For the past few days I have noticed a new graph (colored green => Battery voltage and battery range).

The strange thing is that this graph is only shown for a few minutes when starting up the VRM and is not visible every day.

Is this a test?
And if not, why does this graph only show up occasionally?

screenshot-20231009-081314-vrm2.jpg


VRM
2 |3000

Up to 8 attachments (including images) can be used with a maximum of 190.8 MiB each and 286.6 MiB total.

3 Answers
kevgermany avatar image
kevgermany answered ·

I never see it. It's a couple of extra data values for the battery. The reason it's only on the left is that the right side is a forecast. These are historical.

2 |3000

Up to 8 attachments (including images) can be used with a maximum of 190.8 MiB each and 286.6 MiB total.

Guy Stewart (Victron Community Manager) avatar image
Guy Stewart (Victron Community Manager) answered ·

Hi @MultiVictor,

I think its a small bug, I've reported it to the VRM team, but it's a low priority to fix.

see also - https://community.victronenergy.com/questions/235477/why-does-an-ephemeral-green-line-appear-on-the-das.html

2 |3000

Up to 8 attachments (including images) can be used with a maximum of 190.8 MiB each and 286.6 MiB total.

multivictor avatar image
multivictor answered ·

Thx.

Not bothersome at all, but I was curious what it was as I had never noticed this before.

2 |3000

Up to 8 attachments (including images) can be used with a maximum of 190.8 MiB each and 286.6 MiB total.