question

billknny avatar image
billknny asked

VRM Missing Data and Widgets?

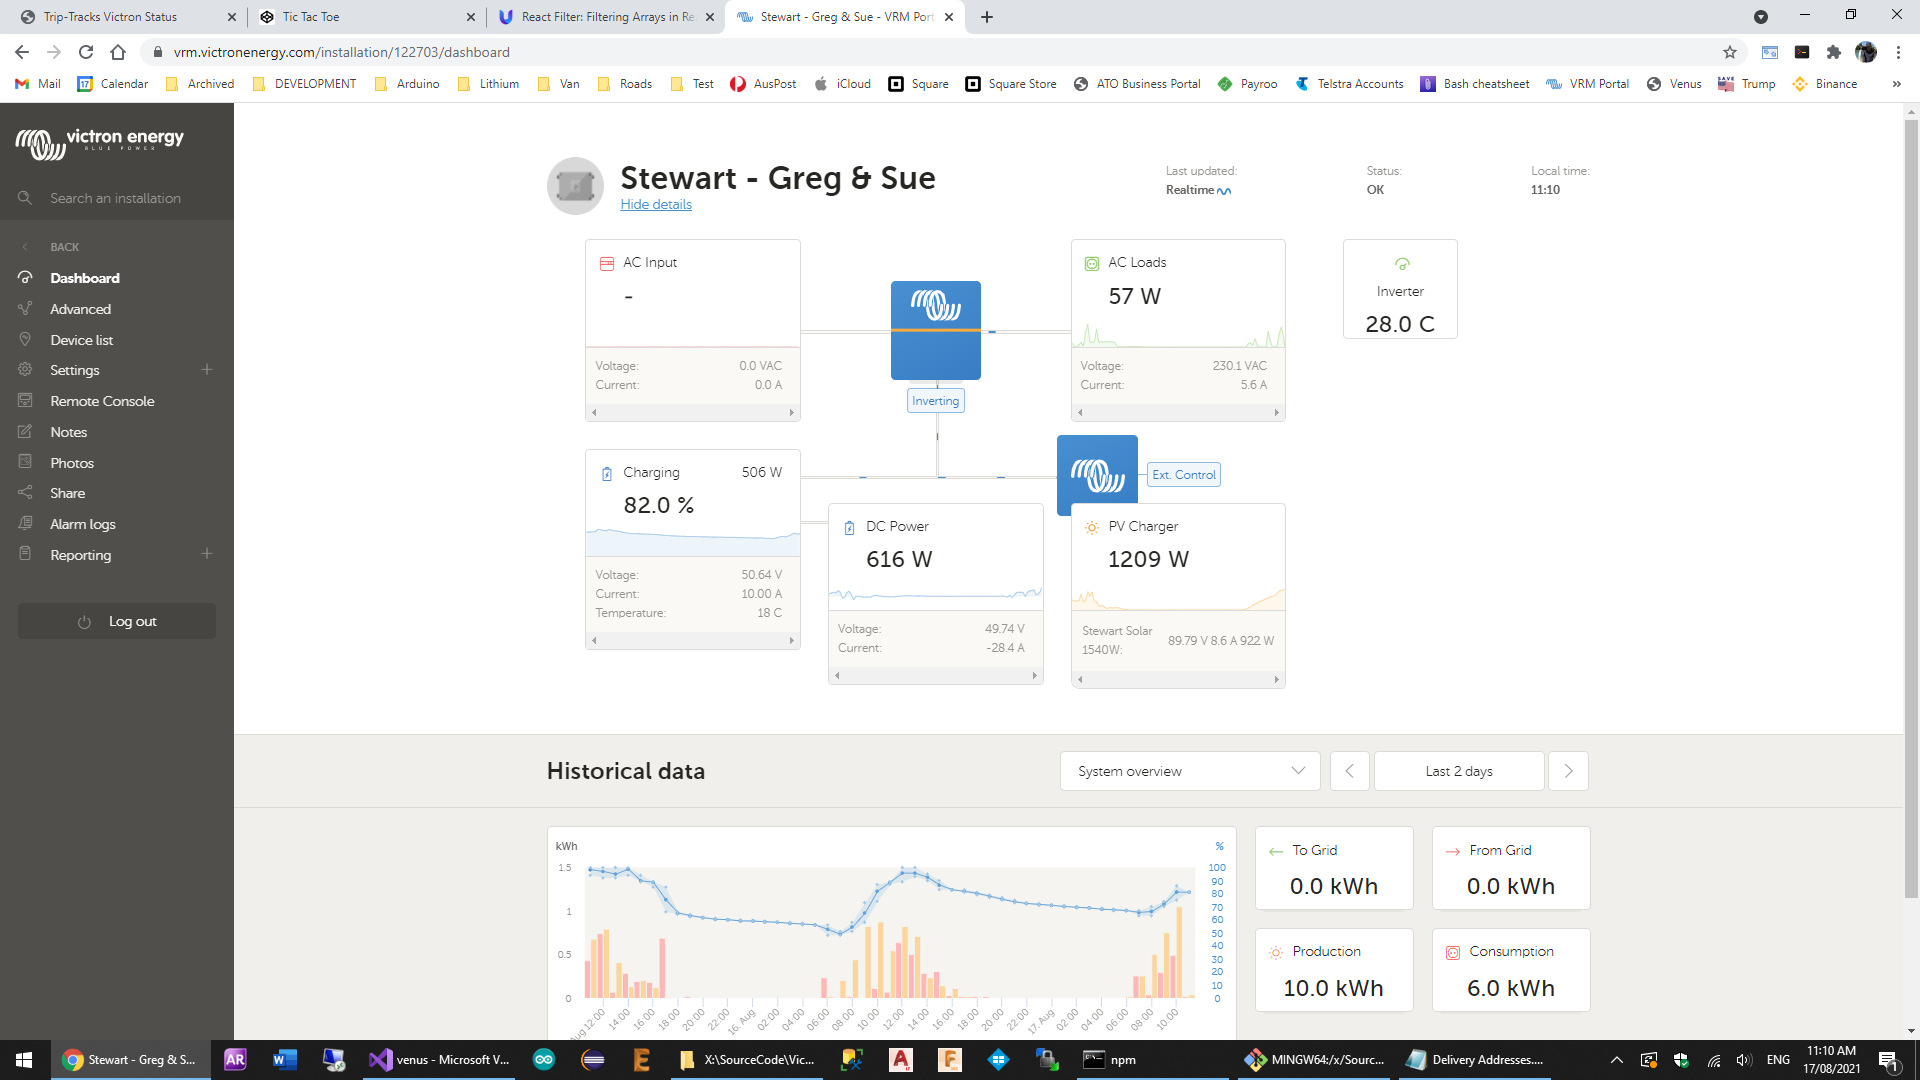
The graph of SOC, arguably the single most important piece of data, in my VRM has disappeared, and the widget to display it has also gone walkabout, although the other data widgets from the BMV are available.

screen-shot-2021-08-14-at-111230.png


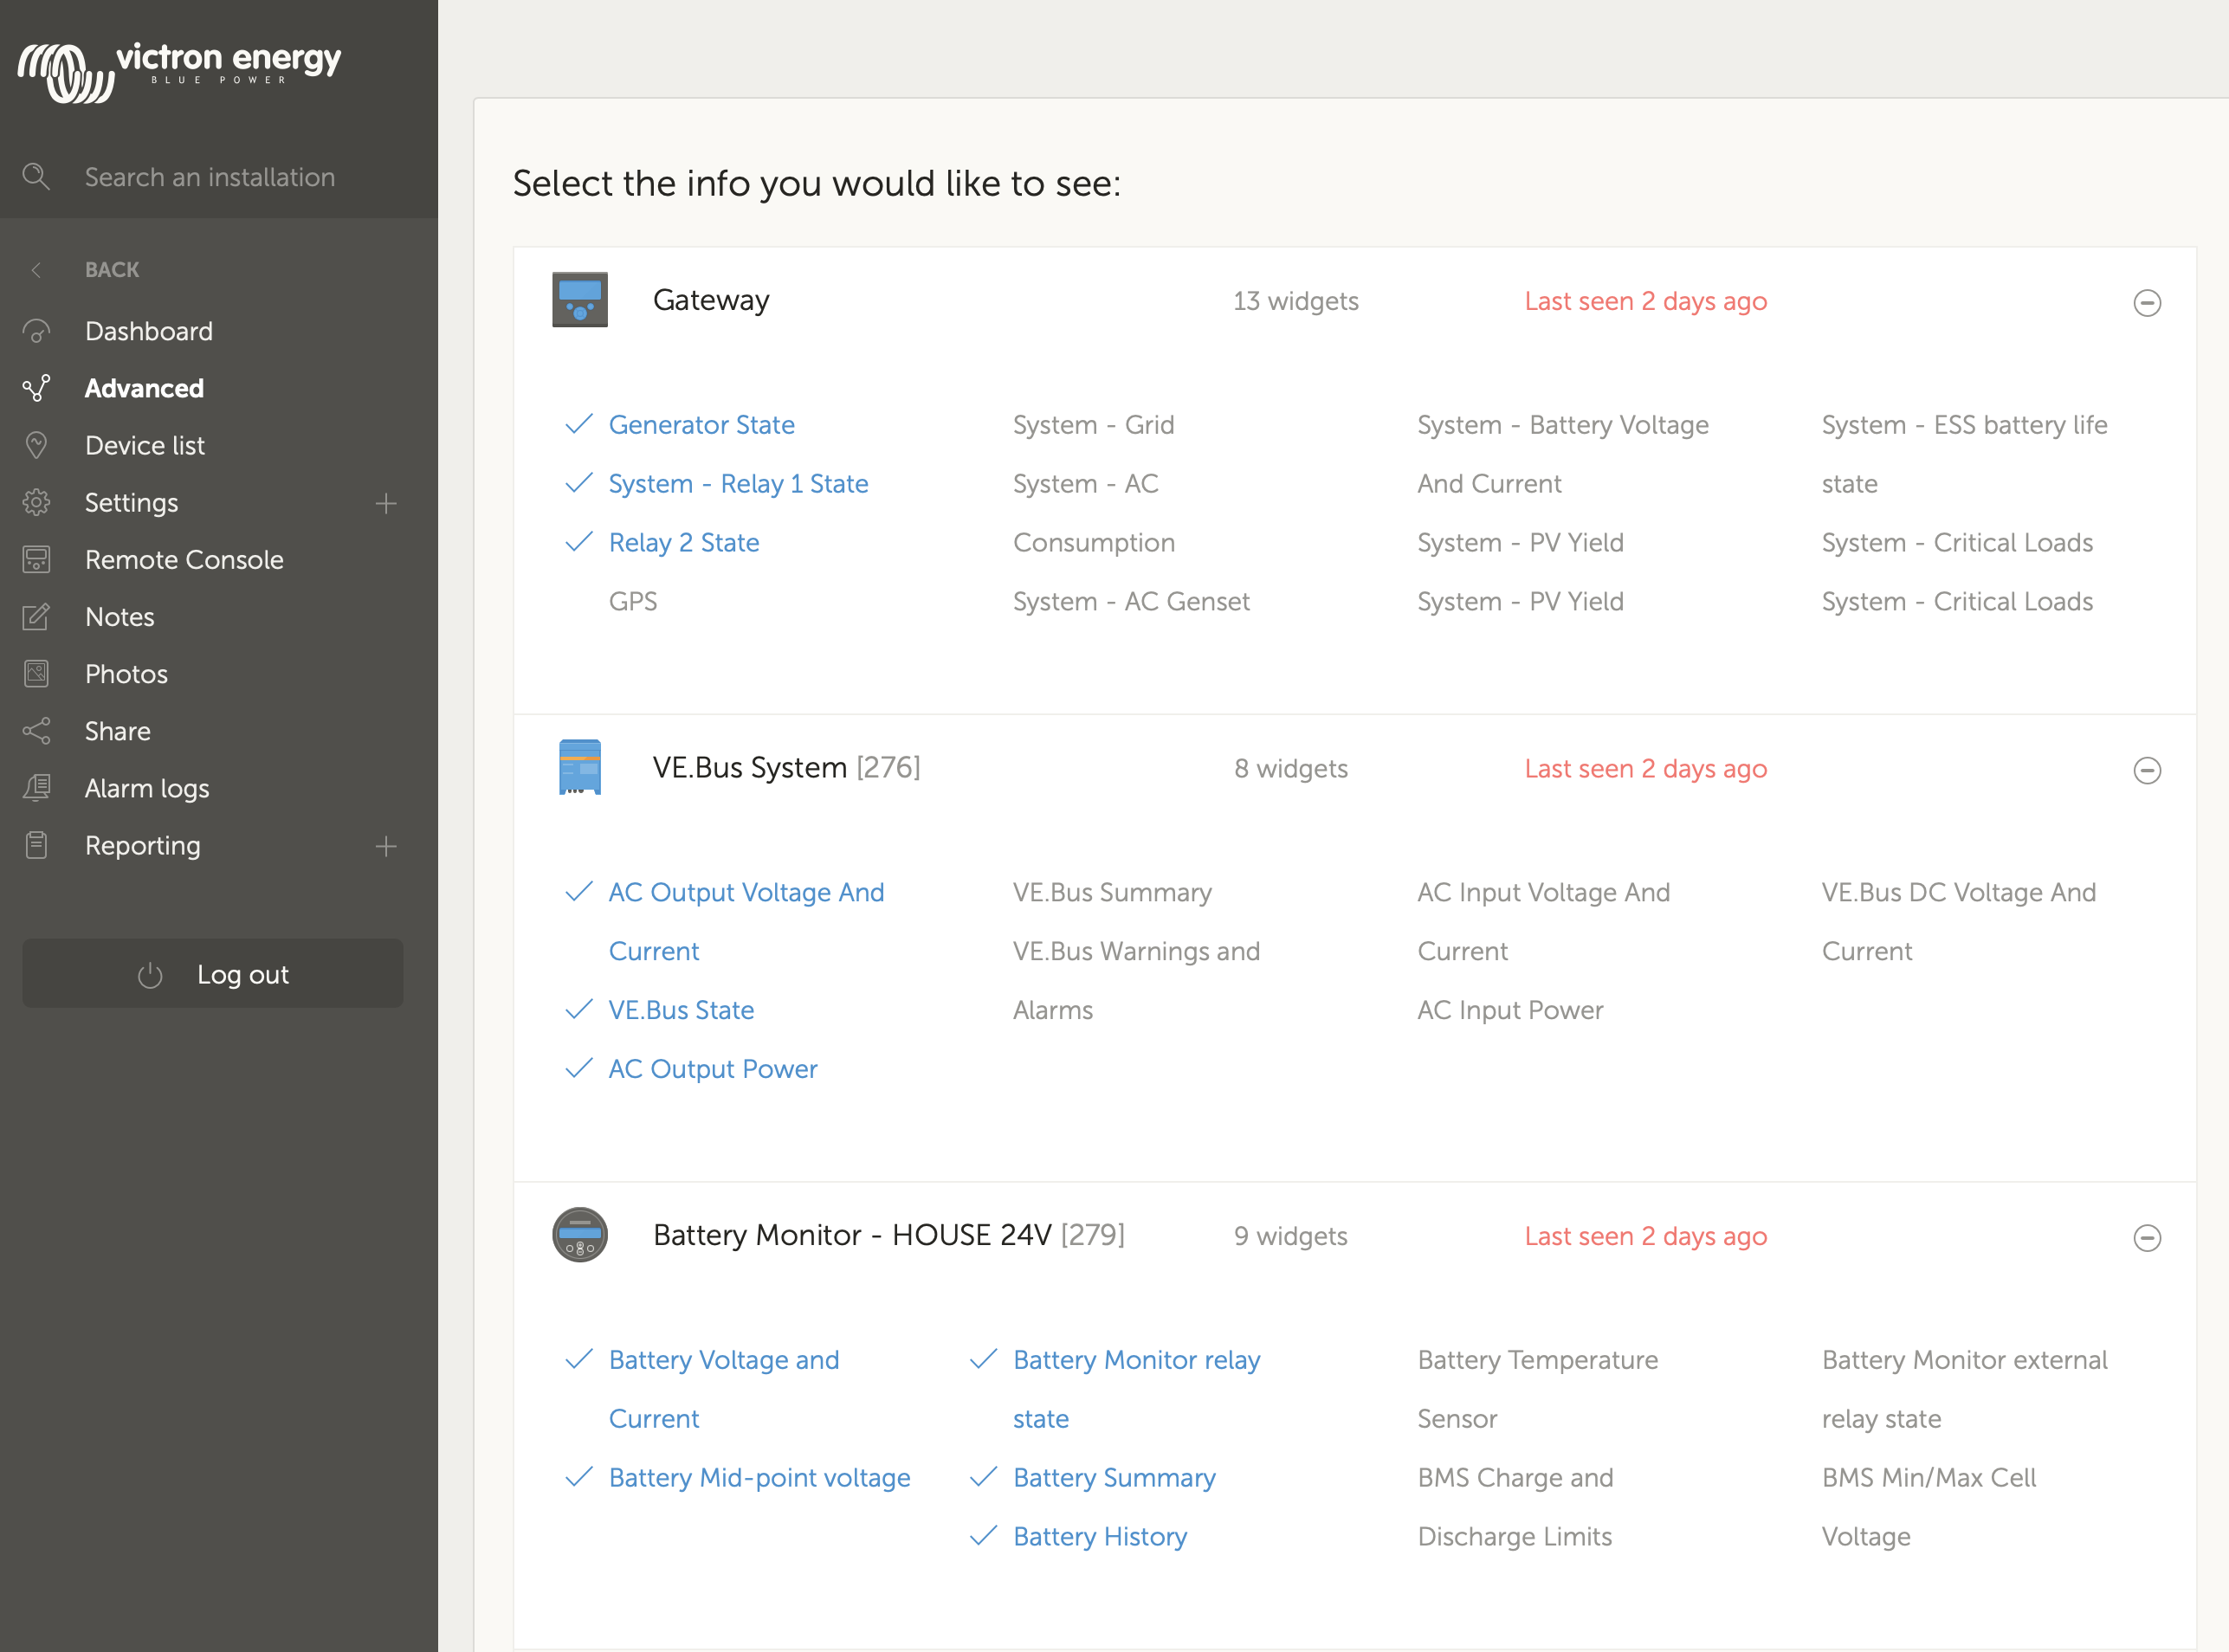
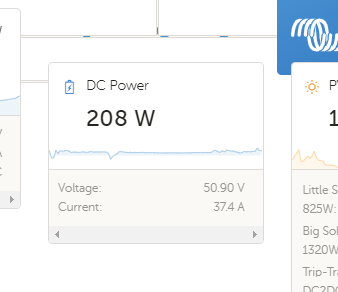
Data appears normal on the local CERBO system, all present and behaving normally. All of the other data presented in the VRM looks correct, although I haven't yet had the chance to do a full audit. There are a few other data that also disappeared, but the SOC is of prime concern to me.

How do I get my SOC data back?

VRMSOC
1 comment
2 |3000

Up to 8 attachments (including images) can be used with a maximum of 190.8 MiB each and 286.6 MiB total.

billknny avatar image billknny commented ·

An update after further investigating:

Other data has also disappeared. Specifically "Battery Temperature" as reported by the Multiplus. Same deal, the graph has disappeared from the "Advanced" page and the widget has disappeared from the list, so can not no longer be selected. Same exact symptoms as the SOC above, and again, the data is available locally on the CERBO as before.

These are both really important pieces of data to me, how can they have disappeared from the VRM Portal and no longer be accessible? Is it even remotely possible I am the only one who is seeing this?

0 Likes 0 ·
7 Answers
Teun Lassche avatar image
Teun Lassche answered ·

Hi all!

I've confirmed this issue and released a fix! Sorry for the inconvenience

2 |3000

Up to 8 attachments (including images) can be used with a maximum of 190.8 MiB each and 286.6 MiB total.

trip-tracks avatar image
trip-tracks answered ·

Yes, I can confirm there appears to be a VRM issue here.
I have some sites with SOC widget missing (where they were present previously), while other sites are ok.
@mvader (Victron Energy), are you aware of this?


2 |3000

Up to 8 attachments (including images) can be used with a maximum of 190.8 MiB each and 286.6 MiB total.

Guy Stewart (Victron Community Manager) avatar image
Guy Stewart (Victron Community Manager) answered ·

Thanks for reporting, looking into it.

2 |3000

Up to 8 attachments (including images) can be used with a maximum of 190.8 MiB each and 286.6 MiB total.

Bas Rijniersce avatar image
Bas Rijniersce answered ·

Confirming the issue, in my case the MPPT Yield graphs are missing


Bas

2 |3000

Up to 8 attachments (including images) can be used with a maximum of 190.8 MiB each and 286.6 MiB total.

billknny avatar image
billknny answered ·

The widgets are back! Thanks Victron for the quick fix!!

2 |3000

Up to 8 attachments (including images) can be used with a maximum of 190.8 MiB each and 286.6 MiB total.

trip-tracks avatar image
trip-tracks answered ·

Some strange figures in the calculations - DC power does not reflect volts x amps, AC Loads does not reflect volts x amps
1629163229728.png

The watts add up for the system but not correct - the current is correct.

This other system is way out showing 37.4A....
1629163492542.png


@mvader (Victron Energy)


1629163229728.png (255.7 KiB)
1629163492542.png (16.2 KiB)
2 |3000

Up to 8 attachments (including images) can be used with a maximum of 190.8 MiB each and 286.6 MiB total.

glenmc avatar image
glenmc answered ·

This issue appears to have returned, as I have the same issue.

Widgets not displaying graphs, also when you add a widget and go from advanced to dashboard the new widget disappears. The only widget that displays correctly is MPPT State.

System was displaying correctly unit 5-5-2022, system consists of MPPT's and cerbo

2 |3000

Up to 8 attachments (including images) can be used with a maximum of 190.8 MiB each and 286.6 MiB total.

Related Resources

Additional resources still need to be added for this topic