question

dr-schliwago avatar image
dr-schliwago asked

SOLVED - VRM Dashboard - Calculation bug Historical data System overview > 48h

I think I found a bug in the VRM dashboard.

The error can be reproduced.

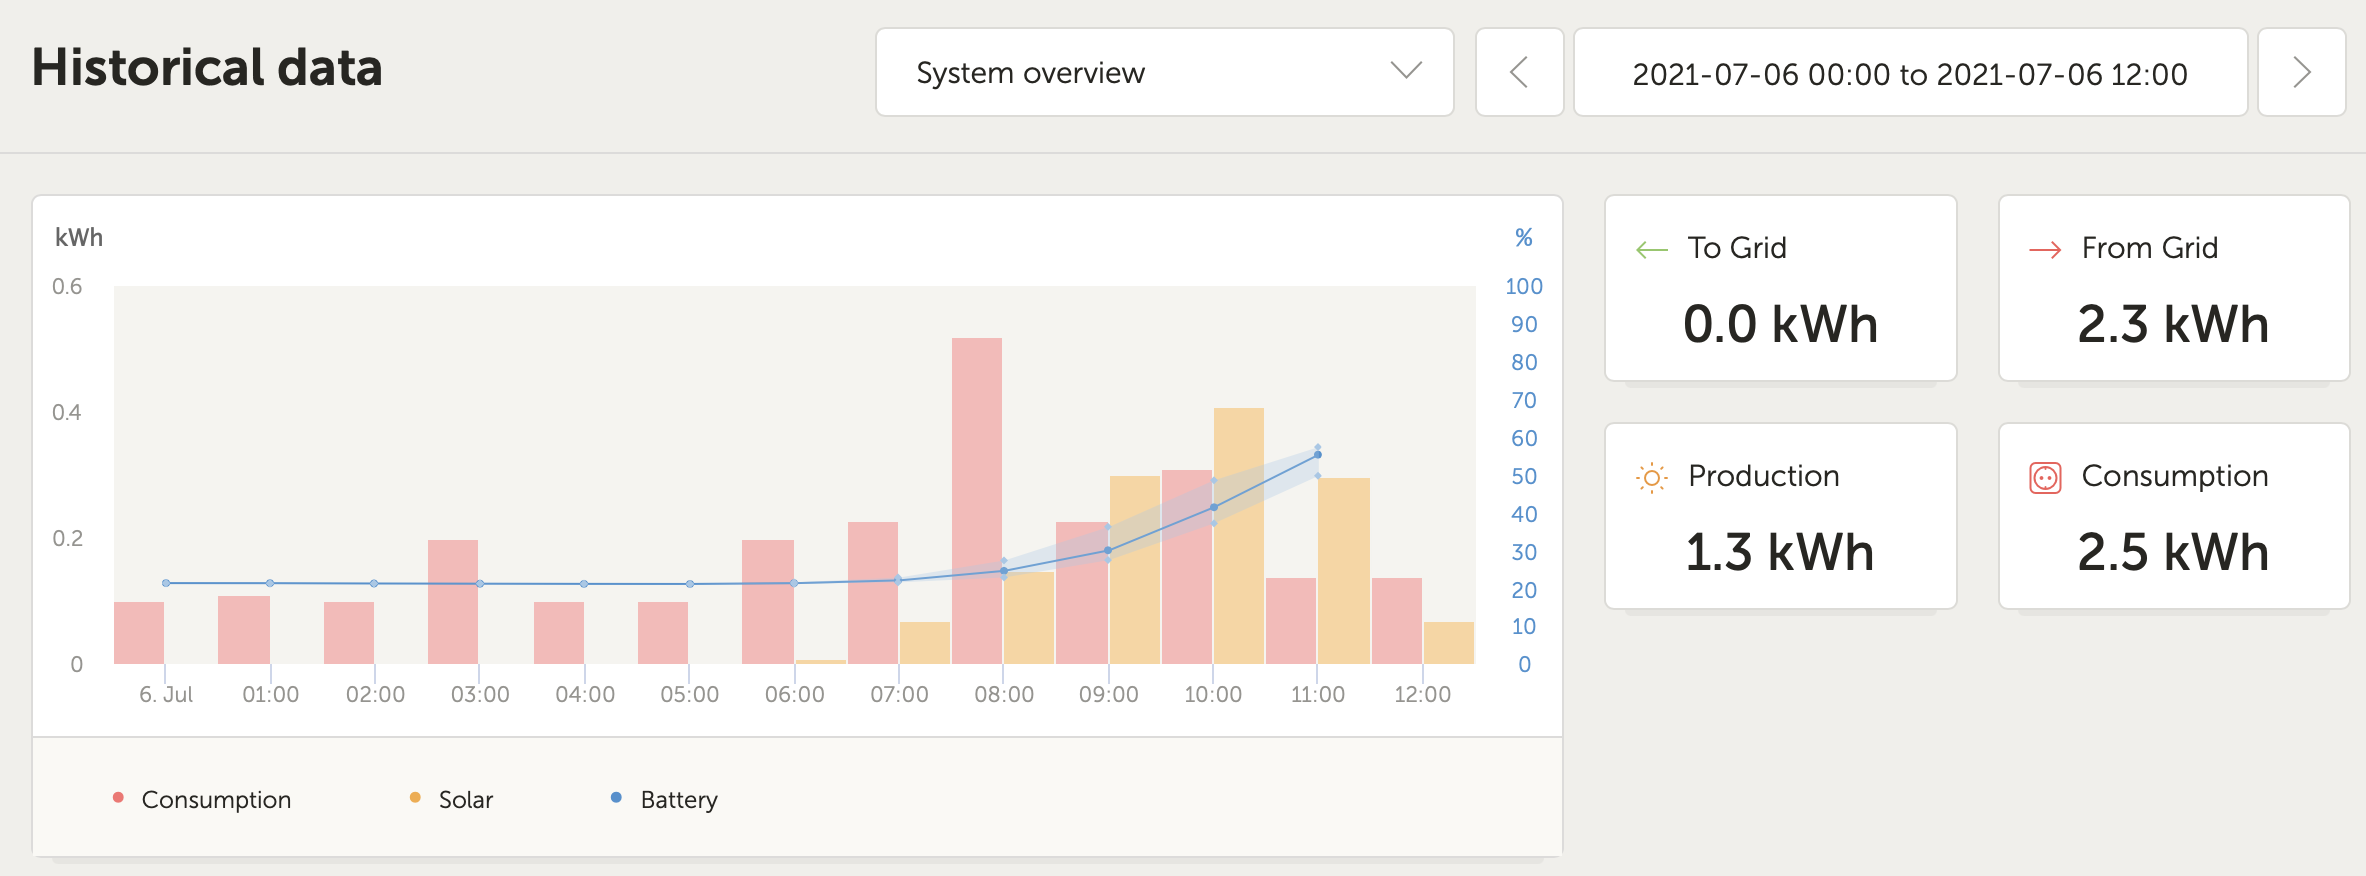
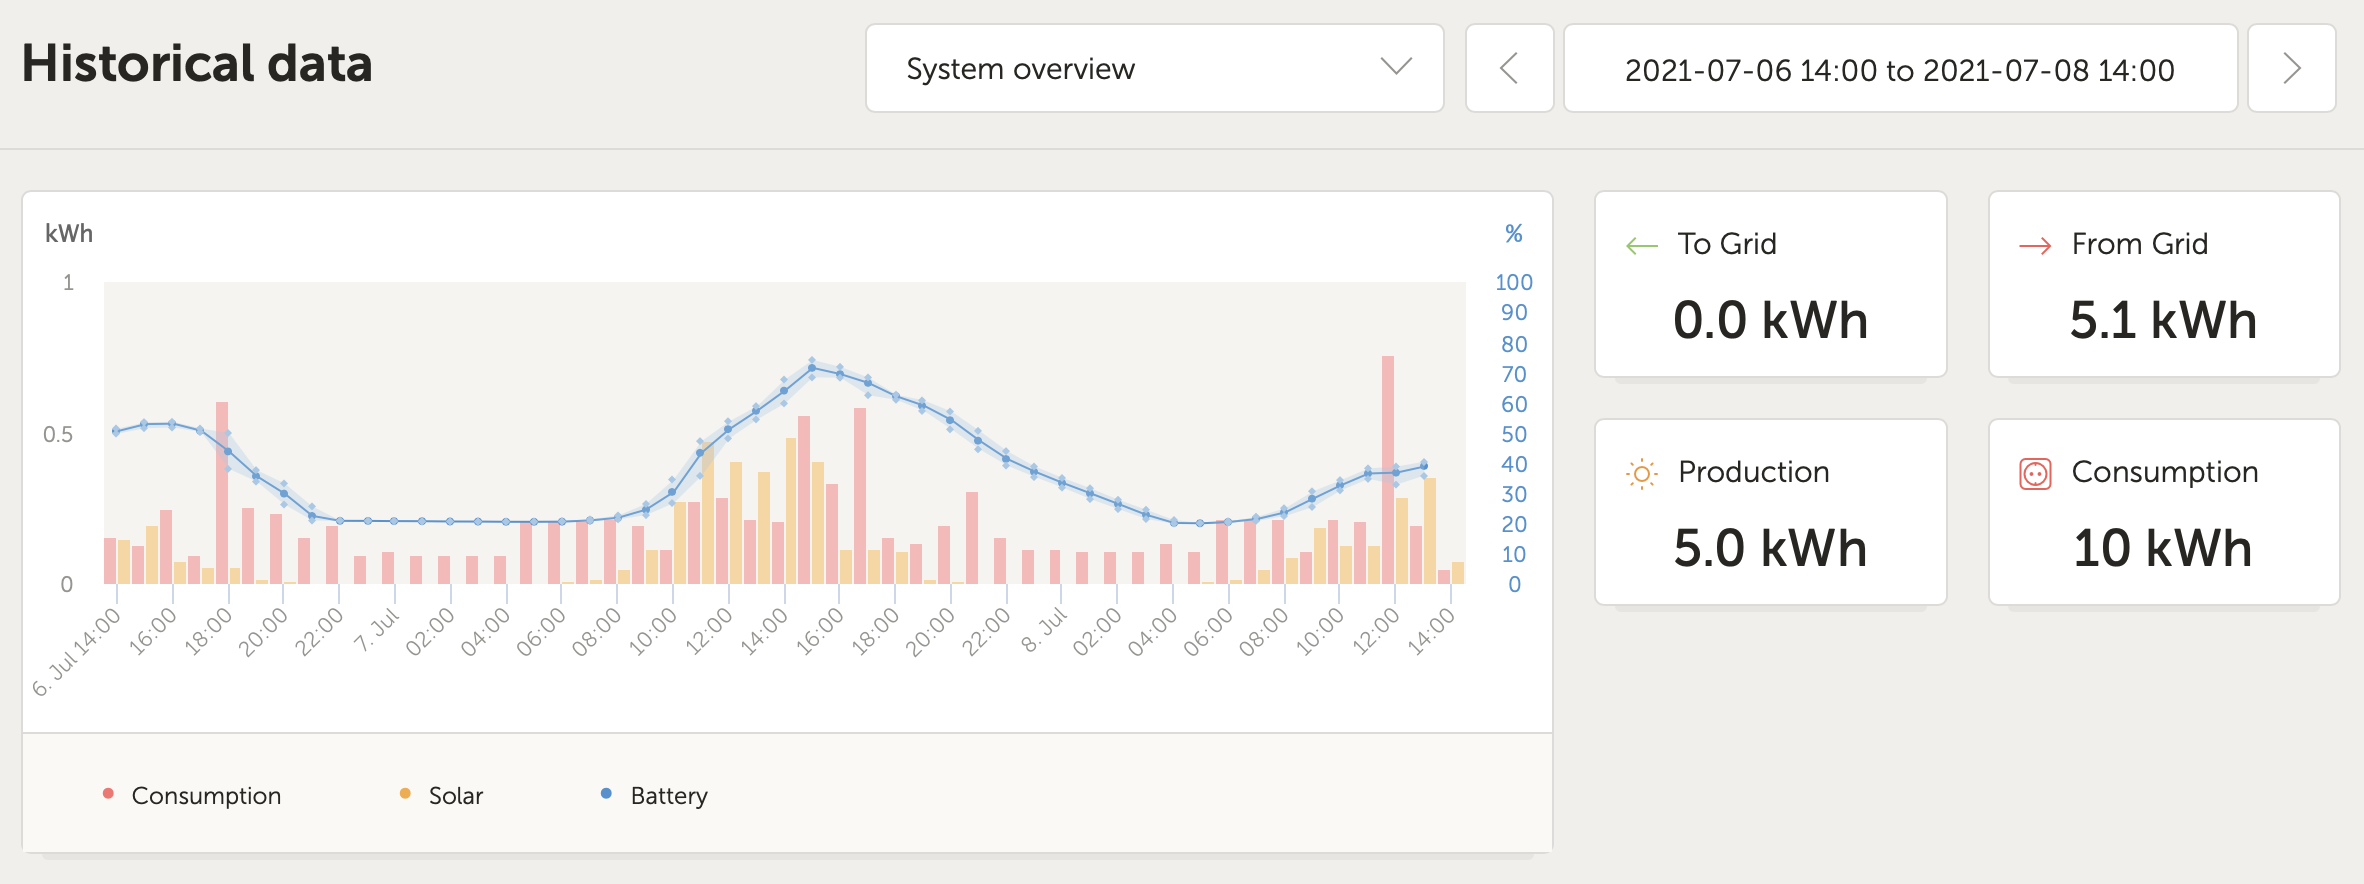
The error shows up in the sum of the "From Grid" data field in the dashboard when a period greater than 48 hours is selected. If the selection is smaller than 48 hours, the chart is displayed based on hours. If you select more than 48 hours, the diagram is displayed on a daily basis.

I use a MultiPlus-II and EM24 Energymeter.


Example

< 48 hours - From Grid: 5.1kWh (5.1 is correct)
1625768680797.png


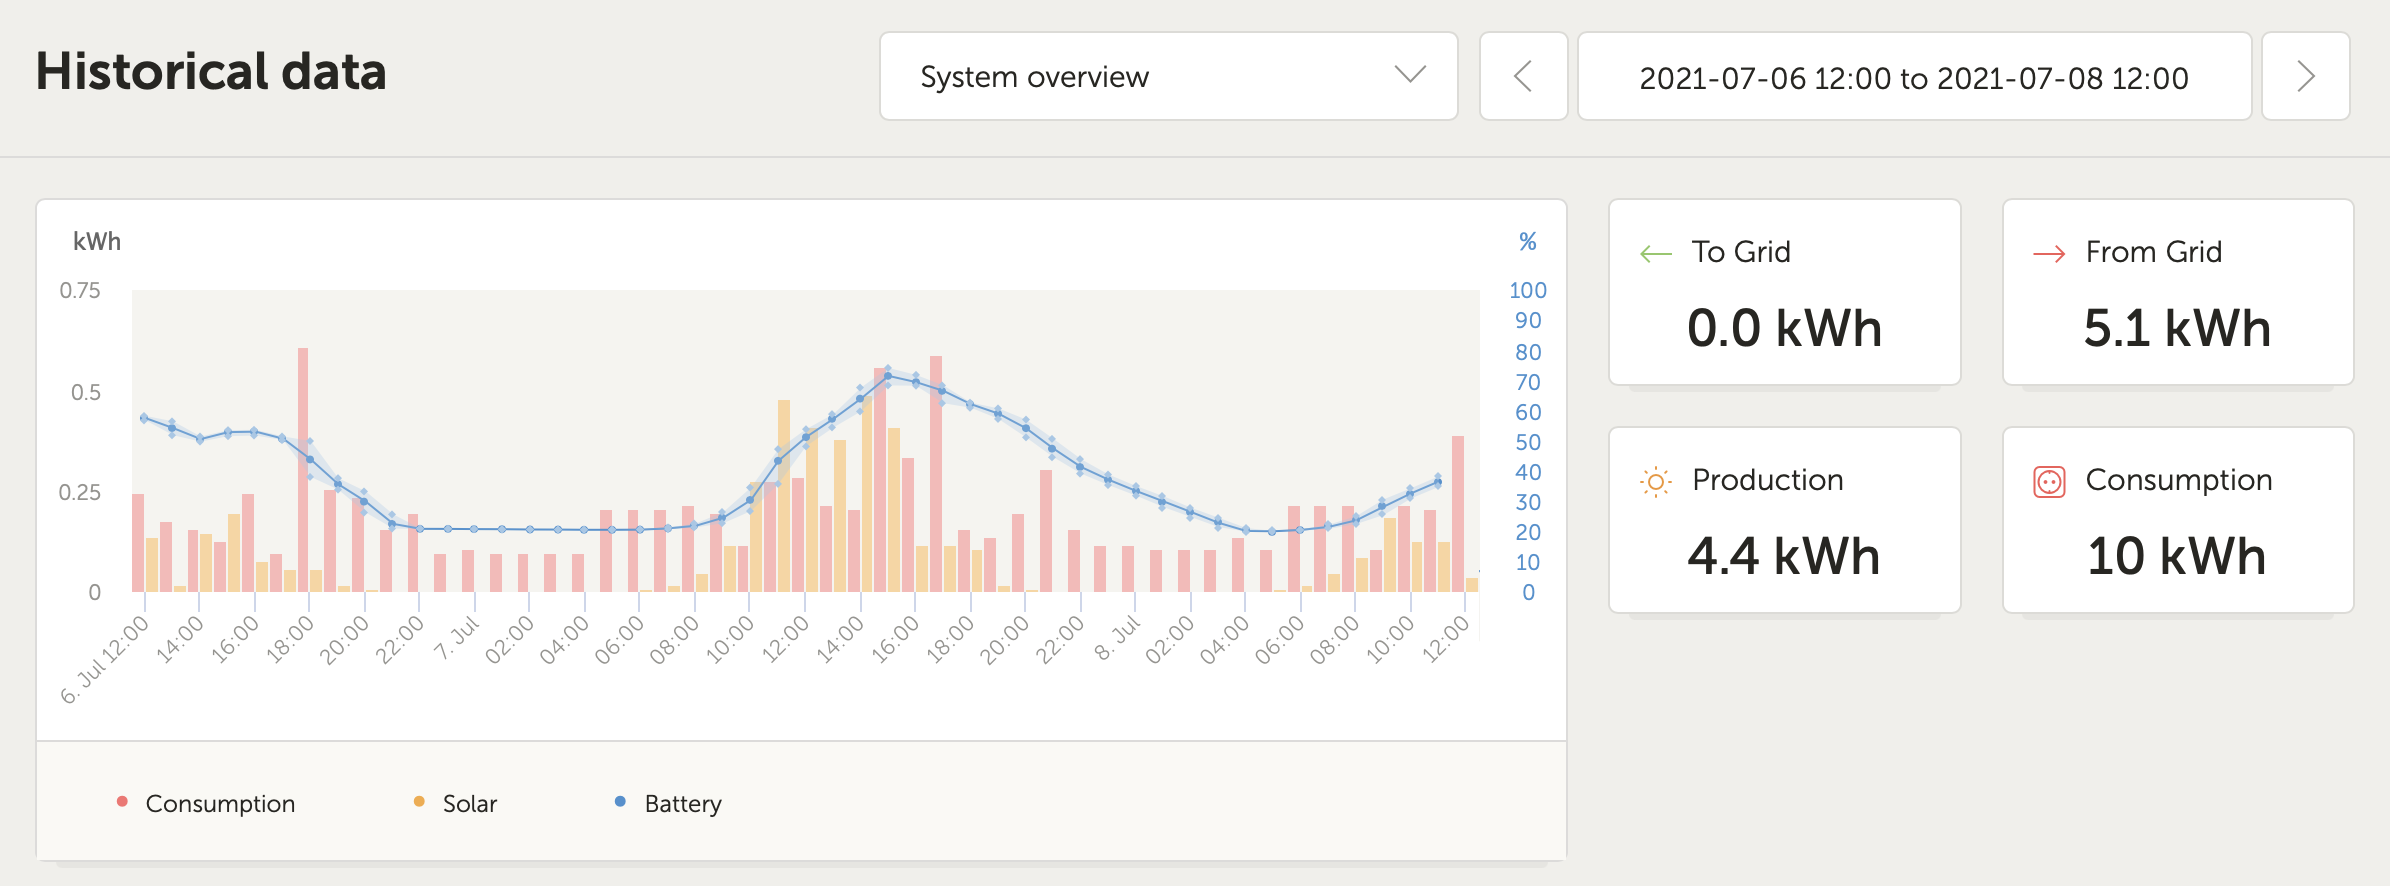
The same range < 48 h - also From Grid, but 2 hours later: 5.1kWh (5.1 is correct)

1625768779202.png


now - the selected period 49 h - From Grid now 7.4 kWh - this is wrong (5.1 is correct)

1625768955260.png


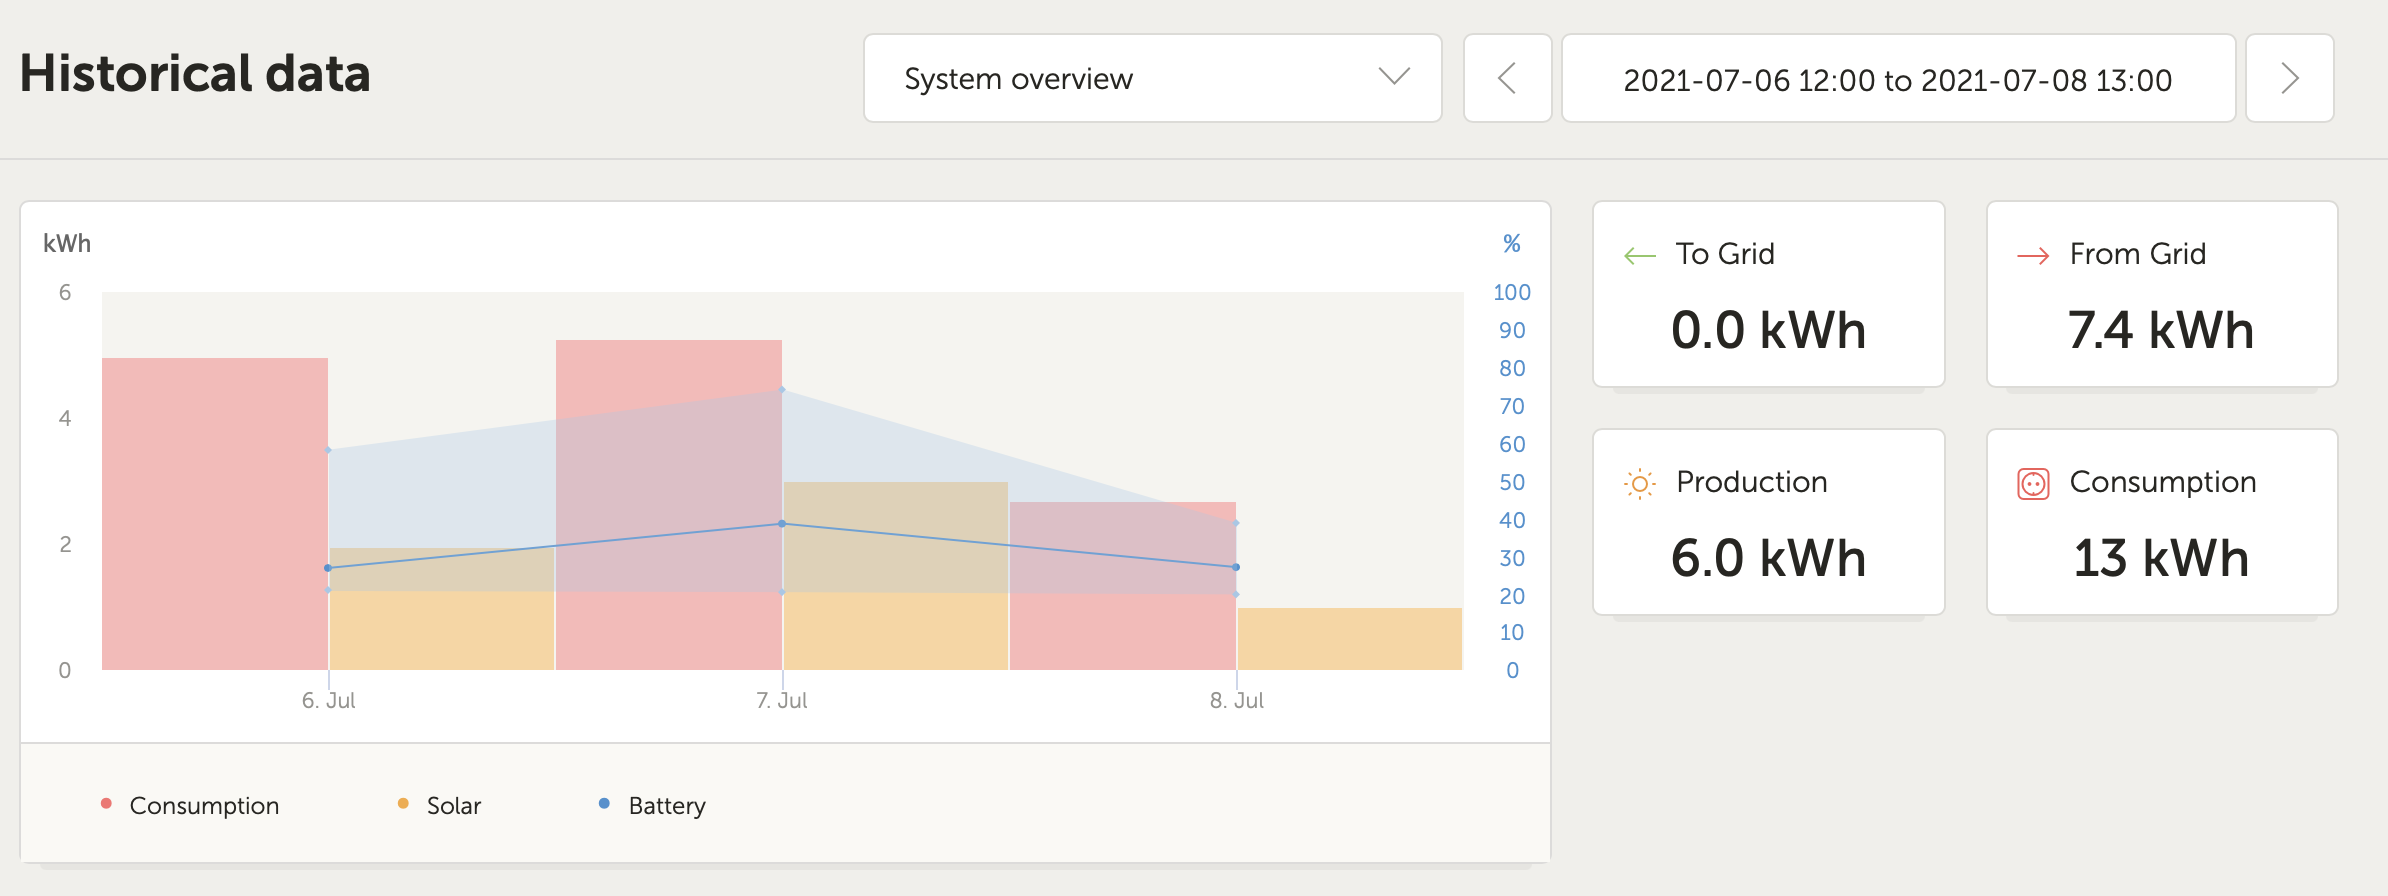
Where does the difference of 2.3 kWh come from? The error can be reproduced with all days.

P.S.: I am totally excited about Victron Energy's products. :-)

VRM
1625768680797.png (219.7 KiB)
1625768779202.png (215.9 KiB)
1625768955260.png (156.6 KiB)
2 |3000

Up to 8 attachments (including images) can be used with a maximum of 190.8 MiB each and 286.6 MiB total.

1 Answer
Teun Lassche avatar image
Teun Lassche answered ·

Hi @dr_schliwago

I totally understand your question! It is caused by the fact that as soon we switch the view to days instead of hours we only show full days in the chart, which means you see all of 6 July in the chart

1 comment
2 |3000

Up to 8 attachments (including images) can be used with a maximum of 190.8 MiB each and 286.6 MiB total.

dr-schliwago avatar image dr-schliwago commented ·

Thank you very much for your quick response.

2,3 kWh are between 00:00 and 12:00 :-)

1625826982479.png


0 Likes 0 ·
1625826982479.png (167.5 KiB)