Hello everybody,
I use Grafana professionally to monitor servers in our data center and servers of our customers.
Since our data center should use 100% photovoltaics, I came to Victron Energy. The test project was the expansion of our mobile home with all the necessary components: battery, MPPT solar charge controller, inverter, shunt and other things.
Victron Energy offers a fantastic interface with VRM. I wanted to see more data and created a Grafana dashboard.
I published this dashboard at Grafana. Everyone is welcome to load the dashboard and see how I set up the displays and how the values are calculated. Maybe you can find some ideas for your own installation.
I am very happy if other ideas are proposed here and I will try to implement them.
Grafana dashboard: https://grafana.com/grafana/dashboards/14400
greetings
Ulrich
asked
My Grafana Dashboard free to use
You have noted that Gafana can be installed without Docker. I think this is a good idea. On the Grafana website it has a direct install to Windows. What was the purpose of Docker? What will I lose if I use the direct install method? Influx is a database?
Hi mresman,
This is my article with script to install all needed components on Windows.
Did you need help? Hask there in the comments.
Yes, InfluxDB is the database.
Docker is a convenience that encapsulates the separate services (InfluxDB, Grafana etc)... as an alternative to installing directly in the OS.
Why? For example; I recently had some problems with my Raspberry Pi OS, so rebuilt the OS booting from an SSD instead of an SD card. Because I had made the smart decision to go Docker I didn't have to spend the time reinstalling InfluxDB, Grafana on the new OS.,. instead I just copied the docker-compose file to the new machine and started the Docker machines up. Simple. Saving re-work
There has been a significant movement recently in IT away from painstakingly hand building up machines (Pets) to machines configured by code (Cattle). While the setup up between Pets & Cattle is similar.. the "Cattle" is better over time in terms of significantly lower effort to maintain, upgrade, replicate etc.
In short the Docker approach is usually considered better IT professional practice.
That is a cool project, lots of work gone into it I expect, and it looks like much still to do, based on your comments and the depreciated component warnings...
Some bits didn't load well or at all for me... Others were nice and responsive but my network here is only 3G and a bit flakey occasionally.
So Docker is essentially a VM?
... and I guess capable of snapshotting as a backup and recovery strategy?
Interesting if that is correct...
I am looking at a small, getting ever bigger as they do, project now to deploy Zerotier, iptables (to achieve a local NAT service and a bit of security), and NodeRed for data acquisition and also control on smaller installations, on a bunch of sites with all kinds of network challenge's, GCNAT being the biggest pain, which typically forces us to use satellite, or an expensive M2M private APN.
To be fair much of this, the detail, is new to me but if a single Docker build could be deployed on a variety of host platforms that would be pretty cool and worth a significant learning curve.
My test-bed is my off grid home... Victron, BYD, Ultramax, Home assistant integration, and several random bits of code in, or planned to be in, PLC's and / or ESP32's, and the like.
My network is Mikrotik but isn't big enough to warrant routers capable of hosting ZeroTier and even if it were, I still need Node red as a minimum on production sites.
I have loads of questions RE Grafana, basic stuff I expect, The first being can it be used for none graph/gauge pages/controls, and thus be used as an HMI, along side its obvious data presentation capabilities?
I am thinking NodeRed Dashboard 2 right now, which looks like it is going to be good and flexible, although its in the early stages right now, and still has many bugs and omission's. It might be interesting to look at framed panels, embedding the functionality of one in the other if neither can tick all the boxes...
Also... this literally just popped into my head... Influx hosted on multiple network nodes/servers, RPI 5's or windows machines in my case, as a fault tolerant DB cluster? The nodes will be there to collect local data anyway, so a distributed cluster would make sense, even if only for the metadata and summery stuff, as opposed to all the fast granular data. Is that even a thing? (I know other databases can work that way, although that is about all I know in terms of detail, other than a bit of basic SQL stuff)
Looking forward to talking if you have the time. I always enjoy learning, even when looking silly was the precursor:-)
Cheers,
Al
Yes, there is a lot of work involved. I solved a problem in InfluxDB 2 in this dashboard that one of the developers said was unsolvable. :-)
The error messages on a few panels are due to Grafana no longer supporting a deprecated API in the future, so the panels need to be updated. I didn't program these, so I'm dependent on updates.
I've clearly separated different tasks:
**Data Collection:** MQTT, Loki, Webhook, MinIO, Prometheus
**Data Forwarding:** NodeRED
**Database:** InfluxDB 1 and 2
**Visualization:** Grafana (NodeRED is too simple for me.)
Now, you can address the individual points.
VictronEnergy has a tool to import data from VRM into InfluxDB1. The travel data is written from CSS via the MinIO interface into InfluxDB2. Prometheus collects information about my network.
NodeRED reads data from MQTT and writes it into InfluxDB.
Grafana reads all data from InfluxDB 1 and 2 and Prometheus and displays them in dashboards. Multiple data sources can be combined in one panel.
Select "last 30 days" as the time range in my dashboard, and you can see my trip to Tuscany. There are thousands of data points. To process them quickly, computational power is necessary. I run each service on its own Windows server. If you disable the 10-second refresh (top right), you can zoom into the route and see which side of the street I was driving on. Every second, the complete status is transmitted, and the data goes back over a year.
Hello @Ulrich. I have found your post, and I find it very useful for my solution. I am new on this topic of Grafana, and I would like to go deep on it to customize a dashboard. I have installed a system to supply a telecom RBS on DC without inverter just having a SmartSolar MPPT RS 450/100-Tr. Actually the system works pretty well but I need to customize the dashboard to show solar yield, consumption from grid through rectifiers, and the RBS load daily consumption. So the idea is to show the overall solar contribution to the consumption. I can measure the grid consumption with an energy meter but I might calculate taking information from solar charger end energy meter for the RBS consumption. I will study Grafana and as I said I am new on this topic but looks like I is necessary in this case. Thank you for sharing your project.
Thank you for this, I tried, and ended up using this as the base for my own dahsboard.
screenshot(s) would be nice ;-)
found it... didn't see it in the description
Nice! Thats a lot of data.
Thank you Ulrich. this is awesome.
Hello Ulrich,
I have several questions regarding Victron-Grafana dashboard. How can I reach out to you??
Hi @Ulrich
I have tried to download your dashboard so I can see how you managed to extract kwh values from time series point in time values such as "vebus/Ac/ActiveIn/L1/P".
When I have used the INTEGRAL function, the results vary widely as each SELECT occurs.
Download of your dashboard had a problem in that it kept asking for a datasource for "__expr__" which I could not provide.
Anyway, I examined the json version and noticed that you are also using the INTEGRAL function with MATH "/3600/1000" formula to produce what appears to be kwh values.
So I tried to replicate what you have done but I get the same varying results as each SELECT occurs just with more decimal places :-)
I eventually stumbled across setting the Max Data Points = 1 in Query Options and the result is far more stable but does not match the result from VRM Portal by a large margin.
This what I have in Edit Panel:-
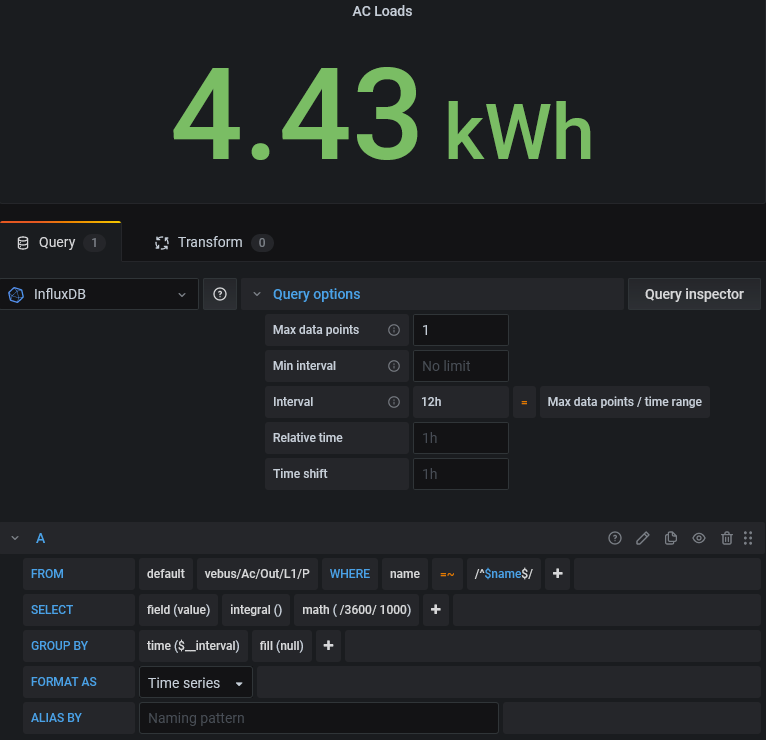
And this is the resulting SELECT statement:-
SELECT integral("value") /3600/1000 FROM "vebus/Ac/Out/L1/P" WHERE ("name" =~ /^VRM Portal Id$/) AND time >= now() - 12h GROUP BY time(12h) fill(null)
Any suggestions would be appreciated.
Awesome... or at least well on its way to being. Is all the template code editable from within the dashboard when you are logged in, as it appears to be. Cool concept if it is.
Is it all from scratch or are there templates to drop min the basic stuff that you can then customize?
It makes my polity few gauges and a graph in Node Red's original dashboard look positively childish...
I think all the errors I am seeing are because I can click on stuff that I am not authorized to modify.
I assume all that will be hidden in due course, from unauthenticated users.
Am I right in assuming that you could render pretty much anything with the correct JSON/JSONata/HTML combination? how about pushing data/states back to NodeRed, preferably directly but I guess you could go via an events table of some sort that served as a gateway...
I am thinking, switches and analogue values for setpoints mainly.
Vector graphics, SVG and the like, preferably with animation, is that possible?
Yes, that's how Grafana works. You can query everything from various data sources. In this dashboard, I mainly use InfluxDB, particularly versions 1 and 2. Before InfluxDB, there's NodeRED to write data from MQTT into InfluxDB.
As long as you are not logged in, some things are not allowed. But each panel has three dots in the top left corner where you can view the JSON.
Isn't NodeRED also working on a new Dashboard 2.0? I have it enabled in my Home Assistant and it offers a lot of new possibilities. However, Grafana certainly looks better and is more powerful.
Yes, Grafana allows you to query everything; there are many plugins for (almost) all data sources. https://grafana.com/grafana/plugins/data-source-plugins/?plcmt=nav-solutions-cta1
Grafana also allows you to pass data along, so you can create switches, etc. These can then be further processed with NodeRED.
Vector graphics and other animations (AJAX) are possible.
Have fun with Grafana.
Thanks for the clarification. Dashboard 2, Yes I have just added that but haven't played with it yet. The project seems to be moving quickly and based on what I have seen thus far, looks like it will have significantly batter capabilities, out of the box as it were, than the original dashboard. It seems verry buggy right now but that is the nature of new.
I know you were always able to do loads of stuff with the template node but having the rime to do it is quite another matter.
Personally I am looking for a balance between reasonably rapid deployment of some basic stuff and the ability to modify or augment the out of the box components when I need something a bit different.
If it looks great all the better... I love the interactivity of the Grafana data displays, the cursors and drilldown options are exactly what is required when managing and adjusting a hydro installation.
If I can add some very basic graphics, lines and boxes basically, and some buttons, I am pretty sure the rest of the functionality I would want, alarm and event handling for example, could be handled in tabular form.
Did you see my post/question earlier RE Docker... "So Docker is essentially a VM?"
I can see you have been busy, me too, and thought it easier to point you back there as opposed to saying everything again...
Are my assumptions anywhere near?
I don't need much detail right now, just looking for direction, and your comment on preferred deployment methodology pricked my interest.
I am literally looking for a way to deploy the same set of functional units on both windows, where I also need a seat with windows applications on site, and a Raspberry, or other SBC, when the windows part isn't required.
You sound like the guy to ask...
Since I consider Windows Server as my focus among all operating systems, it makes sense for me to install everything natively on Windows Server. I run a small data center with VMware and various Windows Servers. My company develops software under Windows.
I am not a Docker specialist. Docker is used, for example, by Home Assistant to encapsulate extensions. If an error occurs, the extension can simply be deactivated without disturbing the base system. This is very useful for Home Assistant. For my environment, it is not useful. When using a dedicated server, you can update the application whenever you want. If you use a Docker image, you have to wait for the creator to update the application. However, it is faster to switch between versions because the configurations are stored centrally.
Using services like SQL Server, MQTT, or NodeRED as Docker containers on a Raspberry Pi is certainly easier than installing and using all applications manually. However, the performance of a Raspberry Pi is generally limited. An SD card is not suitable as storage for a database.
Raspberry PI 5's with 256GB NVME SSD... cant be doing with all those SD Card failures :-)
I must have misread something you said, sorry, I thought you were using Docker.
Thoughts on a distributed Influx DB cluster?
At first, I used Docker and the prepared Docker images for InfluxDB, Grafana, and others. However, I quickly reached limits that necessitated running them on their own.
I don't know the exact use case, but I would assume Grafana. So if Grafana is to be used for visualization, a fast time-series database is recommended, depending on the periods being viewed.
CerboGX can send its data directly to VE. There's a script that queries data from VRM and writes it to InfluxDB1. Alternatively, one could use NodeRED directly on the CerboGX to write the data directly to an InfluxDB.
I myself use this method for TASMOTA devices, which first write to MQTT, then NodeRED reads this data and passes it on to InfluxDB for long-term storage.
Since I run InfluxDB on a virtual Windows machine that is backed up every night, any failure would be quickly resolved. I also use various monitoring tools to oversee the servers. Hopefully, a problem would be detected in time.
Now I'm reading your other reply...
Good volume of work
In my experience Grafana works better if split into smaller dashboards, because performance directly depends from amount of data, displayed in panes
I was thinking the same thing... Cleaner to build I would think, but given that I have never even installed Grafana, let alone tried to use it, that is just a basic assumption without anything to back it up beyond previous general experience of being organized and segregated when it come to system design.
For my Home stuff...
Whatever I do I will run the database / dashboard on a Pi and just use the NodeRed instance loaded on there GX to collect data and control the hardware.
I have no Idea what a Cerbo can handle, resource wise, but I don't want to push it too hard and find out by breaking it.
I just thought of a very specific question...
Is it possible to have influx DB trigger a NodeRed message/flow when new data arrives in a given table, with or without criteria?
Use case...
I want to change some setting on one of my systems. so the new value is input on the dashboard, I am assuming there are panels that can do that but I haven't looked properly yet.
The change is logged and the value then need to be sent to NodeRed, triggering a message, so that it can be communicated to the relevant device.
Knowing the source of the change would be important because the same table could be updated with new values when something external, A GX or VRM perhaps, modifies the same setpoint.
In that case somewhere in the chain the update would need to be dropped to avoid an endless loop.
The same as would occur with a NodeRed dashboard node only sending data modified by the dashboard back to a flow.
Rational...
I am using NodeRed on my Cerbo, attached to my 24V system to monitor and control that system. The same NodeRed instance also used Modbus TCP to monitor and control my 48V system.
If that instance of NodeRed was communicating with Influx DB, on my HA in instance, and triggers were bidirectional, that would avoid the need to separately stream data between NodeRed instances using other means, MQTT/Modbus/Raw TCP, whatever.
To be fair the plan, and thus the question my be ridicules because there is already some functionality that already handles this kind of stuff, I am so new to this that I simply haven't got a clue yet.
If the answer is look at this better method, I will be happy to do that.
Al
Fundamentally, it is possible for InfluxDB to notify of a change. However, I don't find this logical. The task of InfluxDB is to record values in chronological order. Of course, you could note the source in another field and thus manage different data. I do this with several temperature sensors that always report a temperature change, noting which sensor sent the data.
I work a lot with ChatGPT, and this translation was also created with ChatGPT, so it's easier. Maybe your scenario needs to be better described for me to understand it correctly, so I can help better.