question

nhenderson avatar image
nhenderson asked

How to add AC voltage & frequency to CCGX display overview and VRM dashboard

Hi, this might be two questions. I have a CCGX / MultiPlus / BMV / SmartSolar MPPT. AC input is sometimes from a flaky grid and sometimes from a genset. I am having trouble with the genset taking rated load.

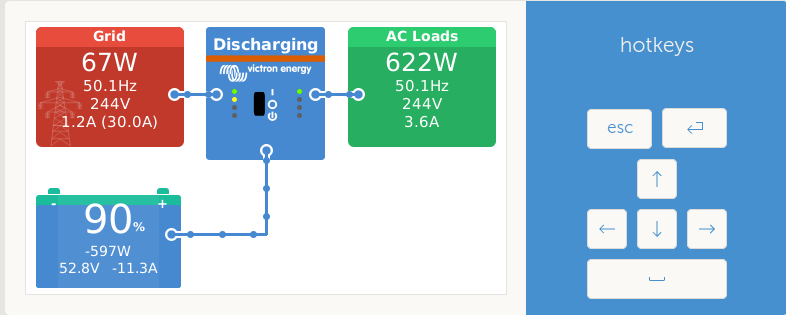
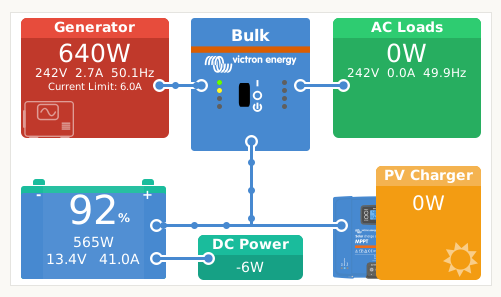
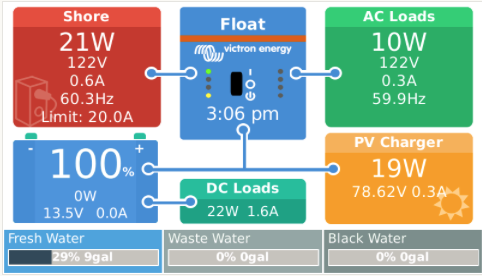
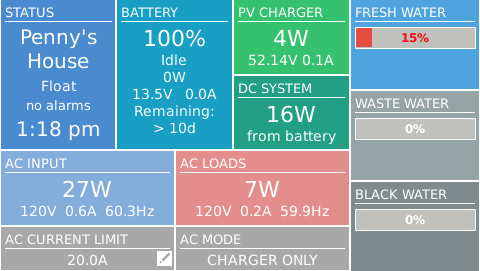
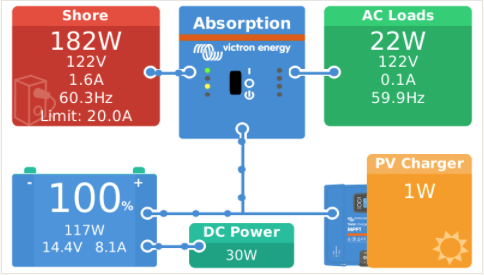
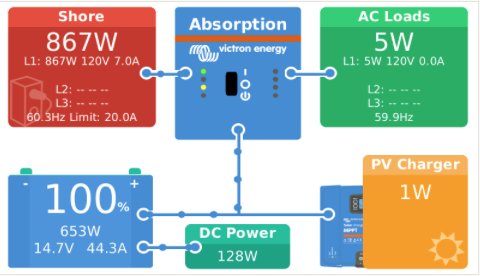
In a similar way that the Battery block on the CCGX display shows watts (+ or -) DC volts and amps as well as % SOC, it would be helpful to have the AC input block(s) on the CCGX display show not just watts but also AC volts and hertz. For the sake of completeness maybe amps also. . Could this be added?


By extension, the same for the VRM dashboard...

VRMCCGX Color Control
2 |3000

Up to 8 attachments (including images) can be used with a maximum of 190.8 MiB each and 286.6 MiB total.

10 Answers
jbakuwel avatar image
jbakuwel answered ·

Hi folks,

See below for a few small modifications that will add frequency, voltage and current (L1) to the Grid and AC loads tiles.

venus-gui-frequency.png

Edit /opt/victronenergy/gui/qml/OverviewAcValues.qml and add the lines shown in bold:

TileText {
  text: root.connection ? root.connection.power.format(0) : ""
  font.pixelSize: 25
}

TileText {
  text: root.connection == sys.acInput ? root.connection.inFrequencyL1.format(1) : root.connection.outFrequencyL1.format(1)
  font.pixelSize: 15
}

TileText {
  text: root.connection == sys.acInput ? root.connection.inVoltageL1.format(0) : root.connection.outVoltageL1.format(0)
  font.pixelSize: 15
}

TileText {
  text: root.connection == sys.acInput ? root.connection.inCurrentL1.format(1) + " (" + root.connection.inCurrentLimit.format(1) + ")" : root.connection.outCurrentL1.format(1)
  font.pixelSize: 15
}

Edit /opt/victronenergy/gui/qml/ObjectAcConnection.qml and add the lines shown in bold:

property VBusItem power: VBusItem { unit: "W" }
	
property VBusItem vebusService:	VBusItem { bind: Utils.path(systemPrefix, "/VebusService") }

property VBusItem outFrequencyL1: VBusItem { bind: Utils.path(vebusService.value, "/Ac/Out/L1/F"); unit: "Hz"}
property VBusItem outVoltageL1:	VBusItem { bind: Utils.path(vebusService.value, "/Ac/Out/L1/V"); unit: "V"}
property VBusItem outCurrentL1:	VBusItem { bind: Utils.path(vebusService.value, "/Ac/Out/L1/I"); unit: "A"}

property VBusItem inFrequencyL1: VBusItem { bind: Utils.path(vebusService.value, "/Ac/ActiveIn/L1/F"); unit: "Hz"}
property VBusItem inVoltageL1: VBusItem { bind: Utils.path(vebusService.value, "/Ac/ActiveIn/L1/V"); unit: "V"}
property VBusItem inCurrentL1: VBusItem { bind: Utils.path(vebusService.value, "/Ac/ActiveIn/L1/I"); unit: "A"}
property VBusItem inCurrentLimit: VBusItem { bind: Utils.path(vebusService.value, "/Ac/ActiveIn/CurrentLimit"); unit: "A"}

Note this is a bit of a not so pretty UI hack. Nevertheless good enough for my purposes. Use at your own risk.

Enjoy!

Jan


8 comments
2 |3000

Up to 8 attachments (including images) can be used with a maximum of 190.8 MiB each and 286.6 MiB total.

Rob Duthie avatar image Rob Duthie commented ·

Hi

Runs perfectly, always wanted this data on the front screen as it can be useful for single phase applications.

I have written a script to update when doing a firmware update so it stays there now.

Regards

Rob D

NZ

0 Likes 0 ·
Mark avatar image Mark ♦♦ commented ·

Thanks for sharing that code Jan. Over the weekend I also had a play around, starting with your code and ended up with this...image.png

0 Likes 0 ·
image.png (36.0 KiB)
nhenderson avatar image nhenderson commented ·

Thank you @jbakuwel, that is exactly what I hoped for for the AC boxes since I am and will always be using a single leg system (I'm sure @Kevin Windrem's more extensive work will be great for others). I guess the other nice-to-have would be voltage, current, and current limit for the PV overview box, in my case a Blue Solar charger... By default it also shows only watts. Unfortunately the way that box is generated seems to be completely different than AC as per your "hack" above - any ideas? ;)

0 Likes 0 ·
jbakuwel avatar image jbakuwel nhenderson commented ·

No worries :-)

It's a bit more involved for things like solar chargers.

You could experiment with something like:

property VBusItem pvVoltage: VBusItem { bind: Utils.path("com.victronenergy.solarcharger.ttyUSB1", "/Pv/V"); unit: "V"}

The issue with these kind of hacks is that you can't be sure the solar charger (in this case) will be on ttyUSB1 after a reboot (nor that it will be the same for someone else). You could run a bash script at boot to figure out on which port the solar charger ended up this time around and use that script to update the qml file, then kill the gui process (it restarts automatically).

And it gets more interesting if you'd have multiple solar chargers.


0 Likes 0 ·
Al avatar image Al jbakuwel commented ·

Wow! Thanks @jbakuwel it's great to have Freq + Voltage Etc, and also useful with AC Ignore to see if there is grid available. It's running fine on my CCGX following the steps above.

I also took the opportunity to increase the overview Ac values font size, as it's hard to see on my 7" tablet, but that only worked for AC in and AC out, now I can't find any QML file which seems to have the PV Charger font size as that's also a bit small and hard to see.

Do you know where the PV font size to edit may be? or @nhenderson@ceml.net did you find it and also manage to add PV data in the box?

Thanks

0 Likes 0 ·
Kevin Windrem avatar image Kevin Windrem Al commented ·

You'll find the "PV Charger" and "PV Inverter" tiles in both OverviewHub.qml and OverviewGridParallel.qml. Which is used depends on your system configuration, mainly (I think) whether or not you have PV inverters connected to either the input and/or output of the Multi/Quatro.

Both locations use OverviewSolarCharger.qml and OverviewSolarInverter.qml for some of the formatting but the power info is in the parent above.

The Solar Charger tile is tall enough for voltage and current but probably not for both PV array numbers AND output numbers. You'd need to search for the dBus service to extract the information.

The Solar Inverter tiles are not tall enough to add individual leg info but there MIGHT be enough space for voltage + current on a single line for single-phase units but font size would be on par with the 11 used in my AC tiles. Frequency information MAY be redundant with that shown in other tiles. So there is a chance.

0 Likes 0 ·
Al avatar image Al Kevin Windrem commented ·

Brilliant! Thanks Kevin, can't believe I didn't see it in OverviewHub.qml under: OverviewSolarCharger I changed pixel size to 34 (Same for my AC Values) and width to 160 to fit better when over 1000w.

Edit* I also edited OverViewSolarCharger.qml Shown in bold, the number below, from its original of 43 to 30.. lower number = wider PV Inverter yellow box

anchors {

bottom: root.bottom

left: blueSolarChargerIcon.left; leftMargin: showChargerIcon ? 30 : 0

right: parent.right

}

I didn't try figuring out how to put charger voltages in etc, and maybe could get messy as although I only have a single Phase / Leg system with DC MPPT's, I have 2 x Ve.direct arrays and 1 x Ve.can array soon to be 2 x Ve.can arrays. The yellow PV box can be increased in height but it didn't look in proportion so I left it.

But now I can see all the key values from my sofa with an old 7" tablet mirrored on the wall. :)

Thanks to all


mobile-view.jpg

0 Likes 0 ·
mobile-view.jpg (44.1 KiB)
jbakuwel avatar image jbakuwel Al commented ·

Hi Al,

You're welcome :-)

I don't know out of the top where that font size is... it could be a default font size too.

Jan

0 Likes 0 ·
Kevin Windrem avatar image
Kevin Windrem answered ·

I had a go at adding tank information to the Flow Overview:

screen-shot-2021-03-17-at-30646-pm.png

There's sufficient space along the bottom for about 4 tanks. After that, you can scroll sideways to see additional tanks.

I also added voltage and current to the PV Charger tile and current to the DC Loads tile. There is even a clock in the middle of the inverter icon. So a lot of the information available in the Mobile Overview is now on the Flow Overview as well.

https://github.com/kwindrem/GuiMods


3 comments
2 |3000

Up to 8 attachments (including images) can be used with a maximum of 190.8 MiB each and 286.6 MiB total.

nhenderson avatar image nhenderson commented ·

Great work Kevin, so easy to install and it works great! I don't have tanks so I skipped the Mobile Overview. It's good to have not only the AC in/out volts/amps details but also PV volts/amps.

0 Likes 0 ·
geomz avatar image geomz commented ·
@Kevin Windrem , I would like to add myself to the chorus of people thankful for the great work you've put into the updated GUI mods above. I found this article by accident-- trying to solve a similar problem as the OP, and this package was nothing short of amazing.

I was steeling myself for digging into package managers, shell scripts and config files, but was impressed with how easy you've made the entire process.
I typically shy away from "just install this random binary on your device and all is well" type stuff :D, but your well-written and clear instructions with complete documentation on what it's doing made that much less... concerning.
I actually just downloaded setuphelper from your github repo, allowed it to auto-install on my GX device, and used the new subsequent menu options to install and configure guimods from there. Couldn't have been easier, and it has everything I was looking to add to the main flow page.
Kudos!! :)

GM

0 Likes 0 ·
geomz avatar image geomz geomz commented ·

...and just a couple of comments, after using it for a little while now,

1) It would be great if the main battery voltage could display 2 decimal places --vs just 1
*honestly, I think Victron should just default to that, especially with Lithium batts.

2) It would be nice if the "Aux/starter Battery" voltage (from a BMV) could be added somewhere on there --although I get that real estate is pretty tight as is


0 Likes 0 ·
jbakuwel avatar image
jbakuwel answered ·

Hi,

+1

I think it would be a very useful addition to the GUI to display input / output VAC and output Hz.

I'm currently having to switch between browser tabs (one Venus GUI, the other a NodeRed GUI) to look at the output frequency (off grid systems). You can look at NodeRed running on something like a Raspberry Pi to build your own dashboard and query the CCGX for the information.

cheers,
Jan

2 |3000

Up to 8 attachments (including images) can be used with a maximum of 190.8 MiB each and 286.6 MiB total.

Kevin Windrem avatar image
Kevin Windrem answered ·

I have created an enhanced Mobile Overview page that displays voltage, current and frequency in the AC in and out tiles as well as other changes to the display. Have a look:

1612942060374.png

https://github.com/kwindrem/GuiMods

I looked into adding some of this to the main page (flow graphic) but there simply isn't enough space.

Also, the changes I made only support a single phase system. Full support for a 2- or 3-phase system would probably require a separate page.

If I recall, the original Mobile Overview page displays power for up to 3 phases but there's no room for voltage and current.


1612942060374.png (46.5 KiB)
4 comments
2 |3000

Up to 8 attachments (including images) can be used with a maximum of 190.8 MiB each and 286.6 MiB total.

Rob Duthie avatar image Rob Duthie commented ·

Hi Kevin

There is another page like this where you could add more information like the 3 phase data than mobile data overview page if required.

Victron page relay1.pdf

We have added a relays page to this as well.

Victron page relay.pdf

When you click or touch this pops ups

Victron page relay2.pdf

To make this all gel or come together would be nice to have the temps under the tanks as the tanks take a lot off space up etc then the relay control on it on page with the alarms?

Regards

Rob D

NZ

0 Likes 0 ·
powerace avatar image powerace Rob Duthie commented ·

Hi Rob,


Those relay switches looks very useful, do you have any code about how to get that done? No need anymore to scroll thru all the menu's to access those switches!

Thanks in advance.

0 Likes 0 ·
Rob Duthie avatar image Rob Duthie powerace commented ·

Hi

Yes i do, there are some data files you need to copy across into certain folders.

What do you have running now for the relays just the standard 1 or 2 for Venus? or you have setup the rapi to run the standard 6 relays and just want to run this page file to show them better etc.?

Regards

Rob D

NZ

0 Likes 0 ·
powerace avatar image powerace Rob Duthie commented ·

I've a RPI3+ running Venus OS and a separate generic 4 channel relay board. Its all working but your solution is much better accessible. So i guess i only have to modify some qml files? I already had a look at them but i'm not that much of a programmer that i understand how it works. But i'm certainly not afraid to edit files ;-)

0 Likes 0 ·
nhenderson avatar image
nhenderson answered ·

Thank you Kevin and others for picking this up. My installation is fixed, consisting of the CCGX, a BMV-712, an MPPT solar charge controller, and a Multi charger/inverter. So the mobile page isn't really appropriate for me.

On the main "flow" page, the Battery icon has SOC% in large font at the top and then W, V, A in smaller font below. However the AC input icon which is the same size, has only W in large font. Would it not be possible to add V, A & Hz in smaller font below that?

Unfortunately I don't have any experience programming for the Venus nor, unfortunately, the several days of experimenting it would take to get started. If @Kevin Windrem were able to take that up it would be a great benefit to the community not to mention me ;)

4 comments
2 |3000

Up to 8 attachments (including images) can be used with a maximum of 190.8 MiB each and 286.6 MiB total.

Kevin Windrem avatar image Kevin Windrem commented ·

That extra space on the flow page is to show power for multiple phases. Yes, it would be possible for SINGLE leg systems (not even split-phase systems) to fit the other information there.

I suppose the additional information could be conditional on the number of leg in the system: 1 leg shows voltage, etc,. 2-3 leg systems only shows power.

What's the consensus on this compromise?

The Tiles Overview page is yet another view. It's simpler than the Mobile Overview with more space in the tiles. The bottom half scrolls horizontally for additional information. (My system shows 6 tiles: AC In, AC Out, PV Charger, DC System and the victron logo.) The AC Tiles could potentially be made wider to support voltage and current for multiple leg systems as I did on the Mobile Overview. A single frequency display should be sufficient since all legs are at the same frequency.

A third option would be to create yet another overview page with the desired information.

0 Likes 0 ·
Kevin Windrem avatar image Kevin Windrem commented ·

I did a mock-up to see what things would look like in a 3-phase system.screen-shot-2021-02-13-at-100536-am.png

It's busy and crowded but might be workable. I'm showing (I think) the maximum number of characters for each field so a real system would be less crowded.

One and two legs would fit in the original box height.

The "ESS" thing is an empty ESS reason message that normally appears under the AC Input box but would cover the bottom row with it expanded.

Obviously, the frequency information for separate phases is redundant and could be eliminated but didn't want to take up yet another line for a single frequency number.

Comments?

0 Likes 0 ·
nhenderson avatar image nhenderson Kevin Windrem commented ·

Thanks very much Kevin. To me that would be workable, and certainly with a single-phase system it would be much simpler.

0 Likes 0 ·
Kevin Windrem avatar image Kevin Windrem nhenderson commented ·

I've done some checking and doing this right is beyond my understanding of the system. Here's what I know:

The content of the AC in and out bubbles is filled in through a series of modules starting at main.qml, then OverviewHub.qml or OverviewGridParallel.qml.

The values are finally drawn in OverviewAcValues.qml. It would be relatively easy to add voltage, current and frequency to this hierarchy but there is no source for the data.

The power information is collected from systemcalc into "theSystem" in HubData.qml. Again, adding voltage, current and frequency here would be relatively easy.

Systemcalc accumulates data from the various inverters in the system creating a total for all parallel units, factoring in AC PV contributions. This is where voltage, current and frequency should be added but I have not been able to follow the logic.

It would probably be possible to add voltage and current somewhere else in the system but gathering data from parallel connected inverters could be a major undertaking there.

Failing to address parallel connected inverters would display incorrect information when there were inverters in parallel.

I also have no way to test an changes I make in support of multiple phases and/or parallel connected Multis

So I'm tabling this until someone can educate me of the workings of systemcalc. I do think providing voltage current and frequency accumulation (not just power) in systemcalc would be a good idea overall.

0 Likes 0 ·
nhenderson avatar image
nhenderson answered ·

Thanks @Kevin Windrem. I suspect a large majority of systems are single-leg (at least outside the US/CA where split phase is used). At the missionary hospital where I serve, we have a 15 kVA Victron charger/inverter system (essentially an online UPS) but nonetheless single phase/single-leg.

The main "flow" overview page is the only one I use since it has all the information that is on the other 2 pages I use, the Tiles page and the Generator page (which is actually either generator or mains, switched outside the system, since the Multi has only 1 AC input; I should have bought a Quattro).

Would it be possible to add an additional custom page applicable only to single-leg systems, identical to the main page but with V/A/Hz added?

1 comment
2 |3000

Up to 8 attachments (including images) can be used with a maximum of 190.8 MiB each and 286.6 MiB total.

Kevin Windrem avatar image Kevin Windrem commented ·

I haven't looked at the code, but believe it would be easier to make the existing main page conditional on single/multi leg systems.

0 Likes 0 ·
Kevin Windrem avatar image
Kevin Windrem answered ·

I was inspired by jbakqwel's work and made a few tweaks.

Jan's changes only work for single-leg systems and I'm guessing a fair number of systems are at least split-phase (2 legs). I found space to show power, voltage, current for all three legs and a single frequency and input current limit line at the bottom.

flow-overview-1-leg-screen-shot.png

For single leg systems, all parameters are shown on their own line like in Jan's version. For 2 and 3 leg systems, I squeeze power, voltage and frequency on a single line.

flow-overview-3-leg-screen-shot.png

I only have a single-leg system so this last diagram shows no data for L2 and L3 but does show actual data for L1.

I've added this to my GuiMods:

https://github.com/kwindrem/GuiMods

WARNING: I have only tested this on a single-leg system with one Multi. I don't know how this will work on a multi-leg system but have done my best to connect the GUI to actual parameters. I also don't know how a system with multiple Multis/Quatros on each phase will work. Do the VebusService parameters include current from all Multis/Quatros?????

If you give this a try on a larger system, let me know how it works and if I need to make any changes.


2 comments
2 |3000

Up to 8 attachments (including images) can be used with a maximum of 190.8 MiB each and 286.6 MiB total.

Ingo avatar image Ingo commented ·

Looks good @Kevin Windrem Any chance to get a variable other than 'System' on the GUI? I want to also add the Managed CAN battery temperature as a third line below Voltage/Current.

0 Likes 0 ·
Kevin Windrem avatar image Kevin Windrem commented ·

It turns out there are 7 connections that may result in power tiles in the flow overview.

Jan identified two of them:

  • sys.acInput (Multi/Quatro input)
  • sys.acLoad (Multi/Quatro output)

The other 5 are:

  • sys.pvOnAcIn1
  • sys.pvOnAcIn2
  • sys.pvOnAcOut
  • sys.acInLoad (aka non-critical loads)
  • sys.acOutLoad (aka critical loads)

This is where things get lots more complicated. The first to connections are associated with the Multi/Quatro and have dBus parameters. The next three are associated with PV inverters connected to either the Multi/Ouatro input or output.

The last two incoporate the PV inverters, AC input power (grid/generator), grid meters and maybe some other bits. System calc handles the power calculations and I'm not sure how to gather the appropriate information to calculate currents.

As Jan's and my mods stand currently, the currents shown in the tiles are likely incorrect if PV inverters are connected to the Multi/Quatro in or out or if loads are connected directly to the grid. (Not sure if Quatros provide power and current for both outputs.)

0 Likes 0 ·
Kevin Windrem avatar image
Kevin Windrem answered ·

I have rewritten my code to eliminate incorrect values. Only acInput and acLoad connections have related voltage, current and frequency parameters, so other tiles will not show those values. My previous code showed something but the values were incorrect!!!!

https://github.com/kwindrem/GuiMods

2 |3000

Up to 8 attachments (including images) can be used with a maximum of 190.8 MiB each and 286.6 MiB total.

nhenderson avatar image
nhenderson answered ·

So what I found, in OverviewHub.qml and OverviewGridParallel.qml, in OverviewSolarCharger{ } is:

               values: TileText {
                        y: 2
                        text: sys.pvCharger.power.format(0)
                        font.pixelSize: 20
               }

Unfortunately that is completely different from the Tile { } entity in the AC hacks, and I have no idea how to integrate @jbakuwel's suggestion of

property VBusItem pvVoltage: VBusItem { bind: Utils.path("com.victronenergy.solarcharger.ttyUSB1", "/Pv/V"); unit: "V"}

Sorry but I have no real idea how this stuff actually works, just copying and pasting! Thankful for the great progress on the AC side.

2 comments
2 |3000

Up to 8 attachments (including images) can be used with a maximum of 190.8 MiB each and 286.6 MiB total.

Kevin Windrem avatar image Kevin Windrem commented ·

You can add the property statement at the top of the file with the other property statements, BUT it's not that easy.

system-calc collects information from the various devices and republishes it on dBus so there's a central place for other users of that data can look, but system-calc does not provide voltage, current, etc -- just power values. So these other values need to be collected from physical devices.

system-calc provides a dBus service parameter for the inverter/charger so those parameters are easier to collect which is what Jan did for the AC parameters.

No such hook for the solar charger exists, and the actual service could change based on the order the system discovers USB devices (i.e., "ttyUSB1" might be different tomorrow). So you'd need to search the dBus for the service. There could also be more than one solar charge controller in which case, you'd need to accumulate data for all of them.

system-calc does this collection chore and would be the best place to add voltage, current, etc. I'm afraid this is beyond my capabilities and may not be a good idea in general due to increased processing time.

Like you, I'm at the copy/paste stage of knowledge especially in the QML world so if I can't find an example of what I need to do, I get stuck.

0 Likes 0 ·
jbakuwel avatar image jbakuwel commented ·

Hi @nhenderson@ceml.net,

The property statement creates an VBusItem object with the name "pvVoltage". You need to refer to that name in your TileText. Good luck!

Jan

0 Likes 0 ·
darius avatar image
darius answered ·

I started with this and ended up with the following:

TileText {
    property VBusItem inI1: VBusItem { bind: Utils.path(sys.vebusPrefix, "/Ac/ActiveIn/L1/I"); unit: "A" }
    text: inI1.format(1)
    font.pixelSize: 15
}

ie this creates a property on the TileText called "inI1" which is bound to the dbus value reported by my inverter reporting AC input current.

So I could view how much current I was drawing from the wall (and also show voltage and frequency because why not :)

For each item, you can bind arbitrary dbus objects, and you can discover those by running:

dbus -y com.victronenergy.vebus.ttyUSB0 / GetValue

sys.vebusPrefix will be com.victronenergy.vebus.ttyUSB0 (or something similar)

2 |3000

Up to 8 attachments (including images) can be used with a maximum of 190.8 MiB each and 286.6 MiB total.