question

ejrossouw avatar image
ejrossouw asked

VRM dashboad system consumption does not include "grid to battery" consumption

Hi everyone.

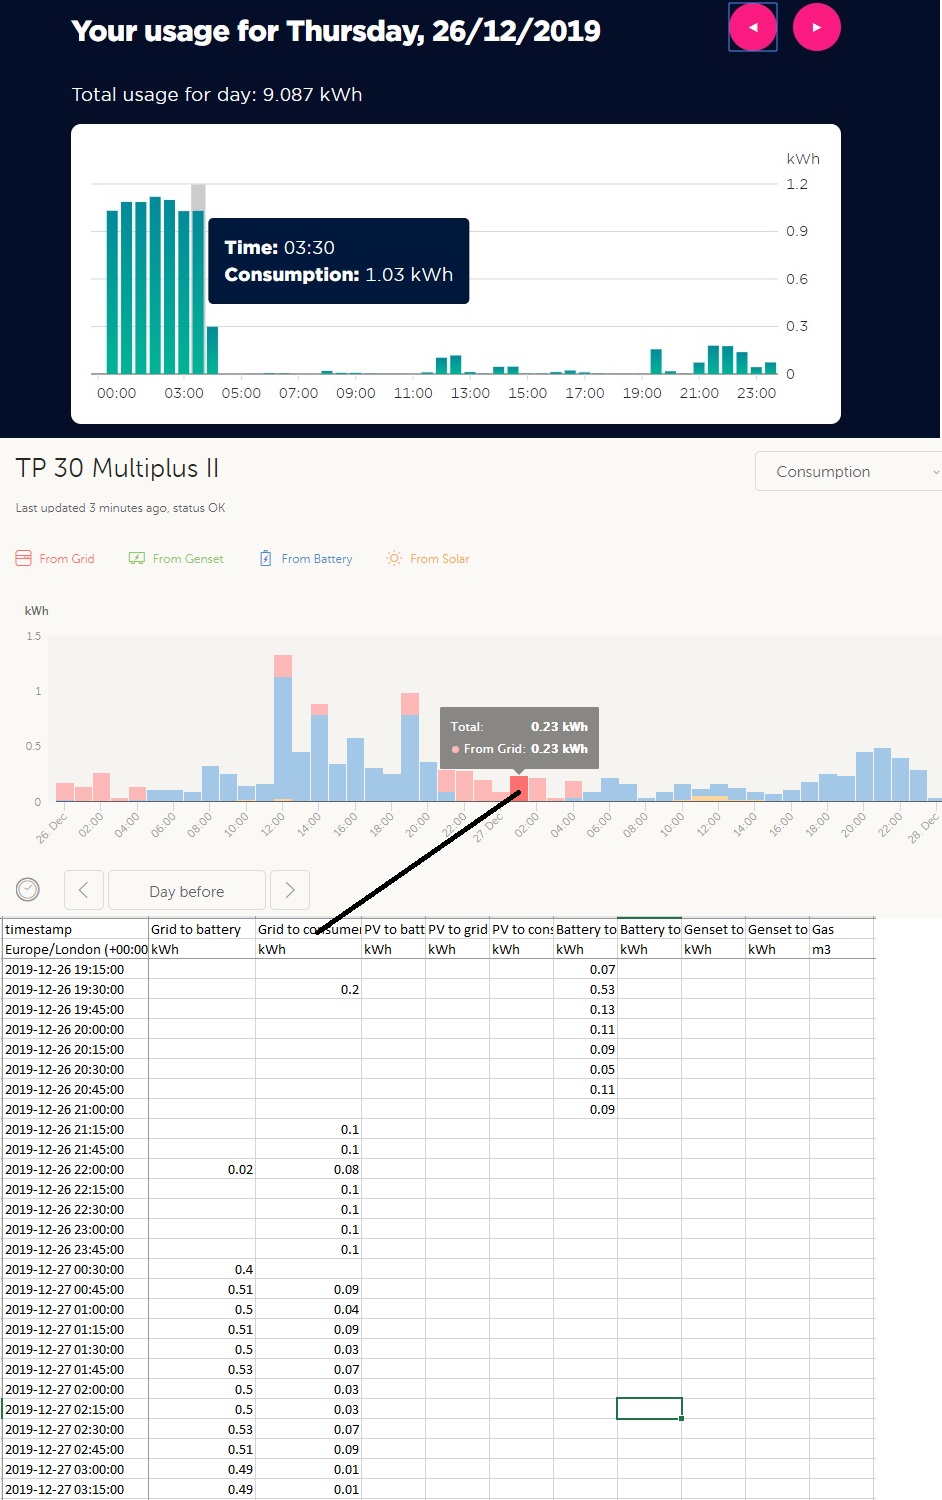
VRM is very useful, although I would like to think that "system consumption" should reflect the FULL SYSTEM picture meaning "grid to bat" and "grid to consumers" combined. From the dashboard I want to promote ESS solutions, however as the dashboard shown of one of my installations, I am missing nearly 6.5kWh from grid which does not reflect the full truth. As you can see from the attached my consumption it only shows the consumers, but not the 6kWh consumed by the battery when charging.

Can the graphs be easily updated to either show an additional "grid to battery" like solar etc. component or show a grid system total? For promoting ESS solutions this will be of great value without having to constantly update my own graphs and show it separately. I like to have the full truth on hand as does catch people's attention demonstrationg VRM.

What are the thoughts from the community on this?

Regards
VRM
2 |3000

Up to 8 attachments (including images) can be used with a maximum of 190.8 MiB each and 286.6 MiB total.

2 Answers
Guy Stewart (Victron Community Manager) avatar image
Guy Stewart (Victron Community Manager) answered ·

Hi @ejrossouw,

Thanks for the feedback, the VRM team is in full swing to further improve the platform. I recently got to sit down for a full day round table meeting with the developers to address issues like this.

I agree that this can be confusing, the same issue arises when a generator is used to charge batteries.

This is not such an easy problem to solve in a way that is visually intuitive, keeping things simple to understand while showing the energy flow.

Adding an additional two colours (Grid to battery, and generator to battery) would make that current consumption graph a lot more confusing.

"System consumption" should reflect the FULL SYSTEM picture meaning "grid to bat" and "grid to consumers" combined.

The problem with this suggestion is that batteries do not really 'consume' energy, merely store it for later consumption by the loads, which is also counted.

If grid to bat was just added to grid to consumers, and bat to consumers, you would see double the actual kWh's that were consumed by the real loads, as consumed by the site. Once into the battery, and again coming out. I don't think that is what most people would expect either.

As you have seen, for now the information is available either in the kWh export file, and in the advanced tab for those that need the additional complexity/detail.

In the future, there are improvements on the way to VRM to help with ESS, and other specific systems that will provide more specific insight into what is going on, while hopefully also making things even more intuitive.

3 comments
2 |3000

Up to 8 attachments (including images) can be used with a maximum of 190.8 MiB each and 286.6 MiB total.

ejrossouw avatar image ejrossouw commented ·

Thank you for the prompt response. I totally appreciate the "technical view and valued explanation". For ESS end users in my opinion, at the high level, they only realy want to see what did my solar produce, what is the total I took from the grid and am I paying for or not in the end. Regardless I am sure you will have a long wish list and look forward to any enhancements.

0 Likes 0 ·
Guy Stewart (Victron Community Manager) avatar image Guy Stewart (Victron Community Manager) ♦♦ ejrossouw commented ·

I agree, @ejrossouw.

It is a challenge with the current VRM that supports ALL Victron system types, and that means compromises across the board.

For example the people with Marine systems nearly always have multiple batteries, and they want to see each of their batteries clearly laid out, but most systems overall only have one battery.

I wrote this short brief about ESS customers to help with the next generation of VRM design, please have a read of it, and if you can think of how to improve it, now might be the last chance for a while :)

> # Specific User Requirements for ESS systems (Grid & Solar)

The reason these people have a battery is to store excess solar power: rather than feeding it all back into the grid; they store it in the battery, to use it in the evening & night. They don’t require the battery to have power from day to day; since they have a reliable grid already.

Ofcourse, now that they have a battery, its also nice to help overcome grid outages.

Another reason for ESS is if the grid is not sufficient to meet power demands, the ESS system will support the grid.

They want to see:

kWh imports, exports in kWh per day, week, month, year. Possible also in cost/savings

Solar Production if they have it (kWh in graph) (Watts now)

Loads

Is the Grid connected / how long disconnected / Grid uptime % / Time on backup power

Autonomy (how long to go before the system shuts down)

0 Likes 0 ·
Warwick Bruce Chapman avatar image Warwick Bruce Chapman Guy Stewart (Victron Community Manager) ♦♦ commented ·

Massive +1 for this especially autonomy even if just a rough estimate that is improved with actual data over time.

0 Likes 0 ·
Jaan Särg avatar image
Jaan Särg answered ·

Hi,

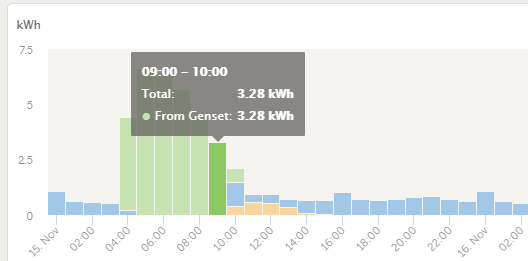
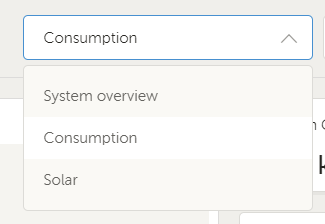
Would it be possible to separate AC consumption on the Dashboard screen? For example adding a one more option for the ribbon? At the moment it is very confusing to see the real consumption, only can be seen when downloading the excel.

1605534562392.png

1605534486394.png


1605534486394.png (6.0 KiB)
1605534562392.png (13.2 KiB)
2 |3000

Up to 8 attachments (including images) can be used with a maximum of 190.8 MiB each and 286.6 MiB total.