question

Barbara (Victron Energy) avatar image
Barbara (Victron Energy) asked

Introducing improved mini-graphs on VRM Installation Overview

Release Announcement: New mini-graphs Feature on VRM Installation Overview


We are happy to announce the latest enhancement to our VRM platform – the introduction of mini-graphs on the installation overview!

cleanshot-2024-06-14-at-140632.jpg


What’s New?
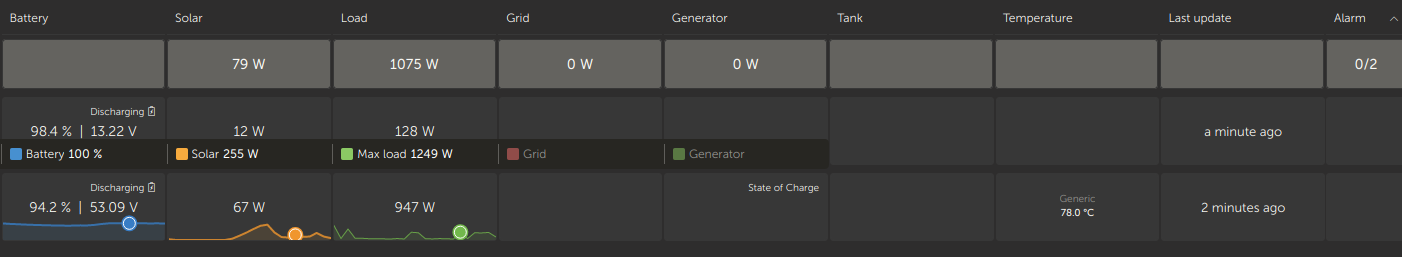
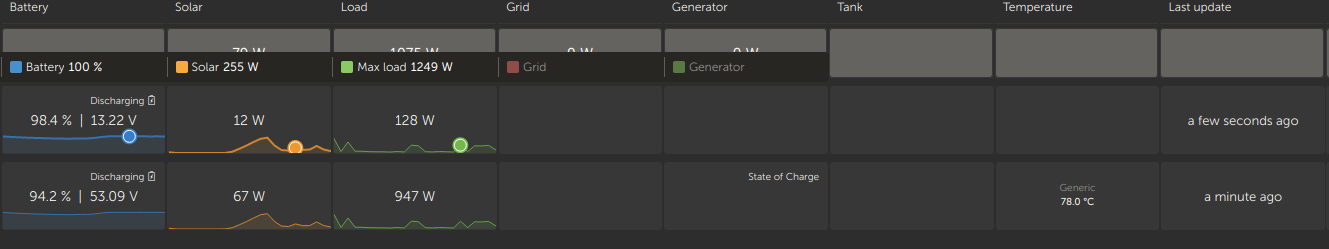
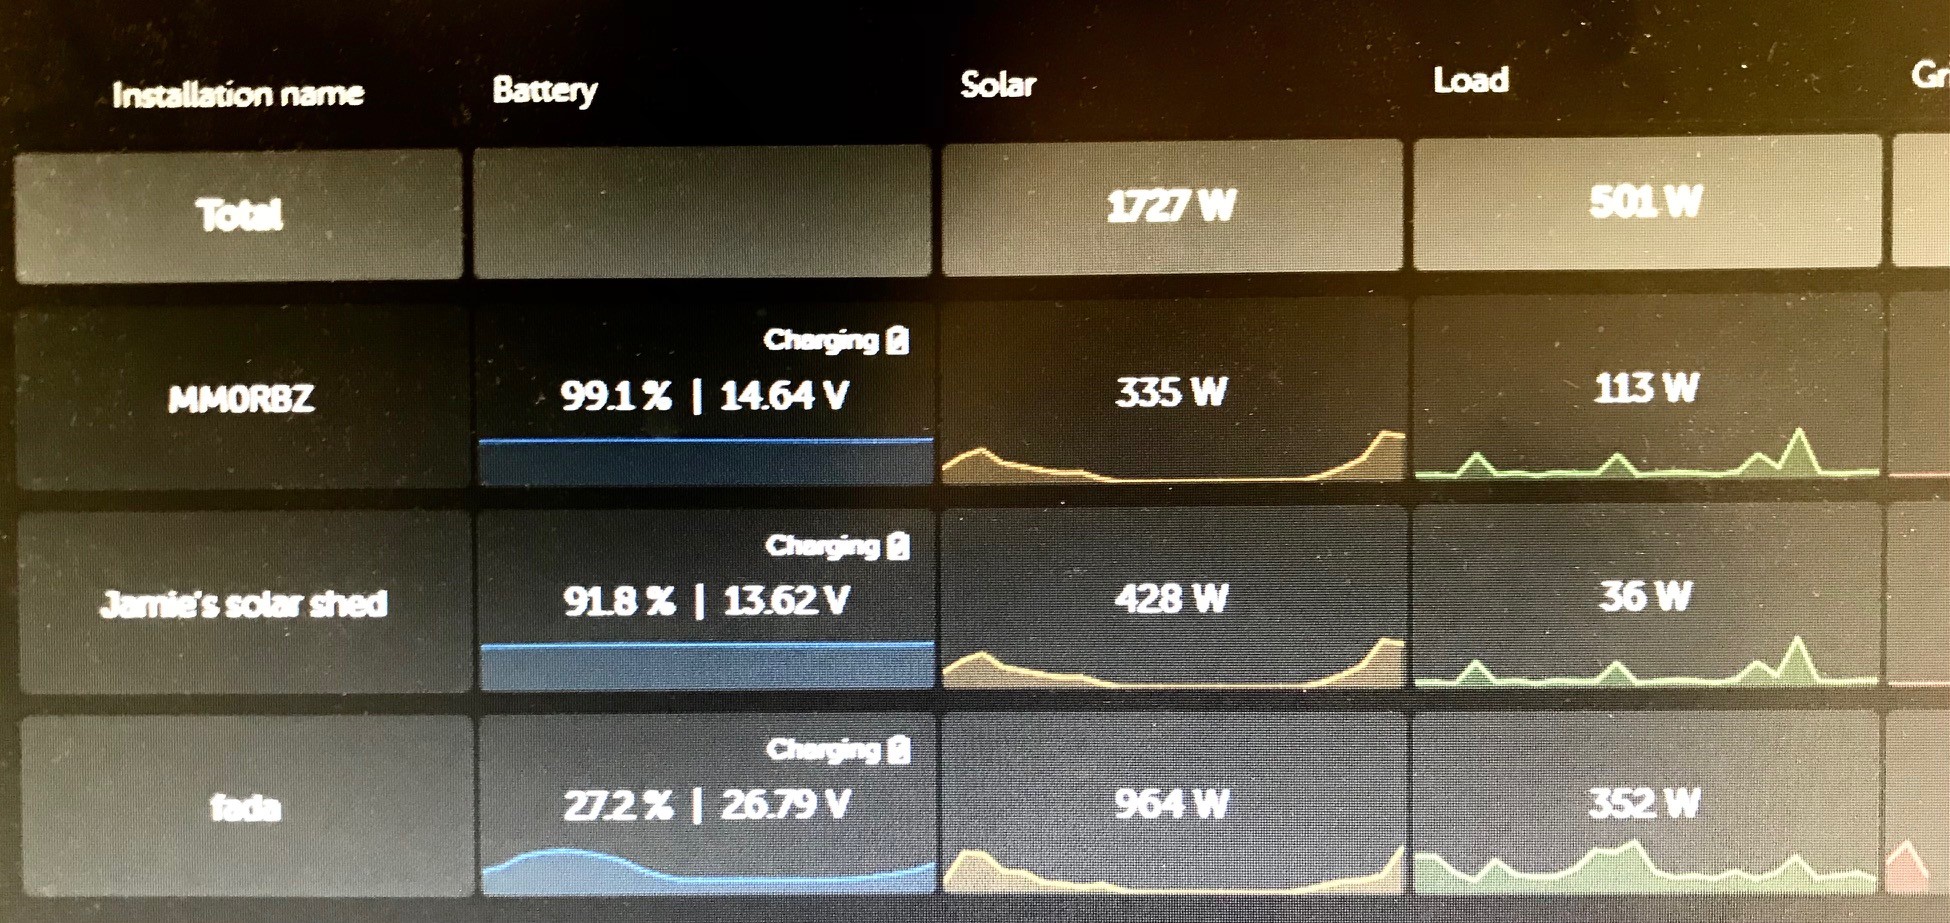
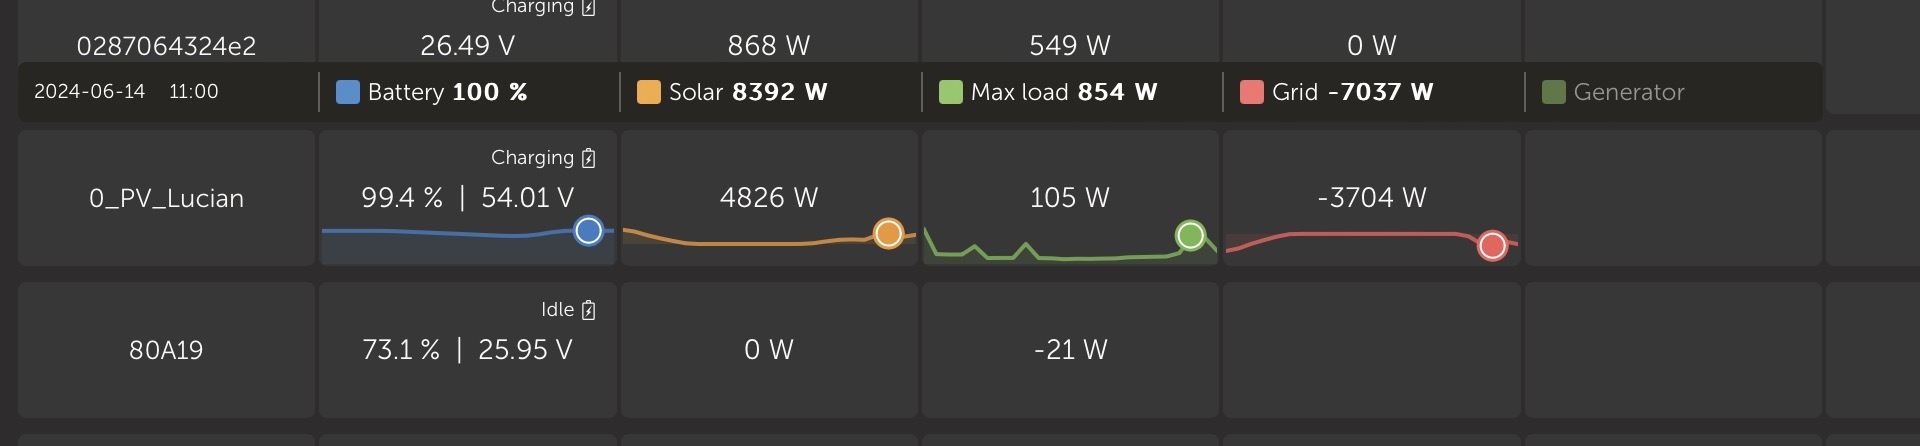
The new mini-graphs feature provides you with detailed insights into the loads, solar, and grid performance of different sites in your overview for the last 24 hours. This addition is designed to help you monitor and optimize your energy systems with greater precision and ease.


Key benefits:

  • At a glance insights: Understand the current status of multiple sites, without the need to open each one of them separately in VRM
  • Proactive management: Quickly identify and address potential issues, ensuring your sites run smoothly and effective
  • Signal load spikes early on: Get a clear view of the load patterns at each site, allowing for more informed decisions on energy usage and management


How to Access the mini-graphs:
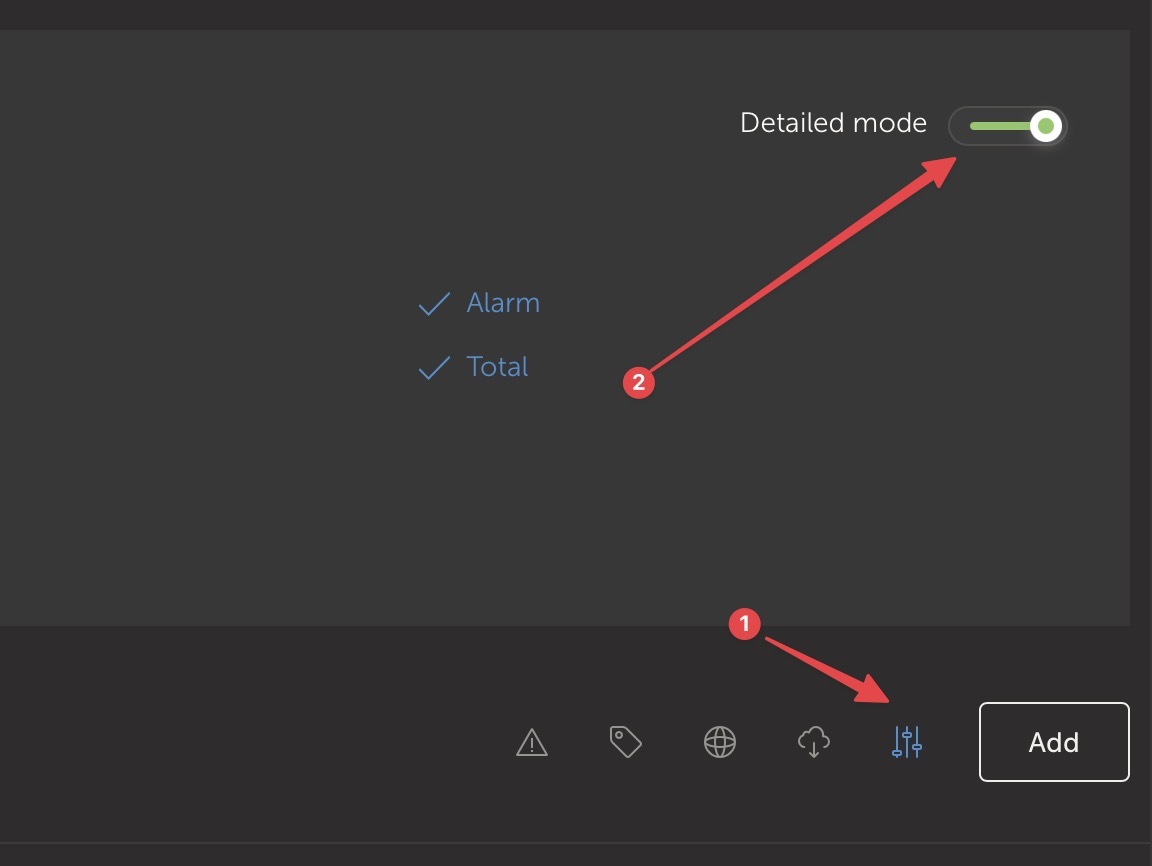
The mini-graphs are available in detailed mode in your installation overview. Simply log in to VRM, select the settings button in the installation overview, activate detailed mode, and start exploring the enhanced data insights.

cleanshot-2024-06-14-at-140836.jpg

Any feedback on this feature is more than welcome!

VRMfleet managementinstallation overview
2 |3000

Up to 8 attachments (including images) can be used with a maximum of 190.8 MiB each and 286.6 MiB total.

4 Answers
kevgermany avatar image
kevgermany answered ·

Note, on some platforms, e.g. mobile phones, the feature is only available in landscape mode, due to small screen size in portrait mode.

2 |3000

Up to 8 attachments (including images) can be used with a maximum of 190.8 MiB each and 286.6 MiB total.

andrii-podanenko avatar image
andrii-podanenko answered ·

Works only on Desktop view.

Not yet working on mobile.


Thank you, useful when you have multiple setups

2 comments
2 |3000

Up to 8 attachments (including images) can be used with a maximum of 190.8 MiB each and 286.6 MiB total.

neptuneuk avatar image neptuneuk commented ·
@Andrii Podanenko see my recent post edit about the detailed mode not being enabled on my mobile device, but was enabled in VRM desktop....


Maybe checking this on your mobile device might also enable mini graphs on your mobile device too?


0 Likes 0 ·
kevgermany avatar image kevgermany ♦♦ commented ·
Works on my mobile in landscape mode. Try rotating your phone 90 degrees.
-1 Like -1 ·
neptuneuk avatar image
neptuneuk answered ·

EDIT!!!!!

After using the element inspector, all displayed as expected on my desktop. Looks great and a very useful 'at a glance' tool for multiple installations. Well done Victron (especially the VRM development team). Keep up the good work.

Still nothing on my Moto G73 5g with Android 14 though. I'm going to try a device restart as this can something knock things along.

What mobile device are you using @kevgermany ?

EDIT 2!!!!

Nothing changed after reboot.

HOWEVER, put phone in to landscape orientation.

Settings slider appears at top right of VRM, in settings 'Detailed' mode was still set to off (not carried over from desktop). I didn't realise that the settings seem to be device specific, odd, because it carried over 'Dark Mode' settings??

Enabled 'Detailed Mode' on my mobile device settings, and now I have mini-graphs. I have to say that the mobile experience probably still requires some work. I can't slide the graphs to see data (but I think this is an Android thing), it is 'tap AND hold' to view summary mini graph data, and on the small screen that could be hours different from what I meant to select, especially with my sausage fingers. But it is there, and maybe with me using a screen stylus, a better experience?


Hi,

Great to see so much work going in to the VRM.

Sadly I see no changes in my Android 14 VRM. This is either in portrait or landscape.

In the desktop VRM I get the same data output for two very different installations, the data displayed is the same for either installation, at that point in time. My setup:

Ubuntu Linux 22.04.

Firefox 126.0.1

Chrome 125.0.6422.141

I've done the usual hard reload and cache clearing etc.

See screen shots.


screenshot-from-2024-06-18-20-51-41.png


screenshot-from-2024-06-18-20-51-18.png


I was expecting to see the summary data for the selected installation.

Am I misunderstanding something?


2 |3000

Up to 8 attachments (including images) can be used with a maximum of 190.8 MiB each and 286.6 MiB total.

bigbadbob76 avatar image
bigbadbob76 answered ·

I have the same problem as neptuneuk.

"In the desktop VRM I get the same data output for two very different installations, the data displayed is the same for either installation, at that point in time."

The graphs for both my first two installations show the data for installation 1.

the graph for my third installation shows correctly.

the wattage values shown are correct but the graphs are not and the displayed value if I hover the mouse over the graph is also incorrect.

installation-graph.jpg

I have watched the graphs for a while and sometimes they show correctly but a lot of the time they show the wrong data, sometimes 1 and 2 are the same, sometimes 2 and 3 are the same, sometimes one or more graphs show no data.


2 |3000

Up to 8 attachments (including images) can be used with a maximum of 190.8 MiB each and 286.6 MiB total.

Related Resources