question

adrianc avatar image
adrianc asked

Scheduled charging and grid consumption on VRM dashboard

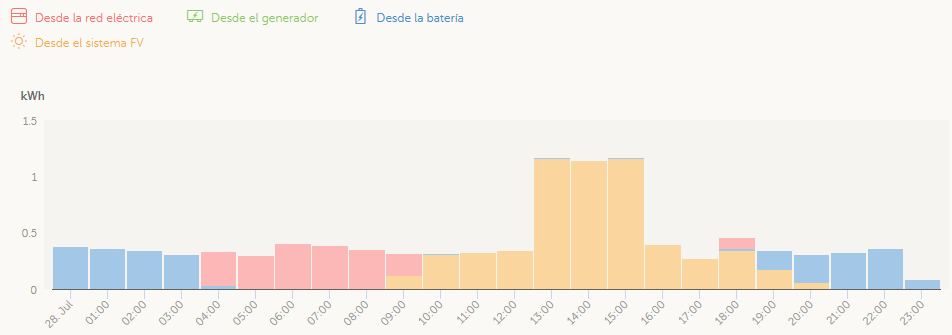
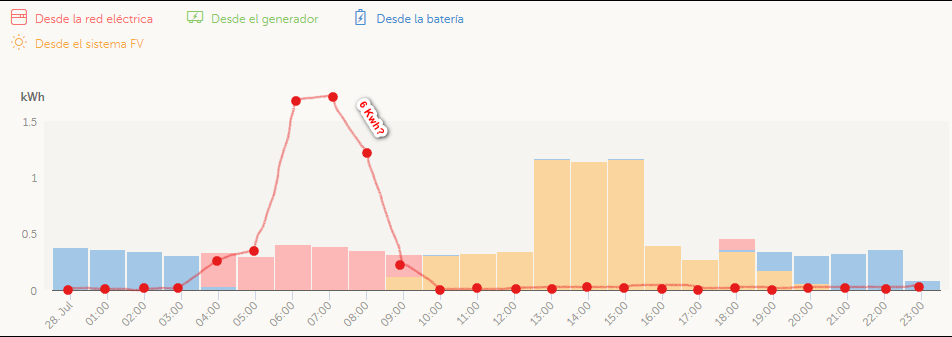
I was initially using my system until my battery reached it's SOC limit, then used grid until the sun had recharged the battery sufficiently to resume use from the battery. The problem with this is that I was using the grid at "peak" times.

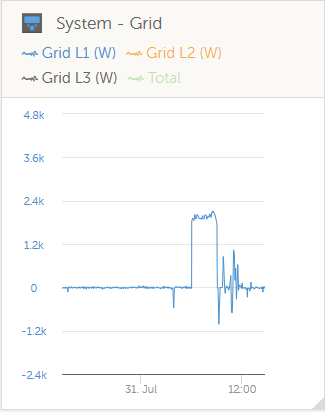
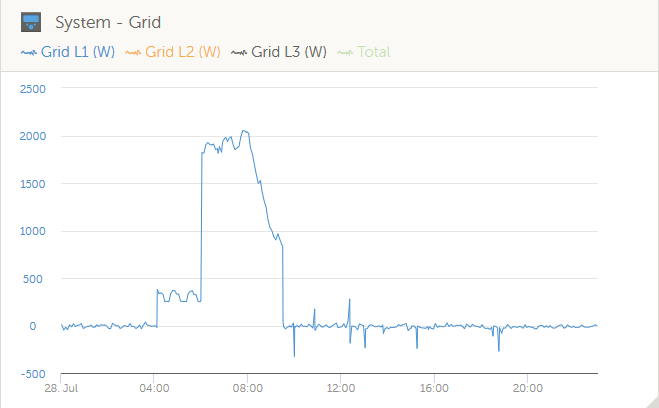
So, to take advantage of "off-peak" rates I now use scheduled charging to bring the battery up to a certain SOC in the early hours of the morning, which then gives me enough battery through the peak time until the solar energy is available again.

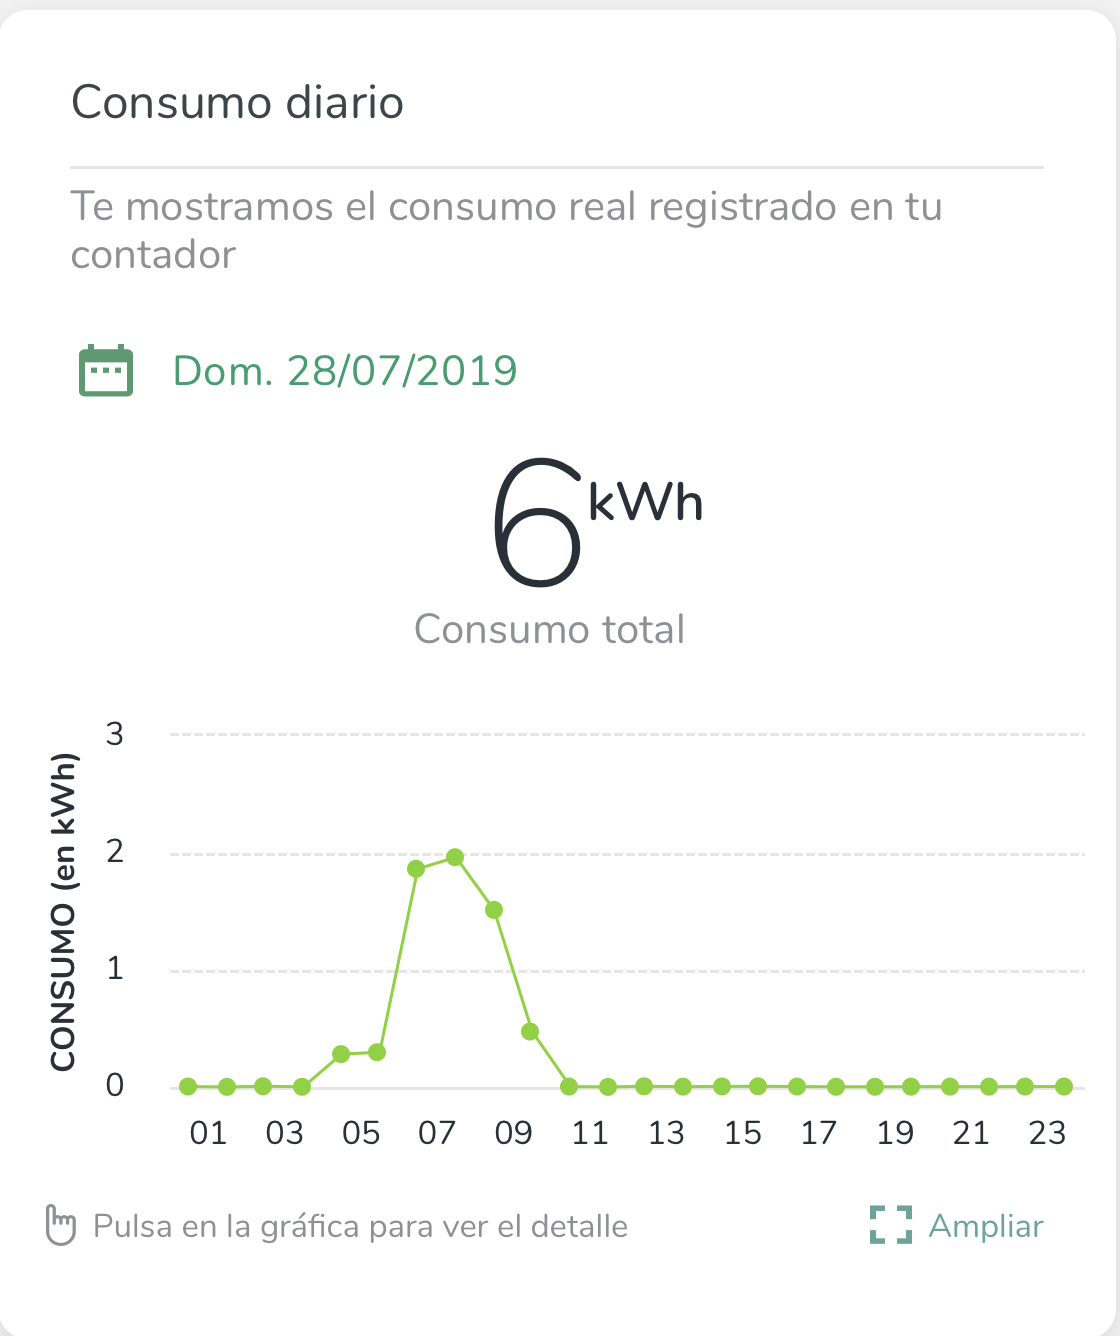
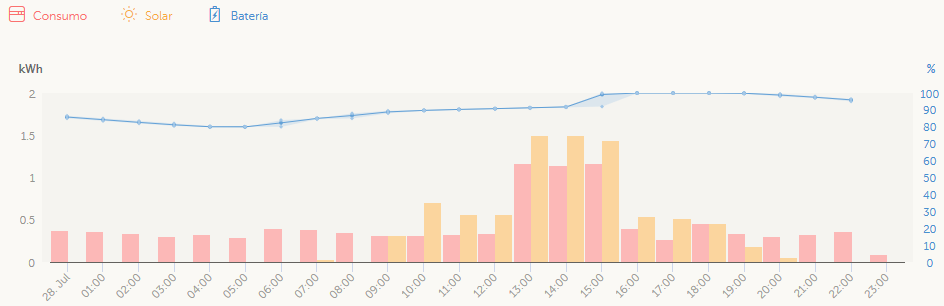
BUT, my consumption graph does not record the grid used to charge the battery, which makes sense as I am "not consuming" at that point and will only be consuming this energy via the battery later. Therefore my consumption graph on the dashboard now shows a lower grid usage and higher battery usage, which is not reality - i.e. my grid consumption on the VRM will no longer equal my grid consumption on my municipal bill. I understand why, I just want to know is there any way to know my true grid consumption on the VRM in this configuration?

VRM
3 comments
2 |3000

Up to 8 attachments (including images) can be used with a maximum of 190.8 MiB each and 286.6 MiB total.

julian avatar image julian commented ·

Hi @AdrianC,

agree with you, it happens to me also. In the night my graphs show also consumption without considering the grid's "scheduled charge consumption" that, in fact is also a consumption and could be considered (or not, it depends on everyone's perferences) to be shown together or in a separated line there. In my view this should be added to the consumption's graph.

0 Likes 0 ·
adrianc avatar image adrianc julian commented ·

I think the only way to do this to show a separate item otherwise the total consumption will have a duplicate as it will "consume" charging the battery and then "consume" again when using from the battery.

0 Likes 0 ·
julian avatar image julian adrianc commented ·

Or... checking our grid's bill against our grid's graph, but I think it's better to have all info together? In my case my company says I have wasted 6kwh this day, unsure how to check the exact VRM's value?

0 Likes 0 ·
grid-comsuption.png (10.1 KiB)
5 Answers
Guy Stewart (Victron Community Manager) avatar image
Guy Stewart (Victron Community Manager) answered ·

Hi @AdrianC,

This is indeed a limitation with the way VRM is measuring and displaying data (a similar thing also occurs with generators).

I have previously created a ticket to have this addressed and will add your elegant description to the issue. Thank you for reporting.

If others are also having similar issues, please comment into this question so that it can be seen as something that is in demand.

To help the developers, could you please consider and post how you think the ideal representation of the data should be.

As you say, it isn't consumption as in from loads, and it will be counted as consumption when the batteries are discharged to the loads.

How would you expect this would/should/could be displayed?


2 |3000

Up to 8 attachments (including images) can be used with a maximum of 190.8 MiB each and 286.6 MiB total.

julian avatar image
julian answered ·

Hi @Guy, @AdrianC,

this is of course my opinion and anyone can provide their own. This is in my case what my Grid's Company report about my consumption last sunday, where I think the main information to consider is that total value (6kwh). It's a day view, but there are also week and month views:

If I'm not wrong the same view can be provided from VRM at the Grid's graph, but there is no total value to compare with Grid's company (I know graphs can be considered similar but comparing a longer time period this is not so easy)

In my opinion the consumption graph could be improved either adding a new bar (in the level of detail below a new bar every hour) or with a progress line with the total kwh per hour (similar to the battery level of charge at the system summary view)

(Actual system consumption graph)

(System summary's battery charge level line)

A possible first approach?


ide.jpg (273.8 KiB)
system-summary.png (16.1 KiB)
1 comment
2 |3000

Up to 8 attachments (including images) can be used with a maximum of 190.8 MiB each and 286.6 MiB total.

alans avatar image alans commented ·

Also @Guy Stewart (Victron Community Manager)

I'm looking for something similar to is discussed here. I'd love to see in the Dashboard, the graph for power taken from the grid and also the graph of energy exported to grid, including totals over time selected. I've considered the ET112 power meter but I think it's redundant (I have EasySolar-II GX) and I don't know if it would be integrated with my victron device and VRM portal.

0 Likes 0 ·
adrianc avatar image
adrianc answered ·

Hi @Guy, @Julian,

This is a little tricky, sort of like trying to display 3D in 2D.

My suggestion would be to add a 4th item called "Source" to the drop-down menu on the Dashboard. This would then show all the energy produced from the various sources i.e. Solar, Grid and Generator.

In this way, you would be able to reconcile values back to each generation source, for example, the municipal grid reading would more or less equal the "grid" reading on this graph for the same time frame.

Please see my simple image trying to illustrate the above:


1564749689504.png (14.2 KiB)
2 |3000

Up to 8 attachments (including images) can be used with a maximum of 190.8 MiB each and 286.6 MiB total.

khaem avatar image
khaem answered ·

Hello,

I have the same problem.

I use a weekly scheduled charge to do a full cycle to the batteries, but this cunsumption doesn't appear in VRM.

Maybe we can select in CCGC or VRM what it consumption...

Another idea is to add a power meter, but it's redundant with quattro internet meter...

Thank you for all

Regards,

Emmanuel

2 |3000

Up to 8 attachments (including images) can be used with a maximum of 190.8 MiB each and 286.6 MiB total.

alans avatar image
alans answered ·

I'm looking for something similar to is discussed here. I'd love to see in the Dashboard, the graph for power taken from the grid and also the graph of energy exported to grid, including totals over time selected. I've considered the ET112 power meter but I think it's redundant (I have EasySolar-II GX) and I don't know if it would be integrated with my victron device and VRM portal.

2 |3000

Up to 8 attachments (including images) can be used with a maximum of 190.8 MiB each and 286.6 MiB total.