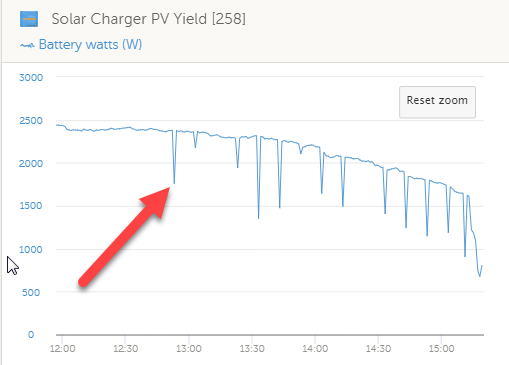
What are the dips on the Solar Power Yield Graph? This is on a clear sunny day with no cloud.
What are the dips on the Solar Power Yield Graph? This is on a clear sunny day with no cloud.
Hi from the USA, @AdrianC. The MPPT controls (in all brands) do an occasional "sweep" to ensure they've got the optimum peak power point for the array & I think that's what you're seeing.
Sunny Days~
Yes, there's been a couple of questions on this previously, but I can't find them quickly. I do recall nothing definitive actually stated though, so not worth wasting time looking further.
Somebody stated that the mppt sweeps happen every 10 min. They may only take seconds (or even less), but if they coincide with the per-minute VRM sampling then that's what you're likely seeing. Likely you won't see the effect in steady Abs or Float, as the mpp has no need to actually track.
It's probably quite unimportant, but the graphs exaggerate it, and it doesn't look good. At a pinch, it might work to 'desync' the mppt by powering down the mppt for (say) 30 sec.