question

Guy Stewart (Victron Community Manager) avatar image

Early preview of new VRM consumption forecast - Update Now Released

We are now opening the public beta test of our consumption forecast for VRM.

To try it you can log in using your normal VRM credentials to https://betavrm.victronenergy.com/login

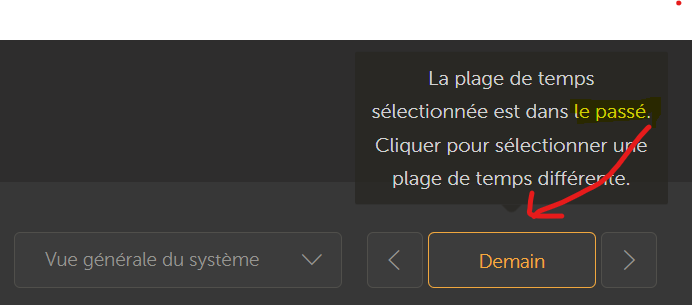
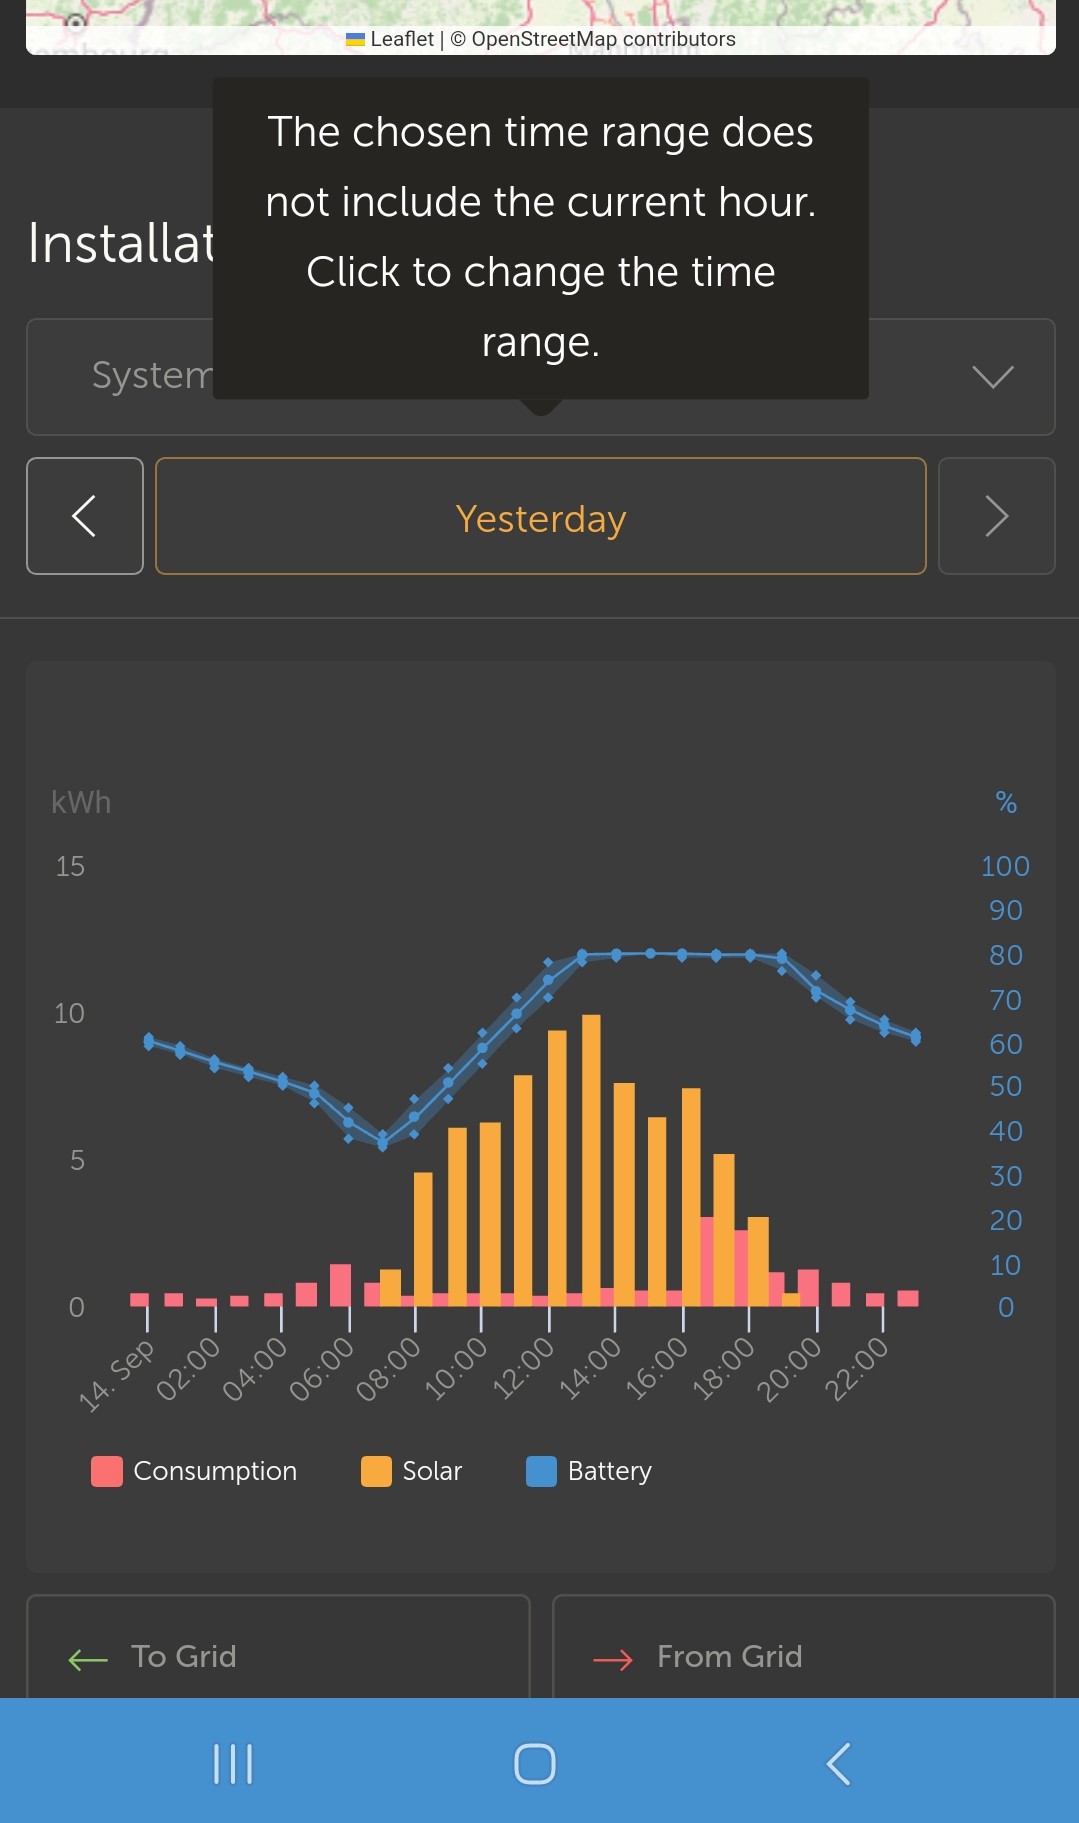
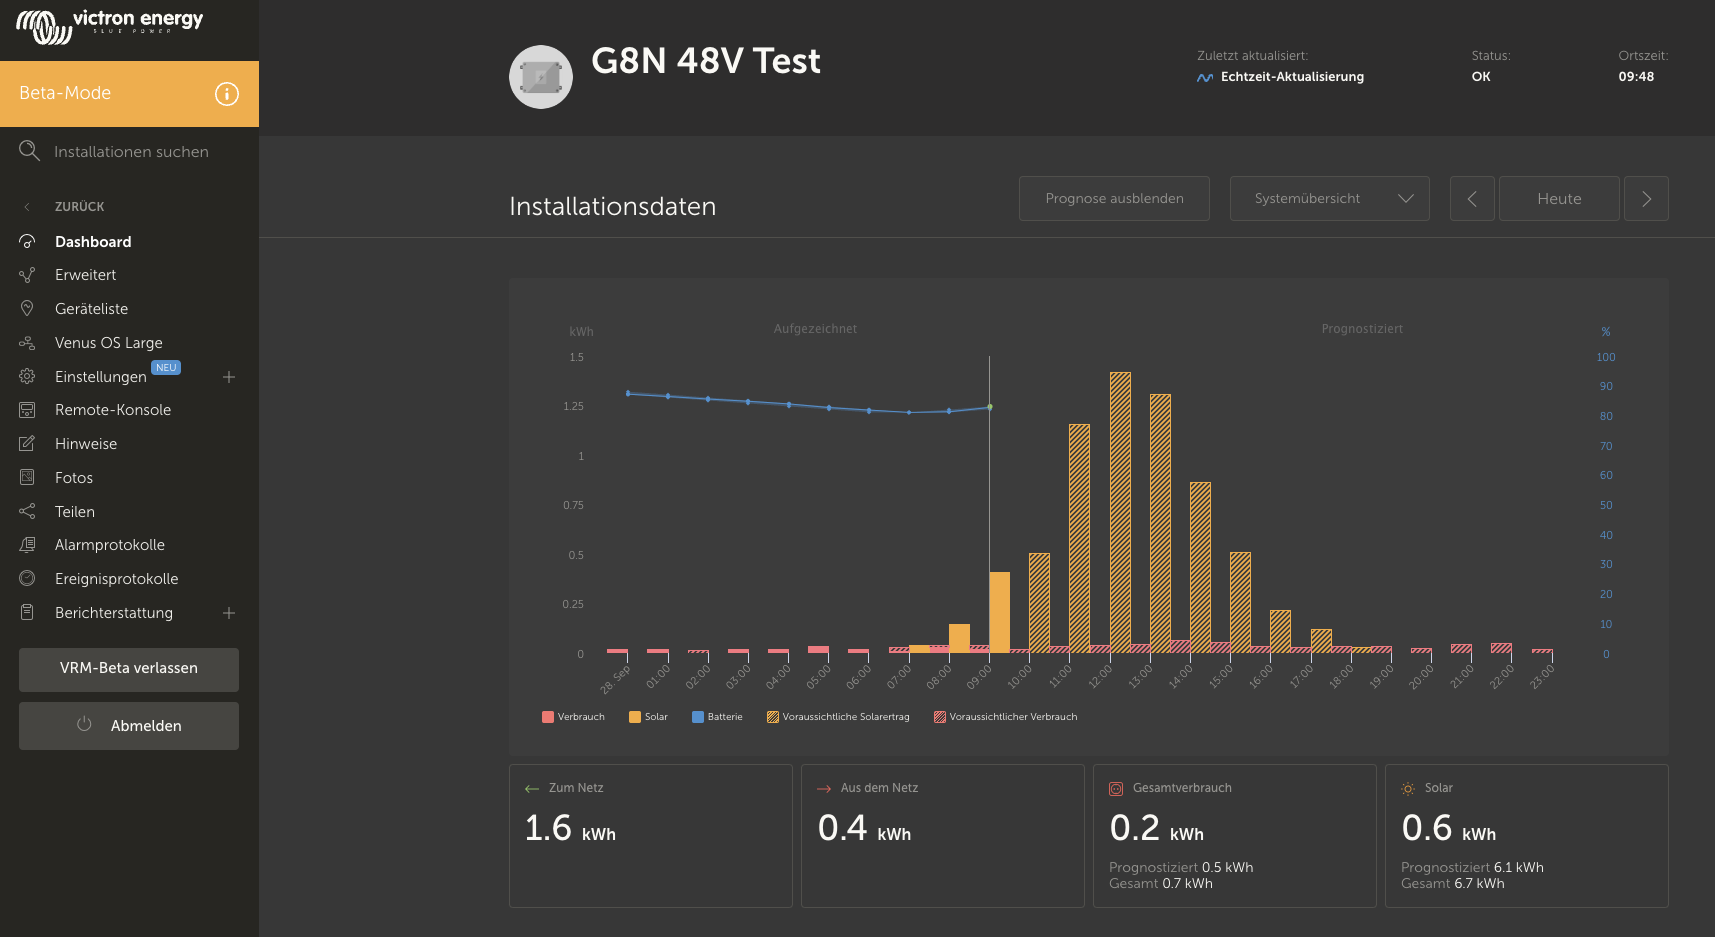
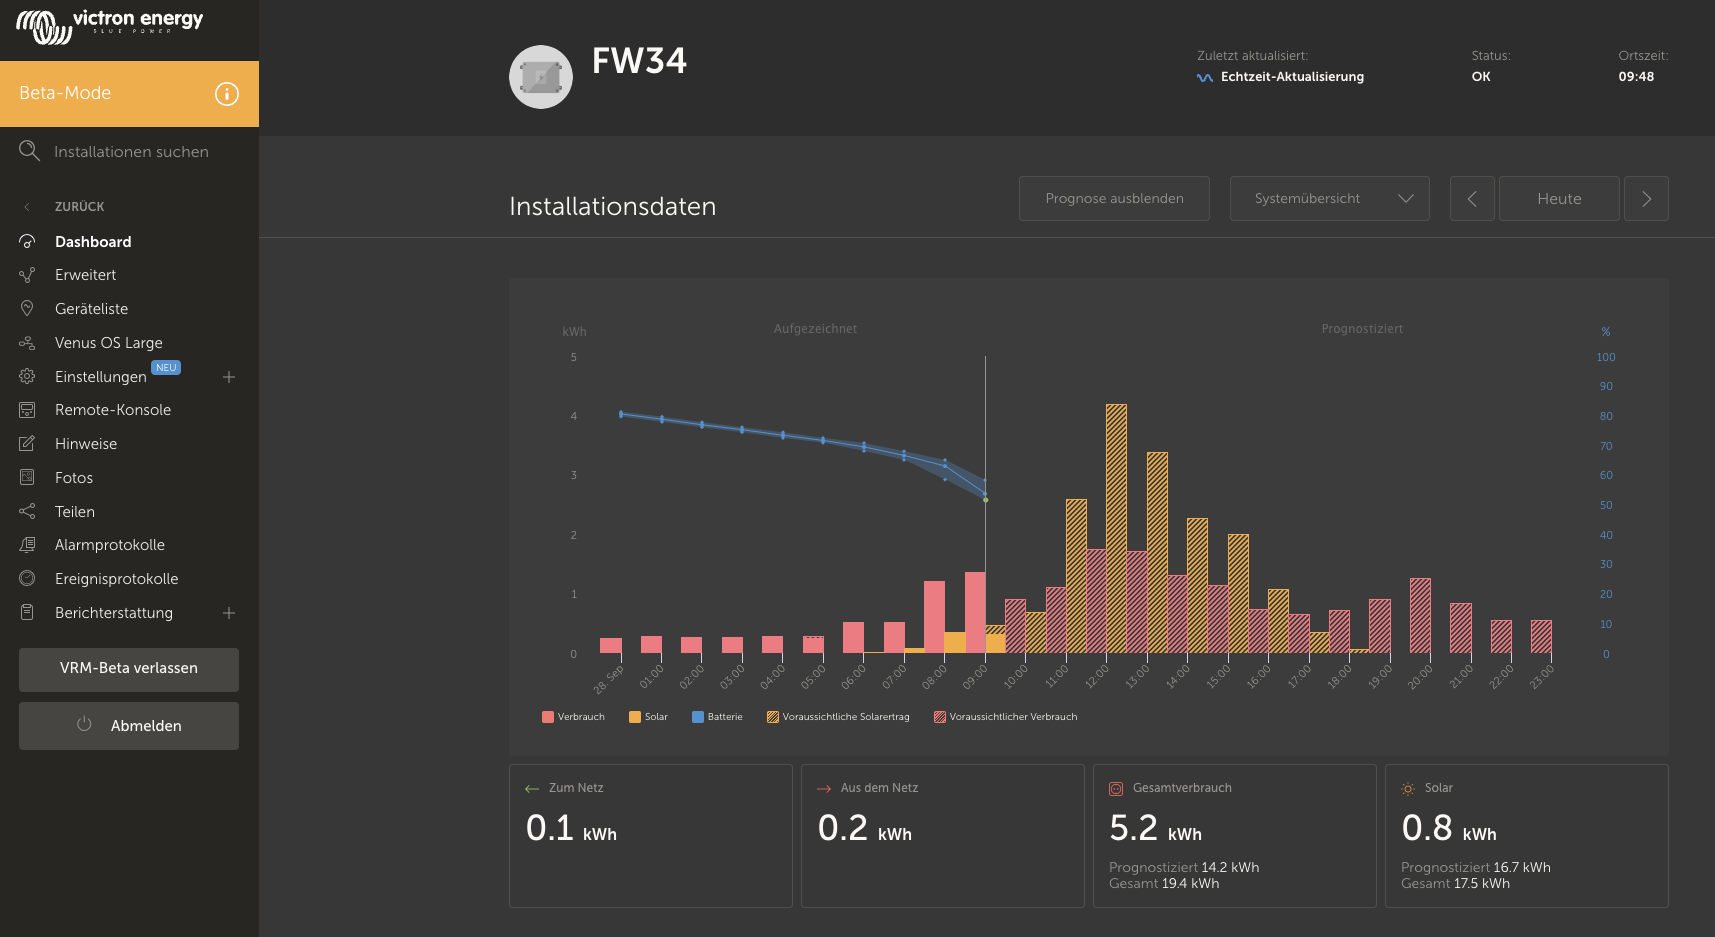
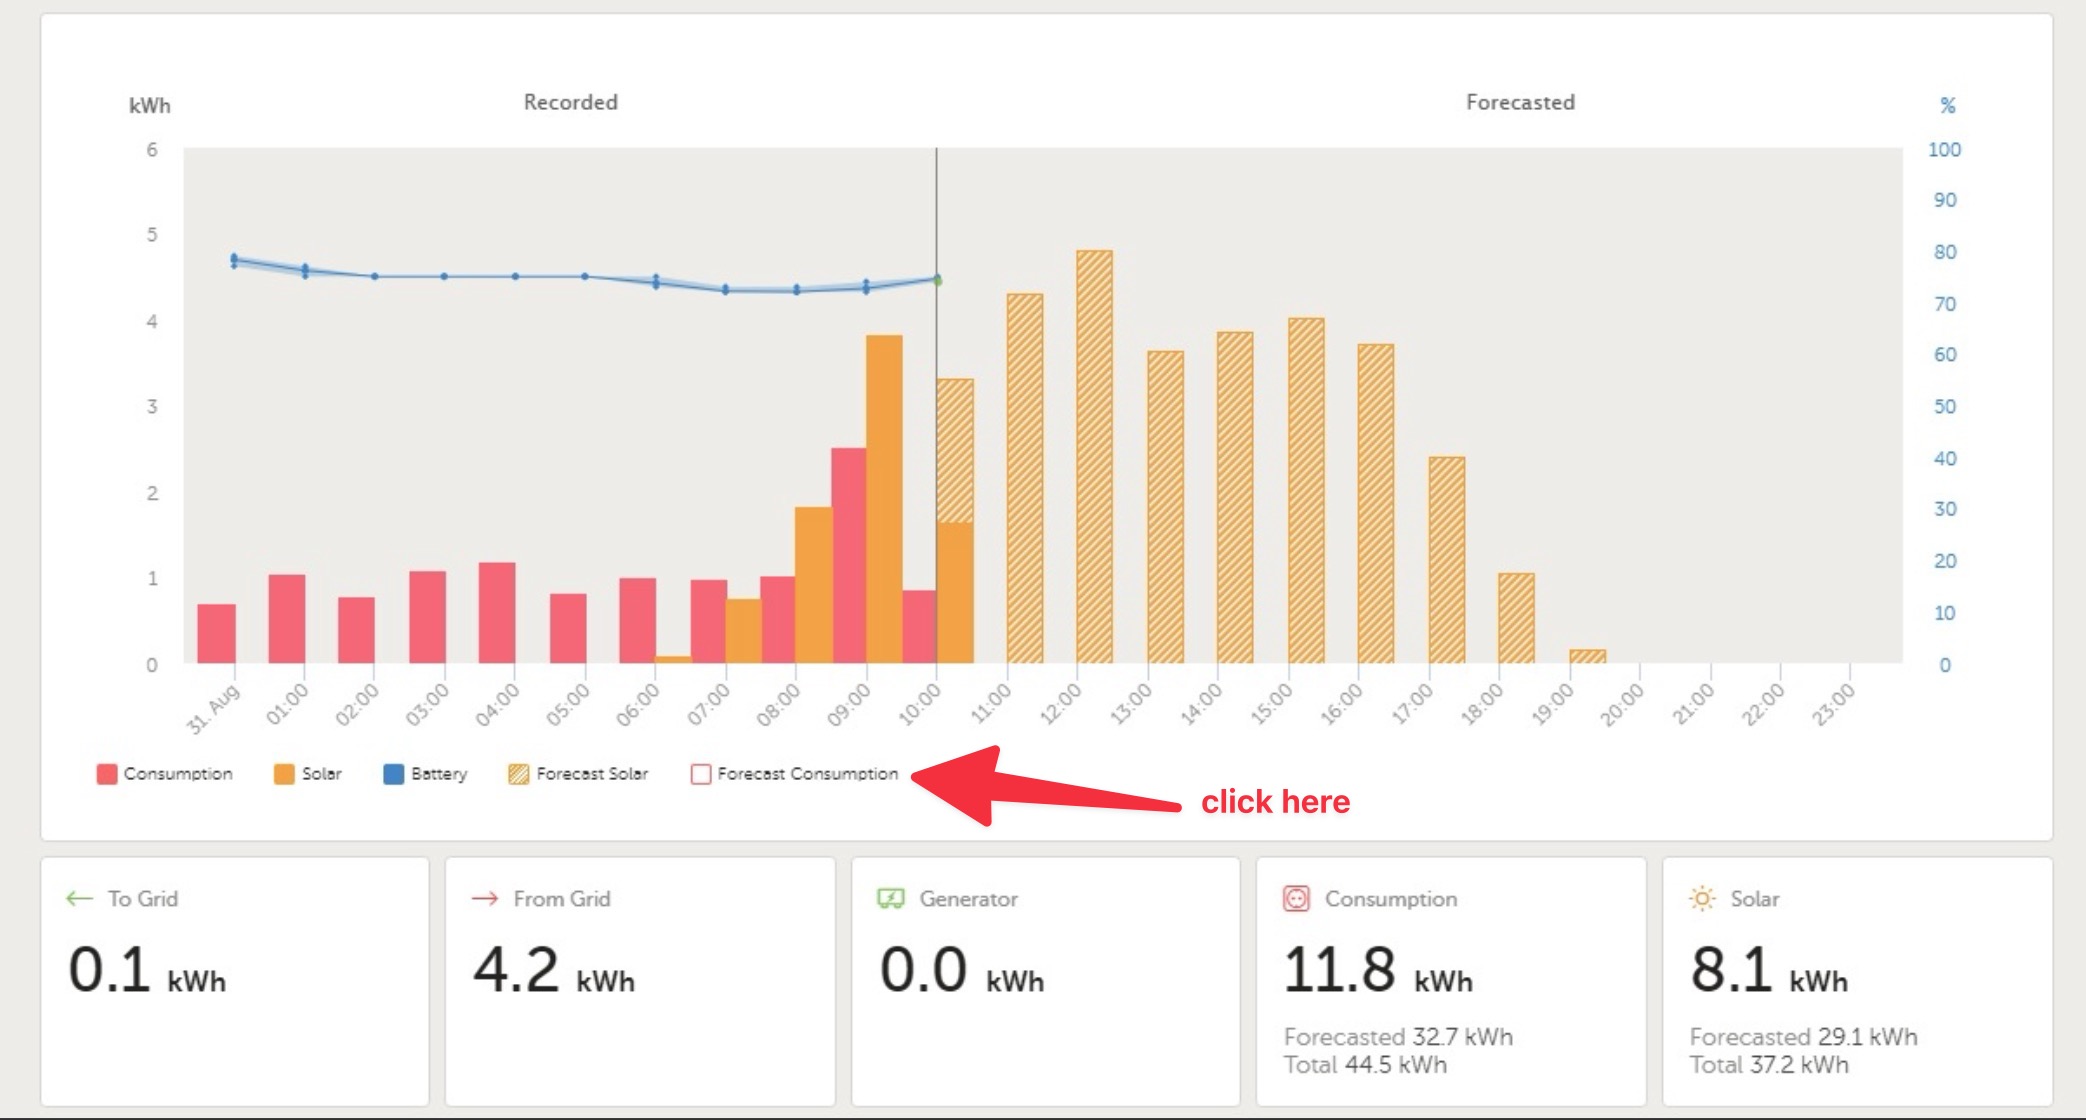
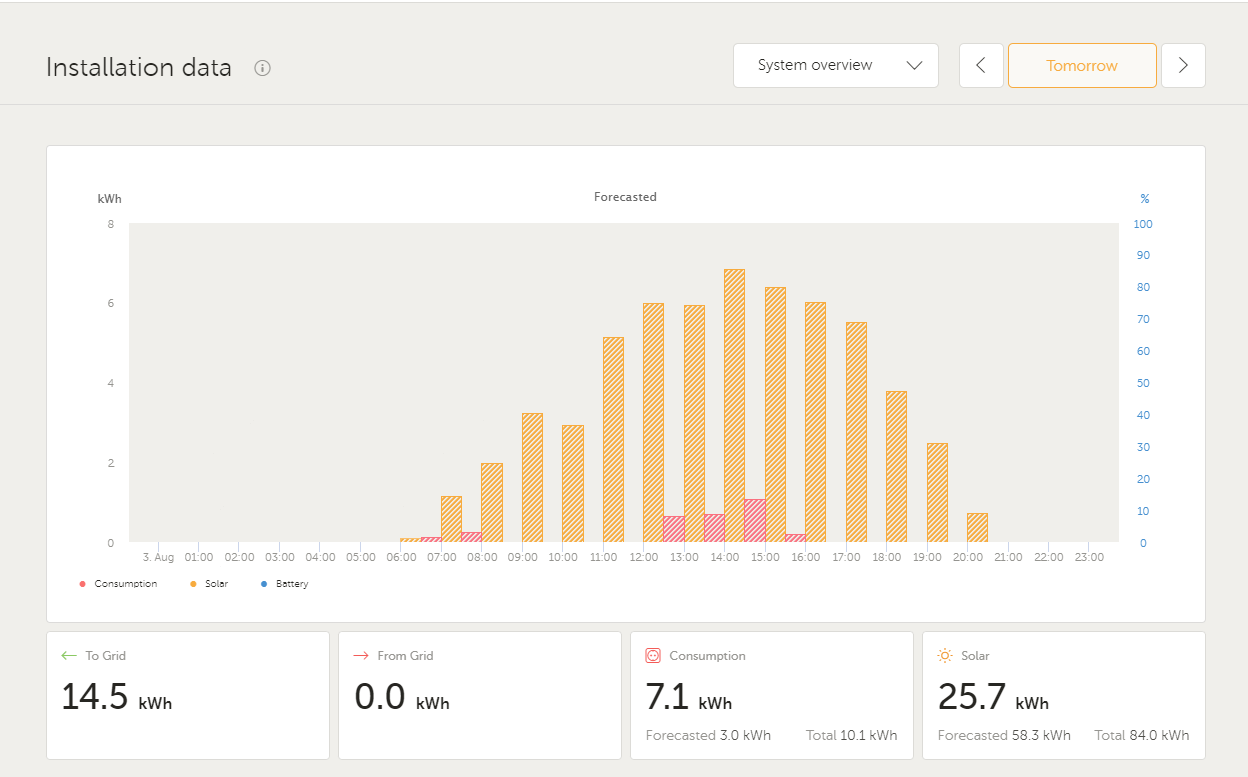
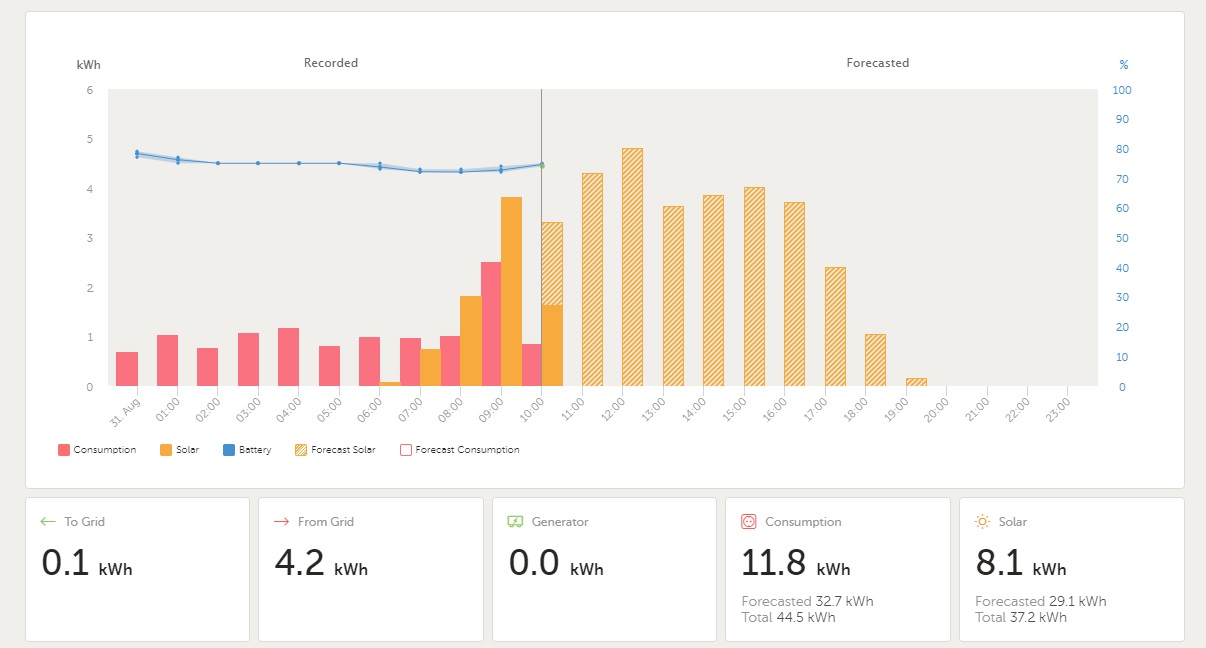
It should show up alongside the recently launched solar forecast. Opening your site VRM dashboard and select 'Today'. This should reveal a Show/Hide forecast button.

cleanshot-2023-07-15-at-085026.jpg


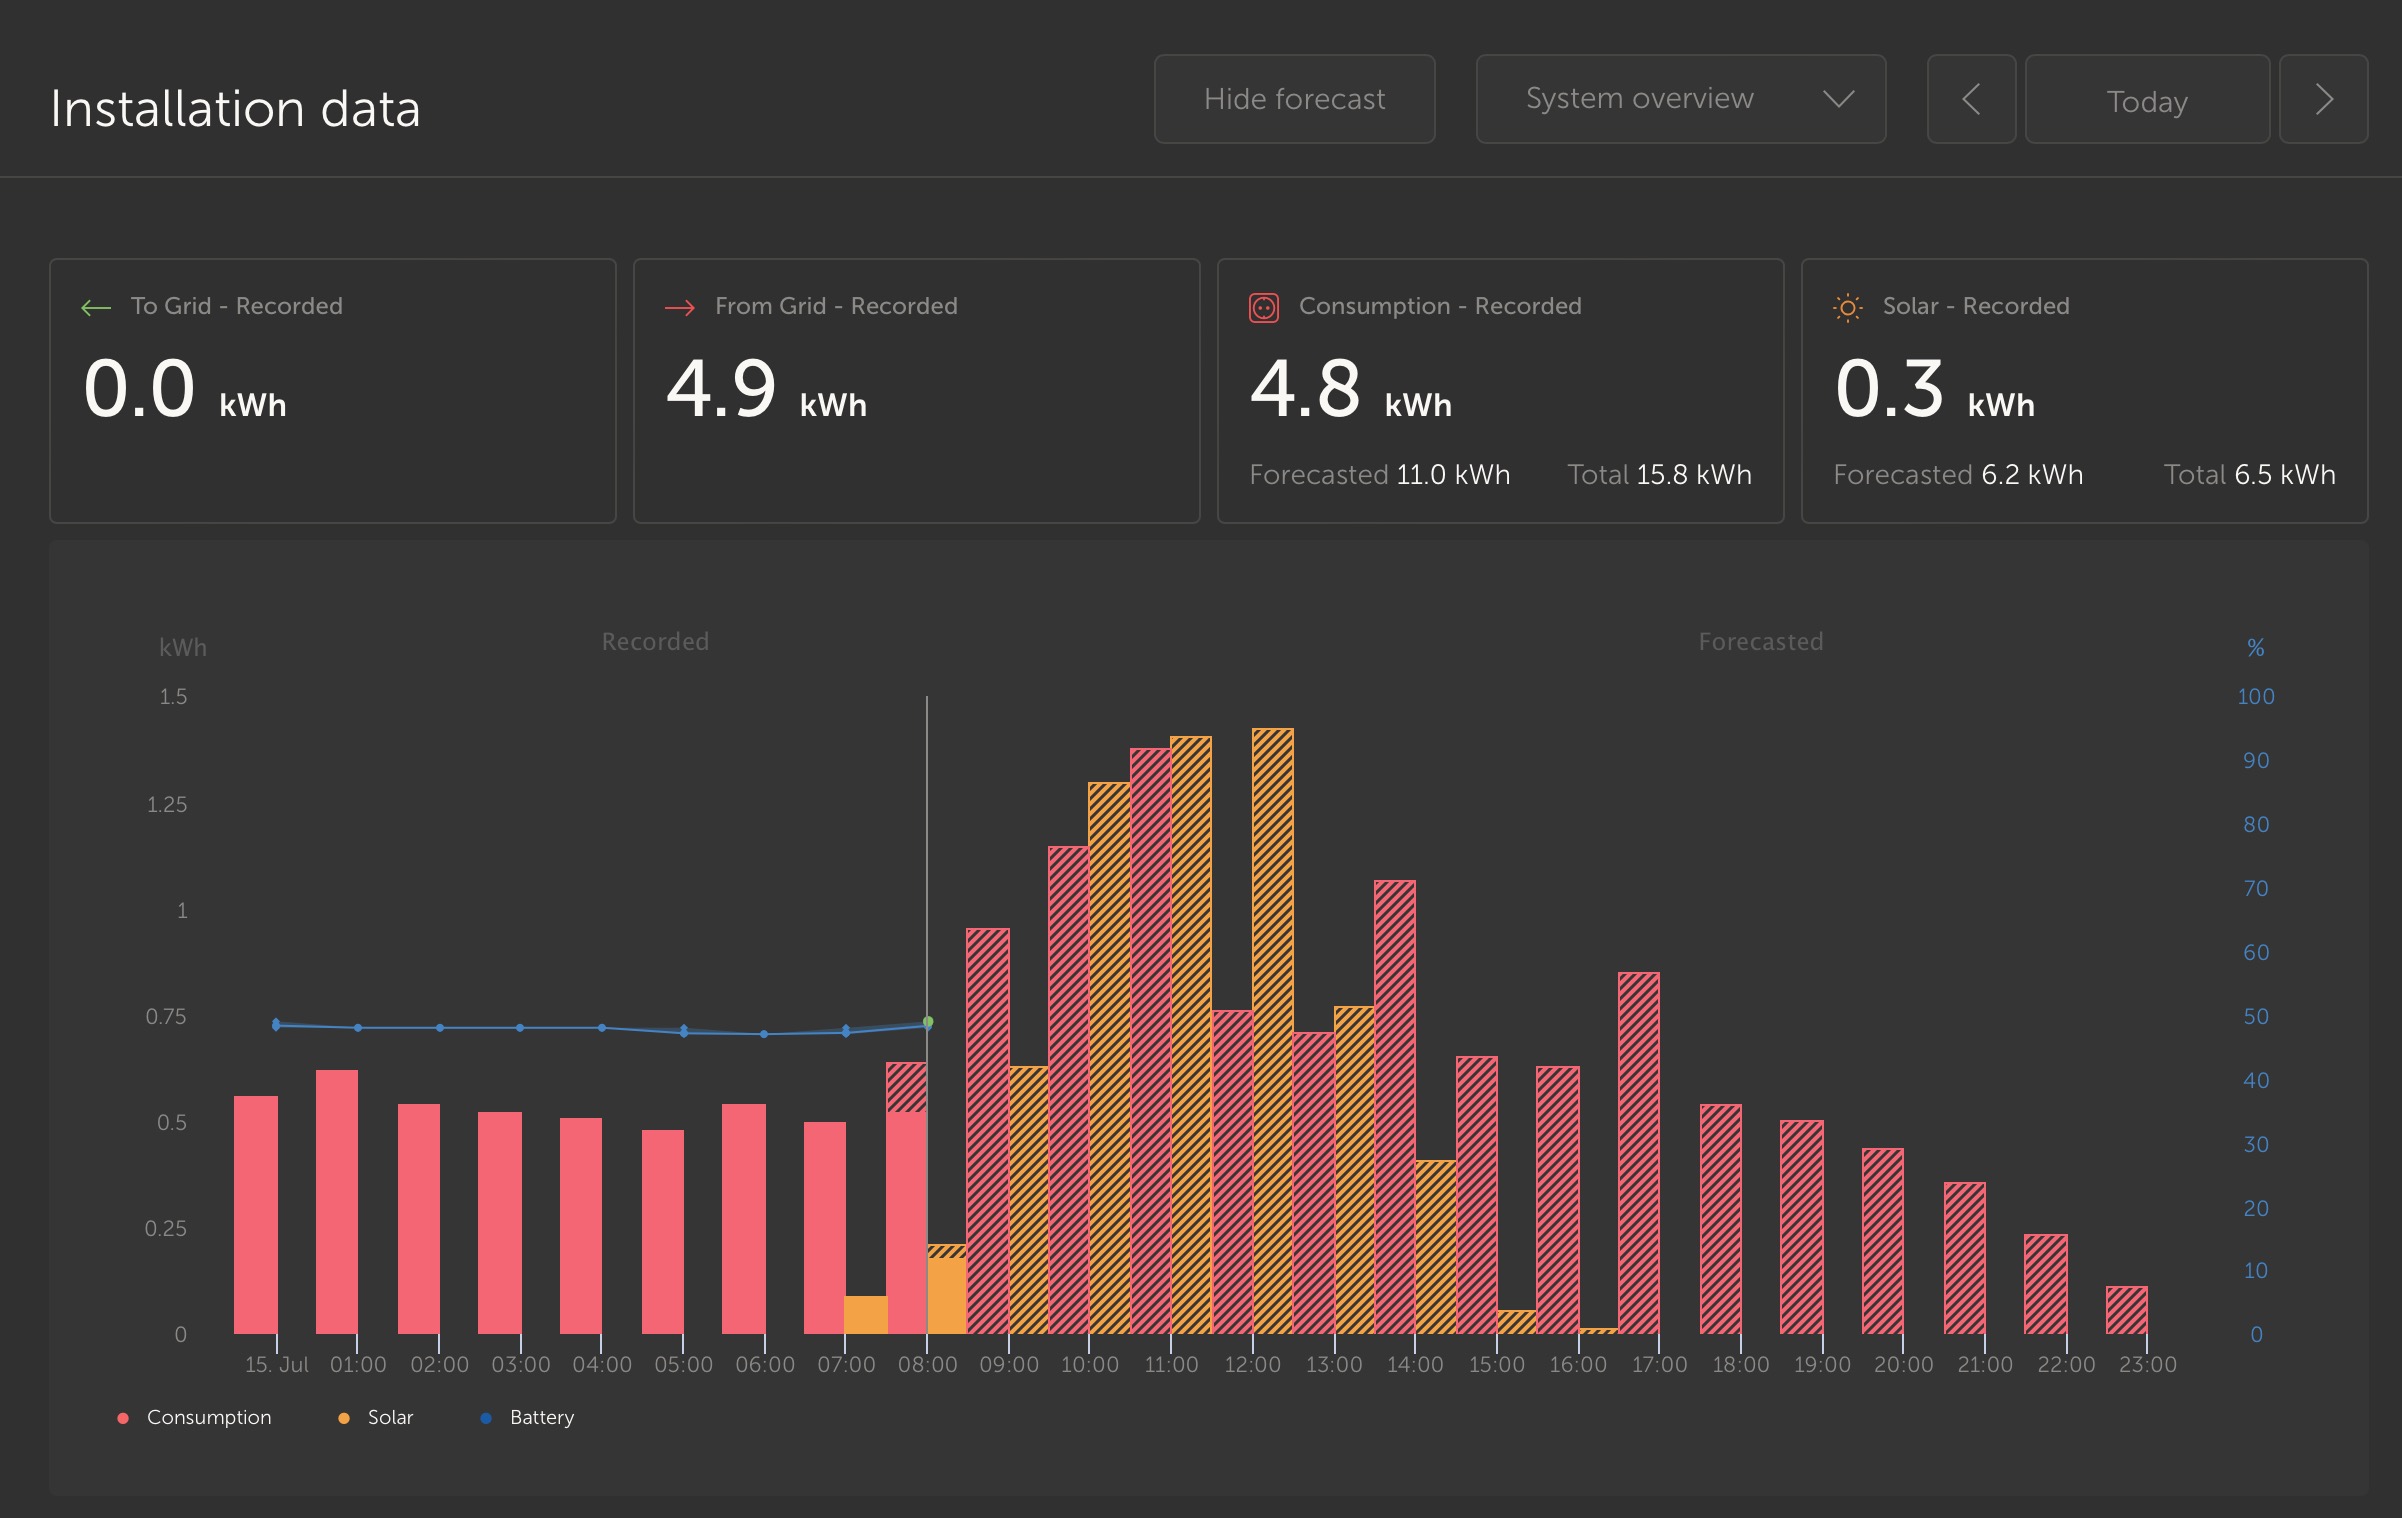
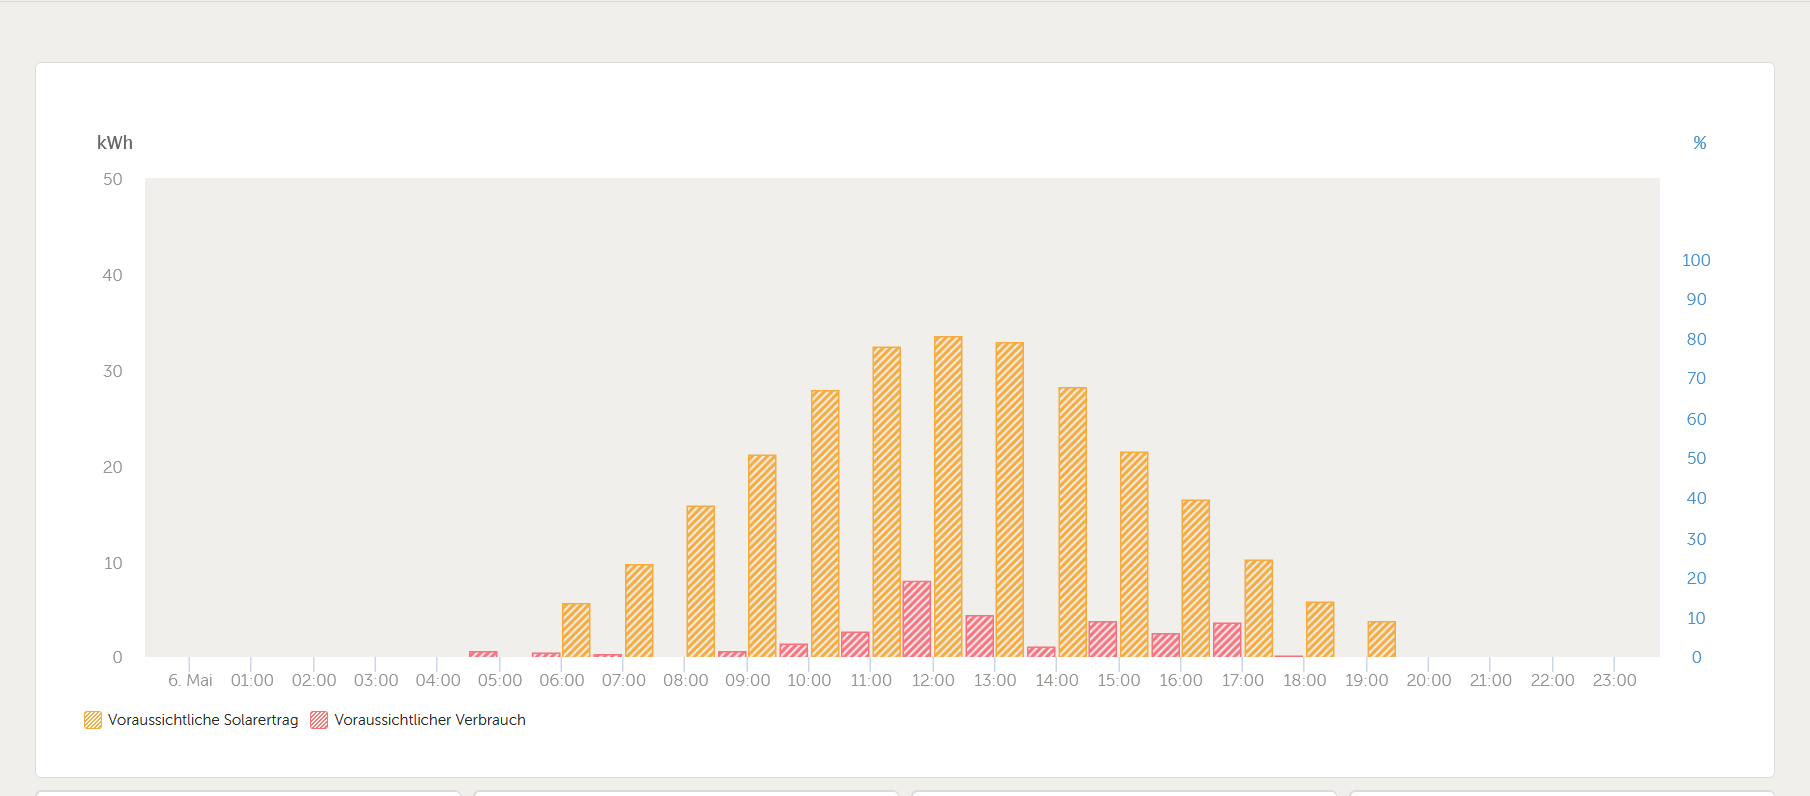
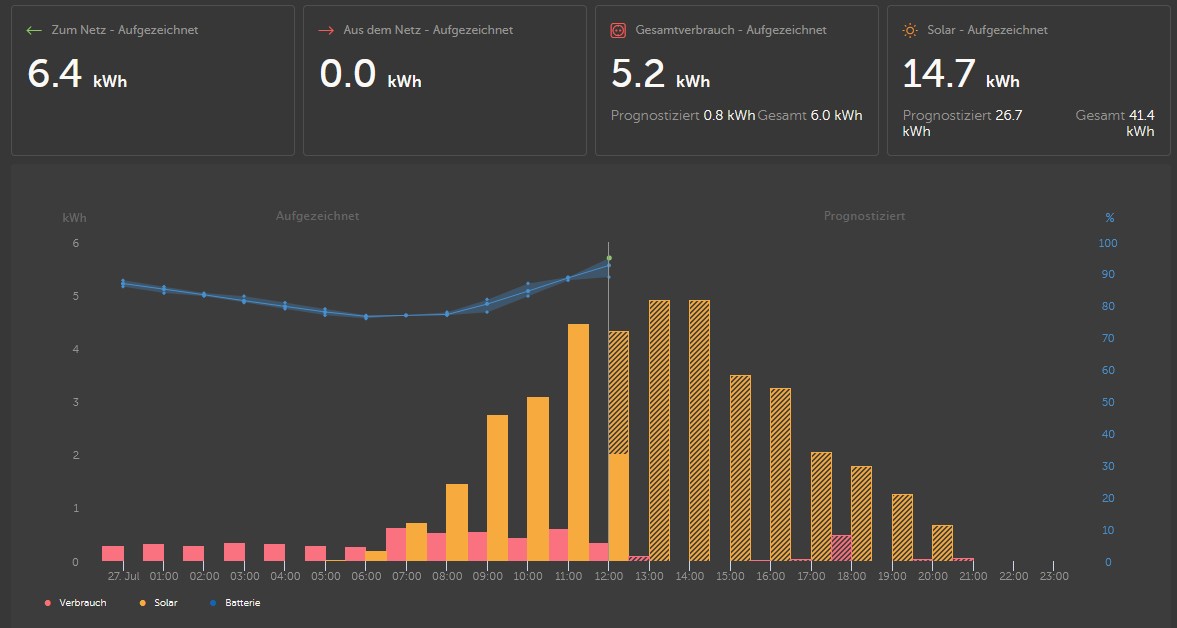
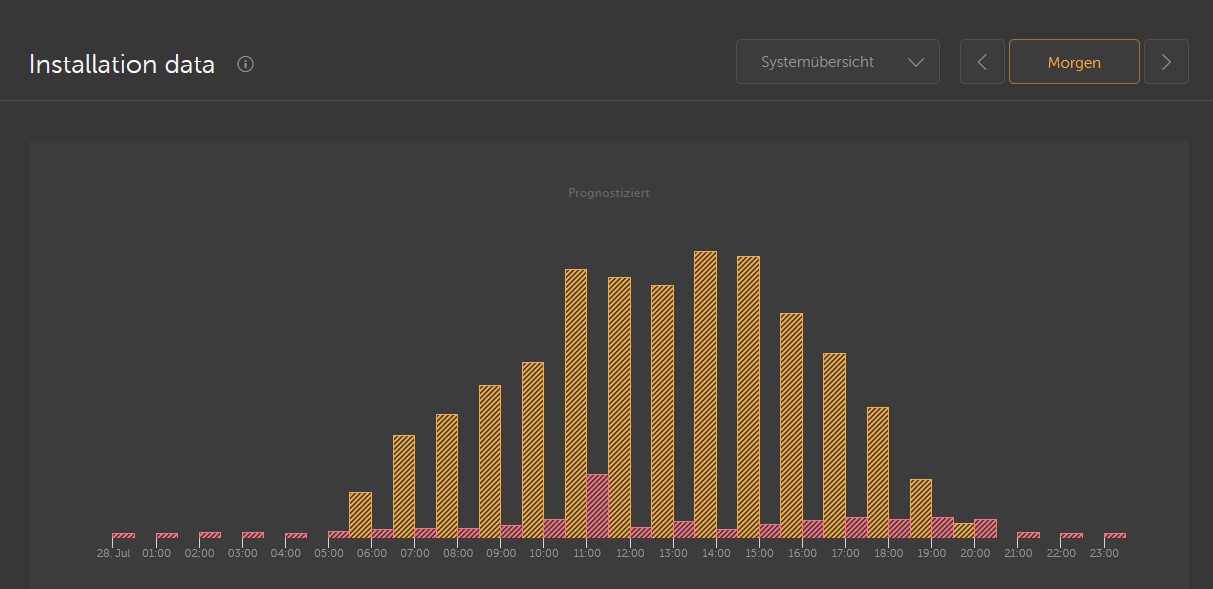
Clicking the Show Forecast button will expand the view to show what remains of the current day, and also draws bars to show the estimated load consumption.

It's very similar to the solar production forecast, so please read this blog first if you're having issues.


Feedback

Like the solar estimate, we are still improving the estimation algorithm, so are interested in reports of any unusual or impossible estimates.

Please include your site URL and any information that might be useful in understanding the problem and why when making the report.

We also welcome any reports of issues with the user interface, either suggestions for improvement, or bugs.

We hope you enjoy this new feature, and are looking forward to hearing your feedback.

VRMtesting
6 comments
2 |3000

Up to 8 attachments (including images) can be used with a maximum of 190.8 MiB each and 286.6 MiB total.

Ole Saether avatar image Ole Saether commented ·

Hi @Guy Stewart (Victron Community Manager) I accidentally clicked the Show/Hide Forecast button in VRM and now it's gone. Is there a way to get the button back? I tried in another browser and it's gone there as well.

EDIT: Buton is back now.

0 Likes 0 ·
dansonamission avatar image dansonamission Ole Saether commented ·
Do you have the time period set to 'Today'
0 Likes 0 ·
Ole Saether avatar image Ole Saether dansonamission commented ·

Yes, and button is back now with a message that I have to set my location. I did that and now it says that forecast will be available after two hours. So it's working now.

0 Likes 0 ·
g8n avatar image g8n commented ·

Thank you for this information and for these really very helpful new functions. It would be excellent if the solar and consumption forecast could also generate one for the SOC of the battery. That would be extremely helpful for implementing your own energy management.

0 Likes 0 ·
semlohnhoj avatar image semlohnhoj g8n commented ·
This sounds like a great idea. It would be an ongoing iterative process though because if you do anything with any prediction of SOC that Victron made to adjust your usage of the system then that would affect their predictions going forward. It would be like Schroedinger's cat. As long as you make your adjustments at a different speed to Victron then you shouldn't get into any feedback loop. I suppose the same applies to Victrons predicted usage for the same reason as well.
0 Likes 0 ·
dune7 avatar image dune7 commented ·

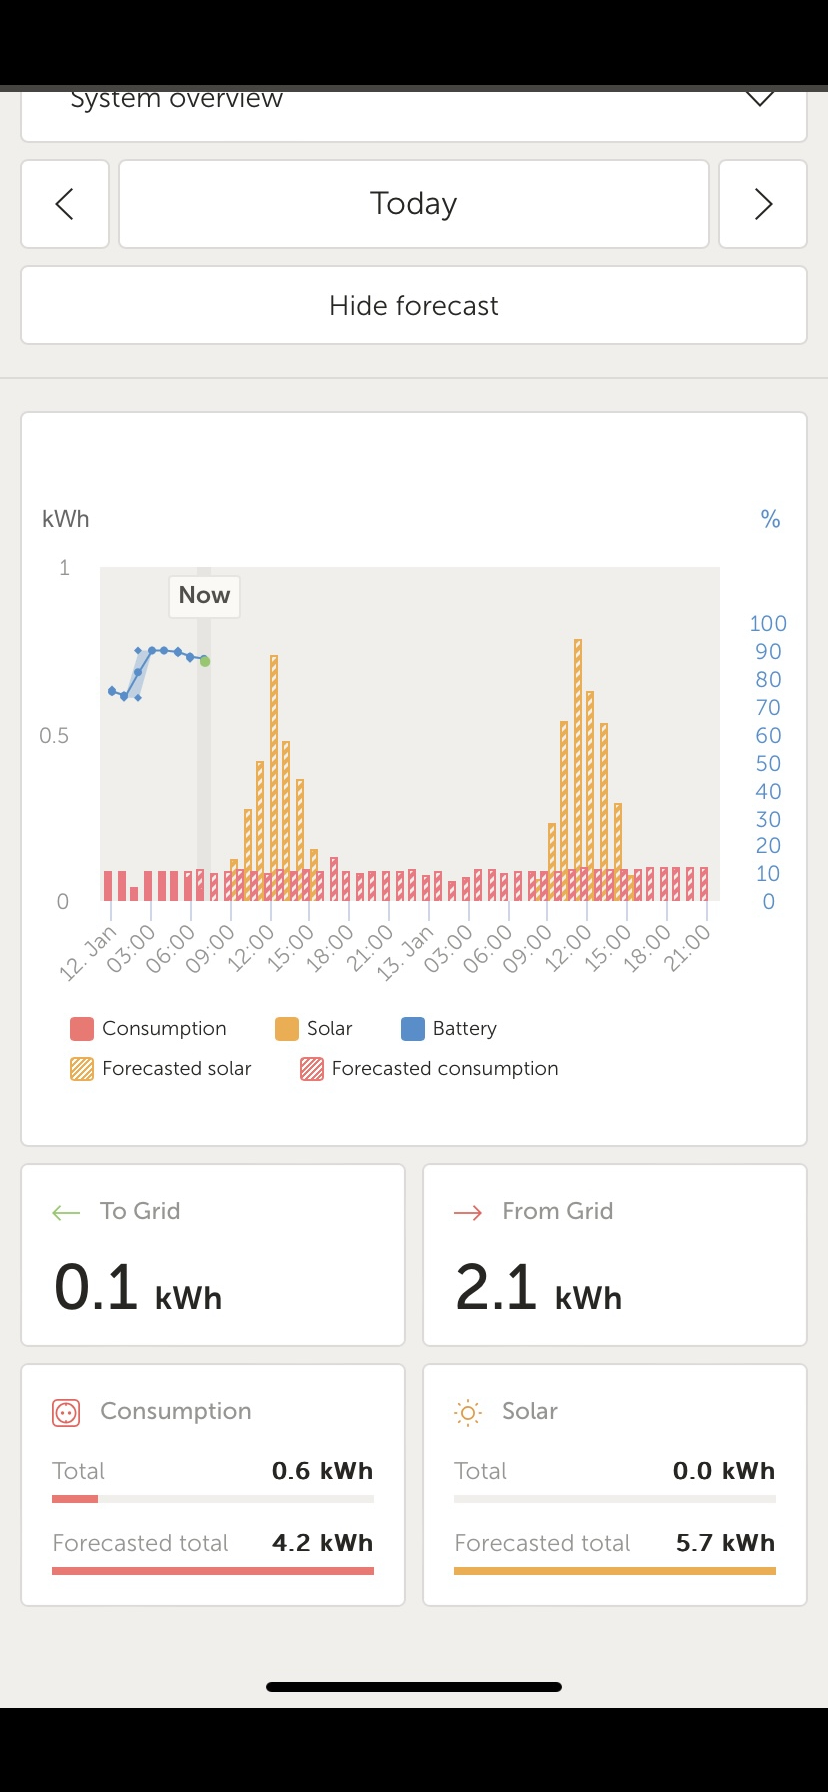
Hello. Not sure if this is the best place to comment. A little while ago the TODAY option changed to show the NEXT 2 DAYS forecast. Using current VRM and latest prod. software release (12/1/24). Is there a setting or bug introduced? It’s more convenient to see TODAY only instead of trying to roughly divide by 2. Thanks for any update. This happens in both production and beta VRM screens.

0 Likes 0 ·
img-0861.png (455.2 KiB)
22 Answers
kladz avatar image
kladz answered ·

Hello,

Please put two buttons one for solar forecasts and another for consumption. I do not want to see the consumption forecasts.

1 comment
2 |3000

Up to 8 attachments (including images) can be used with a maximum of 190.8 MiB each and 286.6 MiB total.

Thanks for the feedback @Kladz - exactly the sort of thing we were wondering
2 Likes 2 ·
semlohnhoj avatar image
semlohnhoj answered ·

Fantastic stuff. I'll see if this helps me with forecasting overnight charging with my Octopus tariff in the UK. I charge from grid from 00:30 to 04:30 but only what I need to based on predicted solar and predicted usage. Hoping this provides a better set of predictions to use for this.

3 comments
2 |3000

Up to 8 attachments (including images) can be used with a maximum of 190.8 MiB each and 286.6 MiB total.

semlohnhoj avatar image semlohnhoj commented ·
Is this available via the VRM API?
1 Like 1 ·
nickdb avatar image nickdb ♦♦ semlohnhoj commented ·
It is, just undocumented at present.
2 Likes 2 ·
hominidae avatar image
hominidae answered ·

...don't have a screenshot ready, but a few days ago I noticed the consumption forecast to show zero (0) kWh for one or two hour-slots....which is impossible, as my consumption baseload in my ESS is approx 450W during the day.

As a side note: I am charging two EVs (normally 1phase up to 32A each, normally not concurrently) with a non-victron solution/walllbox, which then contributes to the total consumption. I will try and investigate how the forecast behaves, when actually charging occurs.

1 comment
2 |3000

Up to 8 attachments (including images) can be used with a maximum of 190.8 MiB each and 286.6 MiB total.

Thanks for trying it out, It would be great if you could also get some screenshots next time something unusual happens to help us.
0 Likes 0 ·
hominidae avatar image
hominidae answered ·

...consumption forecast is way to high...maybe caused by the fact, that two EVs are "suckunig" in all PV available since 13:00 o'clock.

However, since this will reduce the "to-grid" values (should be detected), the algo "should" assume, that consumption is related to excess-PV power and hence should not forecast a consumption way over PV forecast, but maybe just below that.

1690378276729.png

Edit: now, that cunsumption forecast for tomorrow and day-after-tomorrow is avaailable, I must say, that this forecast is completely wrong.

The algo seems to assume, that a certain load will be the baseline and when the actual consumption is quite high (i.e. when chargeing an EV), it simply assumes that this load will go on forever (tomorrow and day-after-tomorrow)..see piic below.

1690532266519.png


1690378276729.png (67.4 KiB)
1690532266519.png (61.9 KiB)
6 comments
2 |3000

Up to 8 attachments (including images) can be used with a maximum of 190.8 MiB each and 286.6 MiB total.

mvader (Victron Energy) avatar image mvader (Victron Energy) ♦♦ commented ·
Hi, the system forecasts available solar production.


Its does that under the assumption of there being enough demand (by loads, or by battery that needs charging, or by selling back to the grid, or a combination of all that) to keep producing at (the) maximum power (point) throughout the day.


This is very nice for situations where people can plan their loads, either manually or automaticallly, to optimise PV production.

And/but also means that in systems, such offgrid or grid-tied with feed-in disabled, where demand reduces once battery is full, that the forecast will deviate largely from the actual.


We’re working to document/clarify this better.

2 Likes 2 ·
hominidae avatar image hominidae mvader (Victron Energy) ♦♦ commented ·
Agreed, but my system is an ESS (so grid tied only), where feed-in is not disabled.

Here the (non victron) wall-box will adjust EV charging / consumption based on PV access (not forecast) to avoid grid consumption (not avoiding feed-in, though). It will respect charging occurring to the home battery, when the ESS decides that this is required, as well..

So detection of the consumption behaviour scheme is not based on what you describe as the cause/use case, isn't it? IMHO the algo should detect, that consumption is somewhat related to PV excess and should not assume that this consumption trail will continue after ssunset, but shoud return to the "normal" baseline (maybe the average consumption of the last ten "tuesdays" past)

0 Likes 0 ·
mvader (Victron Energy) avatar image mvader (Victron Energy) ♦♦ hominidae commented ·
Hi again, my apologies!


I misread your first message. I thought it was about solar forecast. Instead of consumption forecast. So my reply is also totally about solar production/yield forecast. Not consumption-.


For the consumption forecast: thanks for the feedback. To be honest, its early days for that - and really complex.

0 Likes 0 ·
hominidae avatar image hominidae mvader (Victron Energy) ♦♦ commented ·

@mvader (Victron Energy) no worries.

Yes, I totally agree...consumption forecasts will be a very complex thing...so many thanks for trying !!!

Here's another usecase, which needs "detection": We/family are on vacation atm (now 5 days away from home) and consumption forecast does not detect the absence of users (home is on constant load, consuming approx 0.33kWh/h) ;-)

Consumption forecast for tomorrow still assumes, that someone is home AND does not detect the baseline (reports 0 kWh consumption, which is impossible).

1690995760639.png


0 Likes 0 ·
1690995760639.png (48.2 KiB)
Peter avatar image Peter hominidae commented ·
In GbbVictronWeb you can have separate Profile of Loads for Vacation and setup start and end day of Vacation.
0 Likes 0 ·
sharpener avatar image sharpener Peter commented ·
That's a really useful feature which I think Victron should add.


Ideally it would also be operated by an external contact connected to one of the Aux inputs on the Multi. Then when we arrive at our second home and turn everything on it would load the "at home" consumption profile.


Though I can see that turning it on remotely in advance would provide better information this isn't always possible.
0 Likes 0 ·
ojack avatar image
ojack answered ·

Hi,

I have two issues:

1. Consumption forecast is to low. There are several hours with zero. Basic consumption is about 500W. Day total should be not less then 12kWh.

screenshot-2023-07-27-125843.jpg

2. I found out that you added "tomorrow" and "day after tomorrow". Tomorrow is the same issue as today. Consumption forecast ist to low. In "day after tomorrow" consumption forecast looks better. But in "tomorrow" and "day after tomorrow" is shown the recorded consumption and solar from today.screenshot-2023-07-27-130106.jpg


5 comments
2 |3000

Up to 8 attachments (including images) can be used with a maximum of 190.8 MiB each and 286.6 MiB total.

Thanks @OJack,

I've asked the team to have a look.

0 Likes 0 ·
ojack avatar image ojack Guy Stewart (Victron Community Manager) ♦♦ commented ·

Now I found something in addition.

If I switch to "tomorrow" or "day after tomorrow" and then reload the Website "F5" the view changes and showes the forecast without daily sums and without the recordings from today

screenshot-2023-07-27-132115.jpg


After some reloadings the Consumption forecast for today got better too. The hours with zero are gone but its still a bit to low.

0 Likes 0 ·
Hi @OJack,

Have you noticed if the consumption forecast accuracy has improved?

0 Likes 0 ·
ojack avatar image ojack Guy Stewart (Victron Community Manager) ♦♦ commented ·
Hi,

yes I think its much better now. I'm excited to see what it will be like when my heat pump starts heating in the next few weeks.

A little offtopic but I think the pv forecast is a little too optimistic. especially when changing clouds are forecast. This could perhaps be a problem if you want to recharge the battery at night based on PV and consumption forecasts as little as possible but as much as necessary with cheap electricity.

But overall great work. Keep going...

0 Likes 0 ·
PV forecast improvements to be more sensitive to the weather are already in the dev model pipeline
1 Like 1 ·
roger-seibel avatar image
roger-seibel answered ·

I like the solar forecast very much, especially for my calculations an programmings with nodered, iobroker etc. The forcasts for tomorrow, and the day after tomorrow ar great.

I hope the day after tomorrow will be supported in the vrm api too, in the moment i see only the first and second 24 hours.

But i support ojack's opinion: The recorded data for consumption and solar for 'today' should NOT be considered and added to the values for tomorroy and the day after tomorrow in the vrm portal (and perhaps later in the vrm-api). There you should only show the forcast data.

Regards,

Roger


2 comments
2 |3000

Up to 8 attachments (including images) can be used with a maximum of 190.8 MiB each and 286.6 MiB total.

Hi @Roger Seibel,

Has this day after tomorrow limitation been changed now?

You should be able to access up to 7 days of estimated data.

0 Likes 0 ·
roger-seibel avatar image roger-seibel Guy Stewart (Victron Community Manager) ♦♦ commented ·

Yes! I checked that out after every new beta, works since a while. Now i am waiting for the same values regarding the estimated consumption and calculated SOC ;-)

Working as a software engineer for over 45 years i have to say: The software (and hardware) quality of the victron ecosystem is outstanding. Stabillity, functionality, user interface, software interfaces, forum, beta program etc. is great! As a user of a private home system i have great fun playing around with all the components. Waiting for retirement, to get more time for doing that...

Regards, Roger

1 Like 1 ·
Tobias Ambrosi avatar image
Tobias Ambrosi answered ·
Nice feature. Would love to also see a blue dotted estimation line for SOC based on estimated consumption and solar.
1 comment
2 |3000

Up to 8 attachments (including images) can be used with a maximum of 190.8 MiB each and 286.6 MiB total.

Hi @Toby82,

We are working on another estimation feature now that takes into account the projected state of charge, I'll pass on your suggestion to see if it can be added to the UI.

2 Likes 2 ·
stroller avatar image
stroller answered ·

I'm liking this feature very much. On my installation the forecast consumption values are looking pretty accurate at the moment.

What I would like to see if it is possible, on both the Solar and Consumption graph is that when the time has gone past the forcasted data (so you are looking at the Recorded Data on the left of the graph), if a line in each hourly block could be placed there that shows what the forecast for both the Solar and Consumption value was so that one can see just what the forecast was in comparison to what was actually recorded.

Apart from that at the moment, great work and many thanks to the VRM team and Victron for this. Looking forward to it going live on the main VRM.

Best regards, Chris.

2 |3000

Up to 8 attachments (including images) can be used with a maximum of 190.8 MiB each and 286.6 MiB total.

kladz avatar image
kladz answered ·

Hello, In dashboard icon for grid is missingcapture-decran-2023-08-15-094817.png


2 comments
2 |3000

Up to 8 attachments (including images) can be used with a maximum of 190.8 MiB each and 286.6 MiB total.

This has now been fixed :)
1 Like 1 ·

That's a strange bug, thanks for reporting @Kladz

0 Likes 0 ·
fish avatar image
fish answered ·

forecast.jpg
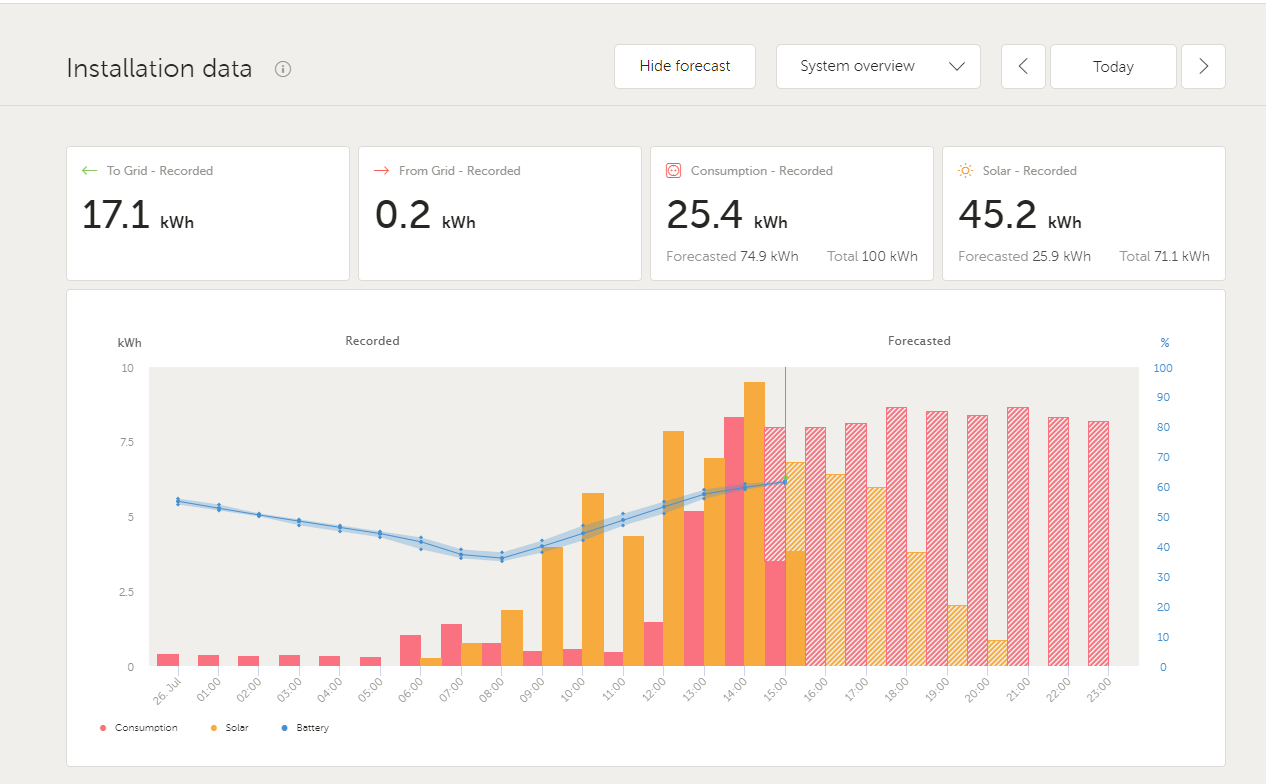
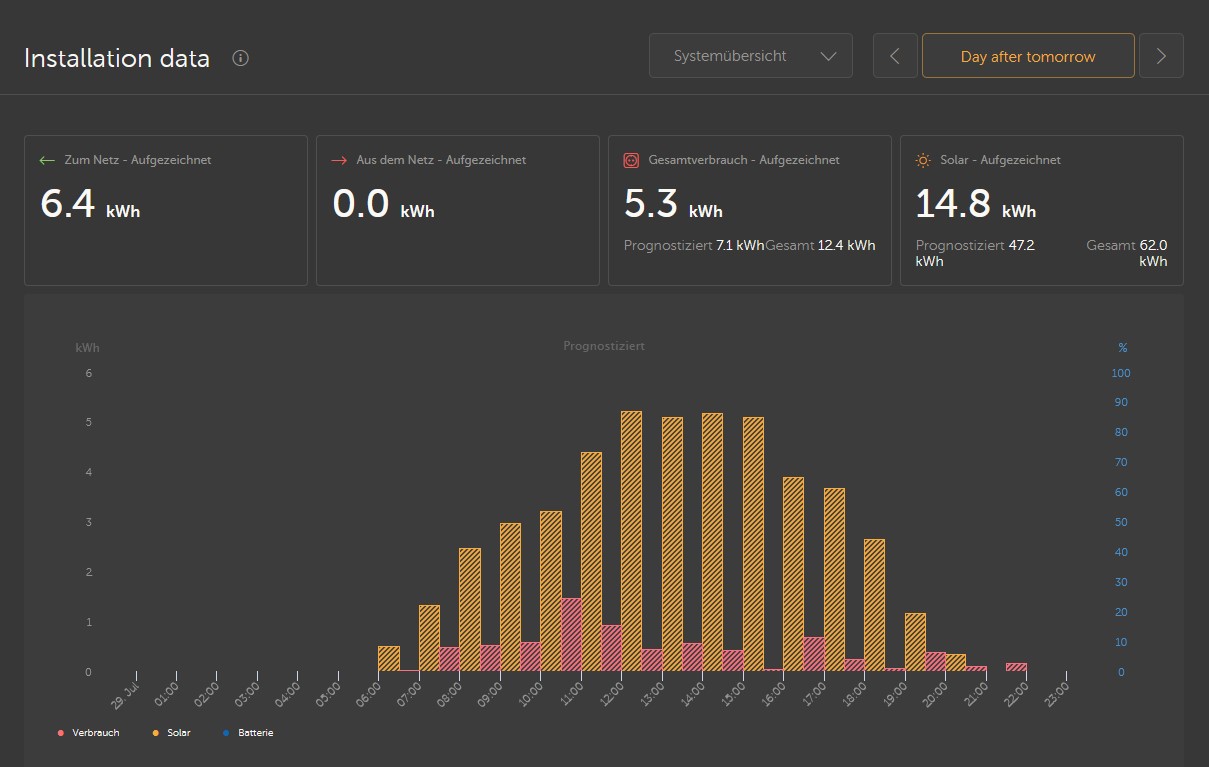
I've previously seen the consumption forecast in Beta, however just logged back in today and no graphicla consumption forecast. I've tried refreshing, changing days and back to today, hide and unhide forecast but it isn't showing?

It is forecasting consumption as that is showing in the totals box just nothing displayed on graph. Solar forecast is fine and there are gaps in the graph where consumption should be..


forecast.jpg (104.8 KiB)
4 comments
2 |3000

Up to 8 attachments (including images) can be used with a maximum of 190.8 MiB each and 286.6 MiB total.

ojack avatar image ojack commented ·
I found out that you can switch all channels in the diagramm on and off by clicking at the description below the diagramm.

In your screenshot Forecast consumption is not activated.


2 Likes 2 ·
hominidae avatar image hominidae ojack commented ·
...good catch...new feature and deactivated by default, as it seems unlike solar forecasts...never thought of that/couldn't find it first, without my glasses on.
0 Likes 0 ·
hominidae avatar image hominidae commented ·
...same here.
0 Likes 0 ·
ojack avatar image ojack hominidae commented ·

same here, but it's beta and I am sure the function will be improved and come back.

0 Likes 0 ·
hominidae avatar image
hominidae answered ·

...it just occurred to me that, with solar- and consumption-forecasts available, there could be to-grid and from-grid (and generation) forecasts made as well, couldn't it?

@Guy Stewart (Victron Community Manager) many thanks for for making the previews possible. Keep up the good work! My next wish is a consumption-/solar-forecast based SoC/SoH Management (next gen. Battery Optimizer in the ESS for Lithium Batteries (normally keep SoC between 20% - 80%; top-up to 100% every 5-10 days; prioritize with/against dynamic ESS) ;-)

1 comment
2 |3000

Up to 8 attachments (including images) can be used with a maximum of 190.8 MiB each and 286.6 MiB total.

Peter avatar image Peter commented ·
Check gbbvictronweb.gbbsoft.pl for SoC forecast for next 24h and charge/discharge management based on energy price.
0 Likes 0 ·
kladz avatar image
kladz answered ·

Hello.


Issue in the past text while forecast is tomorrow.erreur-temps.png


erreur-temps.png (17.7 KiB)
3 comments
2 |3000

Up to 8 attachments (including images) can be used with a maximum of 190.8 MiB each and 286.6 MiB total.

Hi @Kladz,

I'm sorry I don't speak French, what should it say?

0 Likes 0 ·
hominidae avatar image hominidae Guy Stewart (Victron Community Manager) ♦♦ commented ·

@Guy Stewart (Victron Community Manager) ...it's a nuisance in the APP (not in Web-UI and also in production, not beta):

When displaying "today" and selecting a forcasted hour with your "mouse-over", displaying their values, then switch back in time-line from "today" to i.e. "yesterday" ("demain", in french) with the button, that error message occurs.

Edit: it also "works", when you go forward in time, like to "tomorrow".

screenshot-20230915-103614-vrm.jpg

0 Likes 0 ·
Guy Stewart (Victron Community Manager) avatar image Guy Stewart (Victron Community Manager) ♦♦ hominidae commented ·
Thanks @Hominidae
The engineers will make a change
2 Likes 2 ·
g8n avatar image
g8n answered ·

Hello, is there an option to query this solar forecast and consumption forecast via API for Node-Red? I can already query the solar forecast via the VRM API. (victron-vrm-api)

2 |3000

Up to 8 attachments (including images) can be used with a maximum of 190.8 MiB each and 286.6 MiB total.

semlohnhoj avatar image
semlohnhoj answered ·

Yes, if you install the "victron-vrm-api" Node under "Manage Palette" you get access to them from there. You do need to generate a one off token to get access to your VRM instance which was a little confusing but once that's done you get the extra nodes in the palette.

https://flows.nodered.org/node/victron-vrm-api


https://vrm-api-docs.victronenergy.com/#/


2 comments
2 |3000

Up to 8 attachments (including images) can be used with a maximum of 190.8 MiB each and 286.6 MiB total.

g8n avatar image g8n commented ·

Thank you yes I already use that. I use that when there should be enough DC solar, the battery is charged exclusively via DC and all the AC solar is fed in or used for self-consumption. What I am still missing is the forecast for consumption.

1 Like 1 ·
carel-landman avatar image carel-landman commented ·

Hi there

Not sure if I'm missing something, but how do you access the consumption forecast via the "victron-vrm-api"? 1701784830441.png

0 Likes 0 ·
1701784830441.png (11.9 KiB)
g8n avatar image
g8n answered ·

Hello, in some installations the whole dashboard is gone.bildschirmfoto-2023-09-28-um-094826.png

bildschirmfoto-2023-09-28-um-094812.png


2 comments
2 |3000

Up to 8 attachments (including images) can be used with a maximum of 190.8 MiB each and 286.6 MiB total.

Hi @G8N,

Has this been resolved now?

0 Likes 0 ·
g8n avatar image g8n Guy Stewart (Victron Community Manager) ♦♦ commented ·

Yes, it work's.

0 Likes 0 ·
daniel-feist avatar image
daniel-feist answered ·

How long does it take forecast to learn that I charge the car and heat the hot water tank (20kWh+) at 2 a.m., but my base load is closer to 500W, rather than assuming 2kWh every hour all day?

I am testing Dynamic ESS and obviously, the consumption forecast plays a role in this algorithm and this is currently impacting (I think) the effectiveness of the Dynamic ESS.

In my case, the car charging is an "AC Load" (parallel to victron) and the hot water tank and all other loads are "Critical Loads". I assume this shouldn't impact things though, as the forecast I assume is based on total and does not differentiate between critical and non-critical, right?

1 comment
2 |3000

Up to 8 attachments (including images) can be used with a maximum of 190.8 MiB each and 286.6 MiB total.

Hi @Daniel Feist,

I don't know precisely, but from what I have read the consumption data is based on a rolling 28 days of hourly readings.

It has nearly been that 28 days since your post, have you begun to see improvements?

0 Likes 0 ·
roger-seibel avatar image
roger-seibel answered ·

It woukd be very nice to show a (raw) caclulation of the battery SOC line based on the estimated values for solar and consumtion ..

Regards, roger

1 comment
2 |3000

Up to 8 attachments (including images) can be used with a maximum of 190.8 MiB each and 286.6 MiB total.

Agreed, the team is looking into SOC projections as well.
1 Like 1 ·
andy156 avatar image
andy156 answered ·

I am running my own Dynamic ESS that I wrote in node red. One feature I find very useful that others might as well is a forecast of the spare/excess solar. Ie at the point of the battery being full and the future consumption during daylight hours being satisfied. Given I don't get paid for my export this can then be used to make decisions to charge the car/hot water tank etc.

2 comments
2 |3000

Up to 8 attachments (including images) can be used with a maximum of 190.8 MiB each and 286.6 MiB total.

iammotorhomeless avatar image iammotorhomeless commented ·

@Andy156 I to have been working on my own node red Dynamic ESS, without much success.

any chance you have shared yours any where ? would love to see it.

0 Likes 0 ·
andy156 avatar image andy156 iammotorhomeless commented ·

I've dumped some stuff here https://community.victronenergy.com/questions/238165/roll-your-own-dynamic-ess.html. I can't upload the whole project as there are too many links/passwords to sanitise. The scope of the project Is quite large but this is a starter for 10.

0 Likes 0 ·
mheinze5722 avatar image
mheinze5722 answered ·

Hi there... I can see the solar forecast since the start of my Victron system (about a month ago) and generally I am ok with the solar forecast after a month now (= training data for a month). Since a couple days I can see the consumption forecast in my graphs as well, and this is a really nice next step.

If I may, let me give you my background, so that you understand my thinking behind my proposal: I have a 60 kw peak PV system with a 60 kwh battery, grid-connected with surplus feed-in. I have a hourly consumption tariff, which means in an ideal world I want to pull grid-electricity in the cheapest hours of the day. I also have a heatpump in my house and an EV. I guess, for the future that is somewhat of a baseline case. Btw, I am a software architect/CTO kinda person with a team of 300+ devs, so I know just a littlebit about algorithms and software dev as well.

Couple of thoughts for the consumption forecast:

My consumption is largely (80%+) based on the heatpump activity, which in turn is largely based on the outside temparature. I am virtually always loading my EV with surplus PV electricity using a Victron wallbox.

As a consequence, I believe that my consumption is actually well predictable if we accept that the hourly distribution throughout the day might now be perfect - but that is fine. I know that my heatpump will work so many hours throughout the day (because a specific amount of heat needs to be 'created' when the difference between inside and outside temperature is so much). So, for me the daily consumption forecast would have more importance, and the exact distribution through the day is of minor importance.

Key factor for me would be to have an option to exclude surplus EV charging from all these projections... as this might be done by user when he/she needs it and most likely on days only where there is enough sunshine anyhow. When using the Victron Wallbox (as I do), you guys even have the data in your system already to account for that. In the forecast for the next 7 days (or similar), I would show your forecasted consumption numbers, but also a line for the average consumption per day from the last 7 days. When temperature does not change, this gives already a good indication whether daily production will be sufficient to recharge the battery fully or not.

Obviously, if you would just take the averages of electricity consumption of each hour of the last 7 days ( such as 1 am, 2am, 3 am, 4 am and so on), you can easily break the daily total down to the hour and project out the daily distribution of electricity into the 24 hours of each day (always assuming excluding surplus EV charging). That way you can properly display intra-day projections and also 'somewhat' reliably show a project SOC curve.

Next step of course (this is now me dreaming), would be to also show the hourly tariff in the chart, so that the user (and the Victron system) would know when the cheapest electricity of the day would be available so that you can utilize scheduled charging to pre-load the battery when necessary to the level required to make it through the next low without pulling from the grid at a more expensive time.

This way a Victron system would by design largely only pull electricty from the grid when it is utlized lowest and provide the cheapest option for your customers as well. (I am doing all this manually right now on those 30 something days a year where my daily production is not exceeding my consumption!).

In general, I believe it would be really helpful if you Victron guys would put a bit more description into how you come up with your forecast numbers: both solar and consumption forecast. Everybody knows this cannot be perfect, but the more you explain how you come up with these numbers, the better every user can apply it to his/her situation.

Thanks for reading so far and thanks to Victron to provide such a great technology base where so much potential is existing to streamline electricity production, usage and optimizations! ;-)

1 comment
2 |3000

Up to 8 attachments (including images) can be used with a maximum of 190.8 MiB each and 286.6 MiB total.

Hi @mheinze5722,

We will improve the documentation for the methods used for the calculations, and may or may not even open source them in the future.

But we're only going to focus time on that side of things once the solution is very stable. Right now there is still very active development, changes and so on, so it would not only distract the development teams, but also not be very useful yet.

1 Like 1 ·
Guy Stewart (Victron Community Manager) avatar image
Guy Stewart (Victron Community Manager) answered ·

Hi Everyone,

Consumption forecasting is now out of beta testing and available to everyone via the normal VRM dashboard.

Thanks to everyone who tested it and helped us with feedback.

It was decided that the dashboard consumption would be disabled by default, though you can enable it with a single click here;

cleanshot-2023-10-23-at-115306.jpg


2 |3000

Up to 8 attachments (including images) can be used with a maximum of 190.8 MiB each and 286.6 MiB total.

vladimir-1 avatar image
vladimir-1 answered ·

Jsem tu nový CZ. Lokalita jižně od Prahy. Pro mě je předpověď na 1 den docela dobrá

2 |3000

Up to 8 attachments (including images) can be used with a maximum of 190.8 MiB each and 286.6 MiB total.

gnagflow avatar image
gnagflow answered ·

Hi, I have many installation where the consumption forecast as well as the solar forecast work, but one installation, there is no consumption forecast during the night, although there is always 3-4kW of consumption all night... what could be the reason? The installation exists since more than a year.

1714927153997.png

that was yesterday for example:

1714927539422.png


1714927153997.png (139.6 KiB)
1714927539422.png (149.0 KiB)
2 |3000

Up to 8 attachments (including images) can be used with a maximum of 190.8 MiB each and 286.6 MiB total.

Related Resources