Hi Victron Community,
We've just launched a new solar forecast feature for VRM.
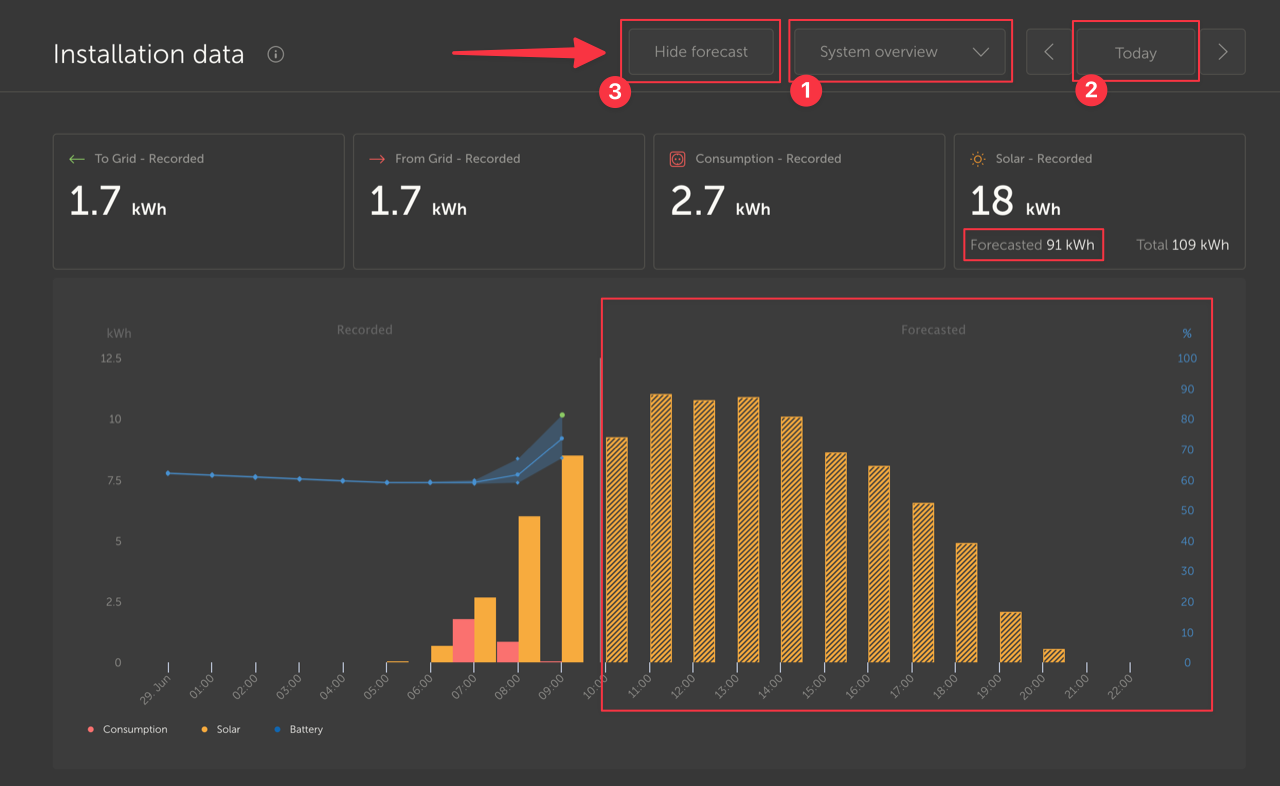
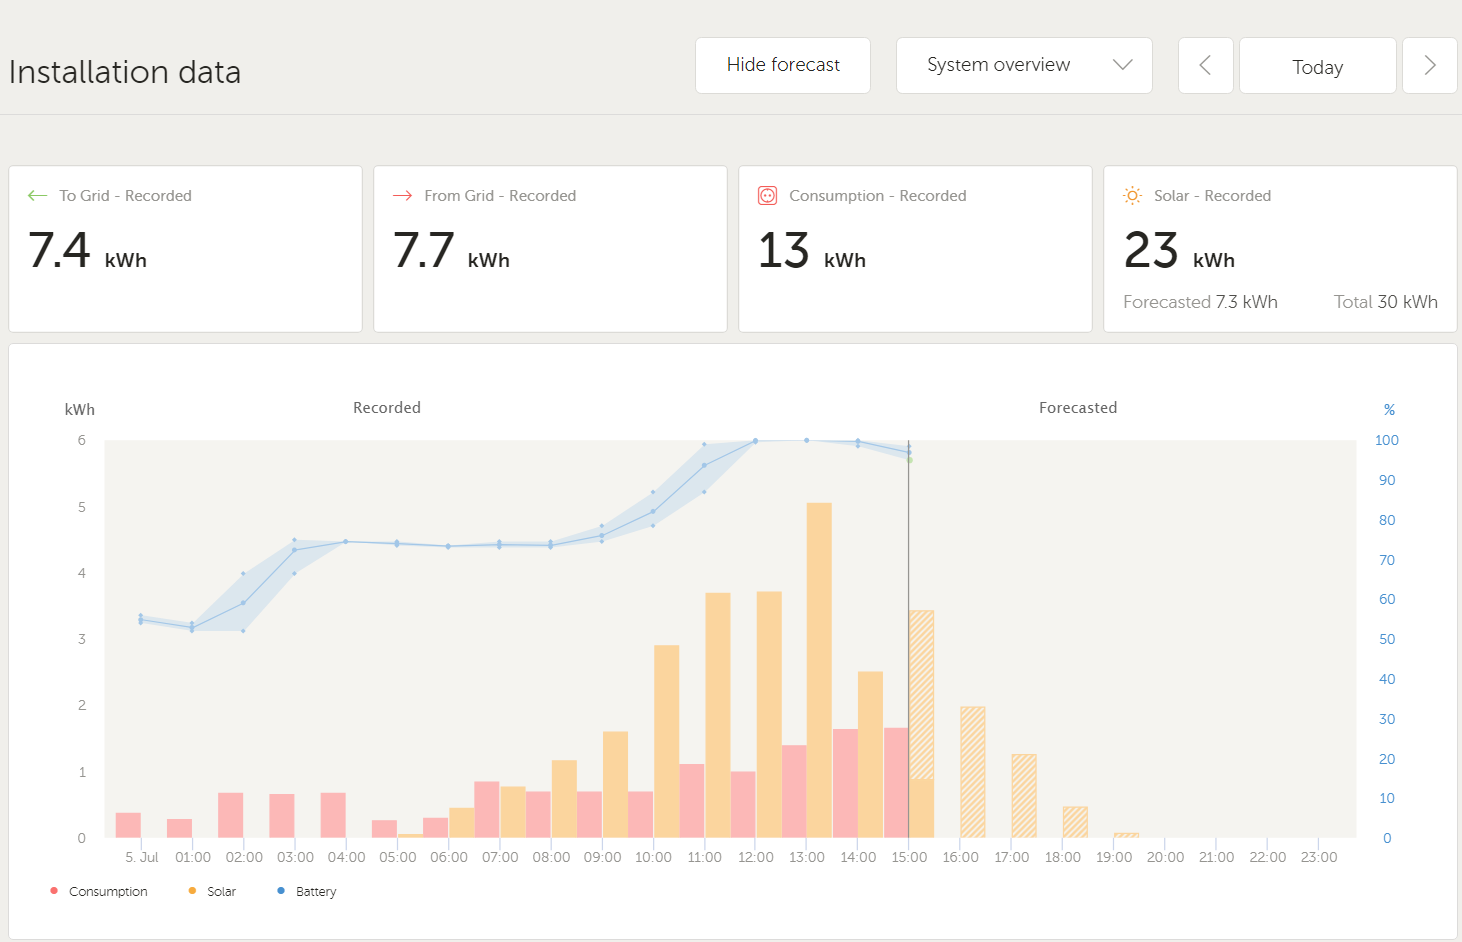
To use this, make sure you fulfil all the requirements:
- Your installation has a location set
- Your site is recording hourly solar yield
- You are on the ‘today’ view
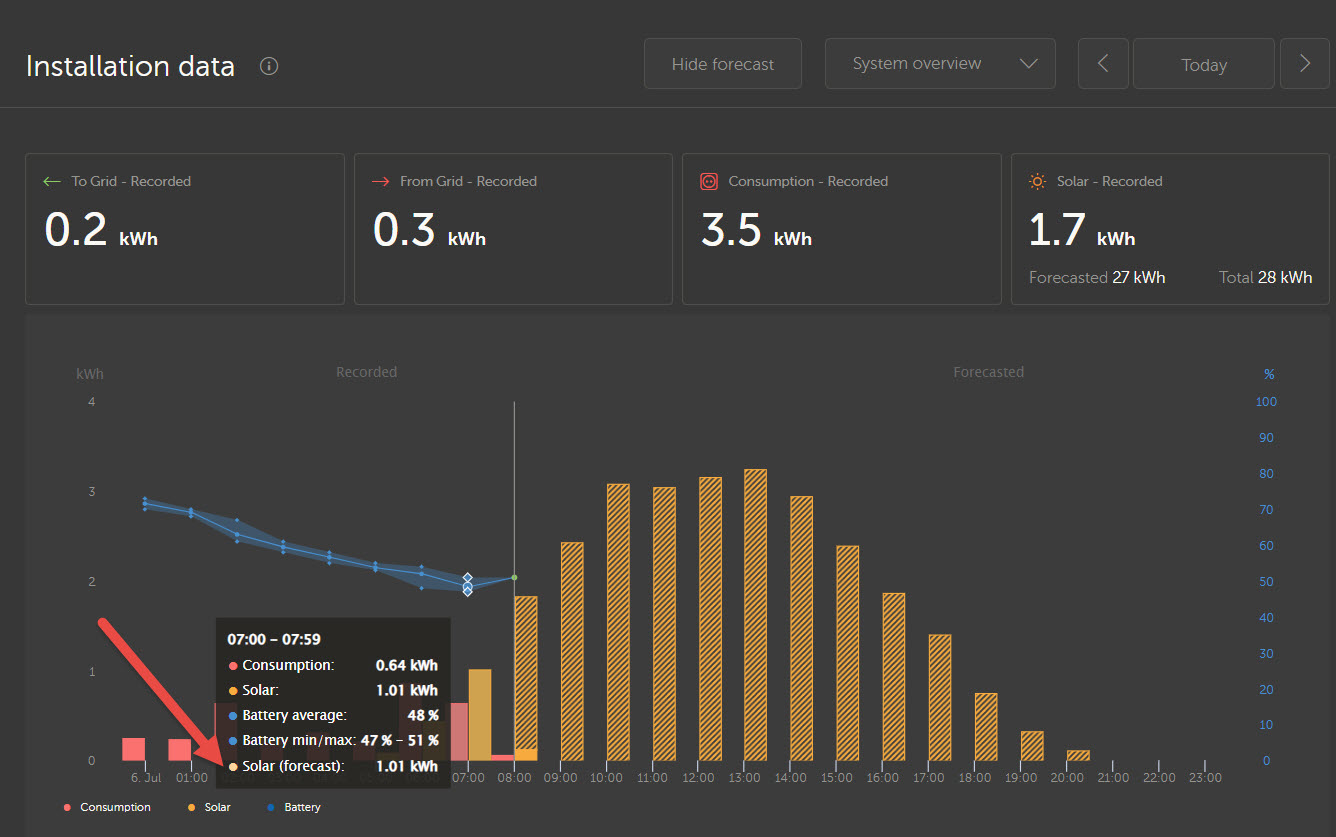
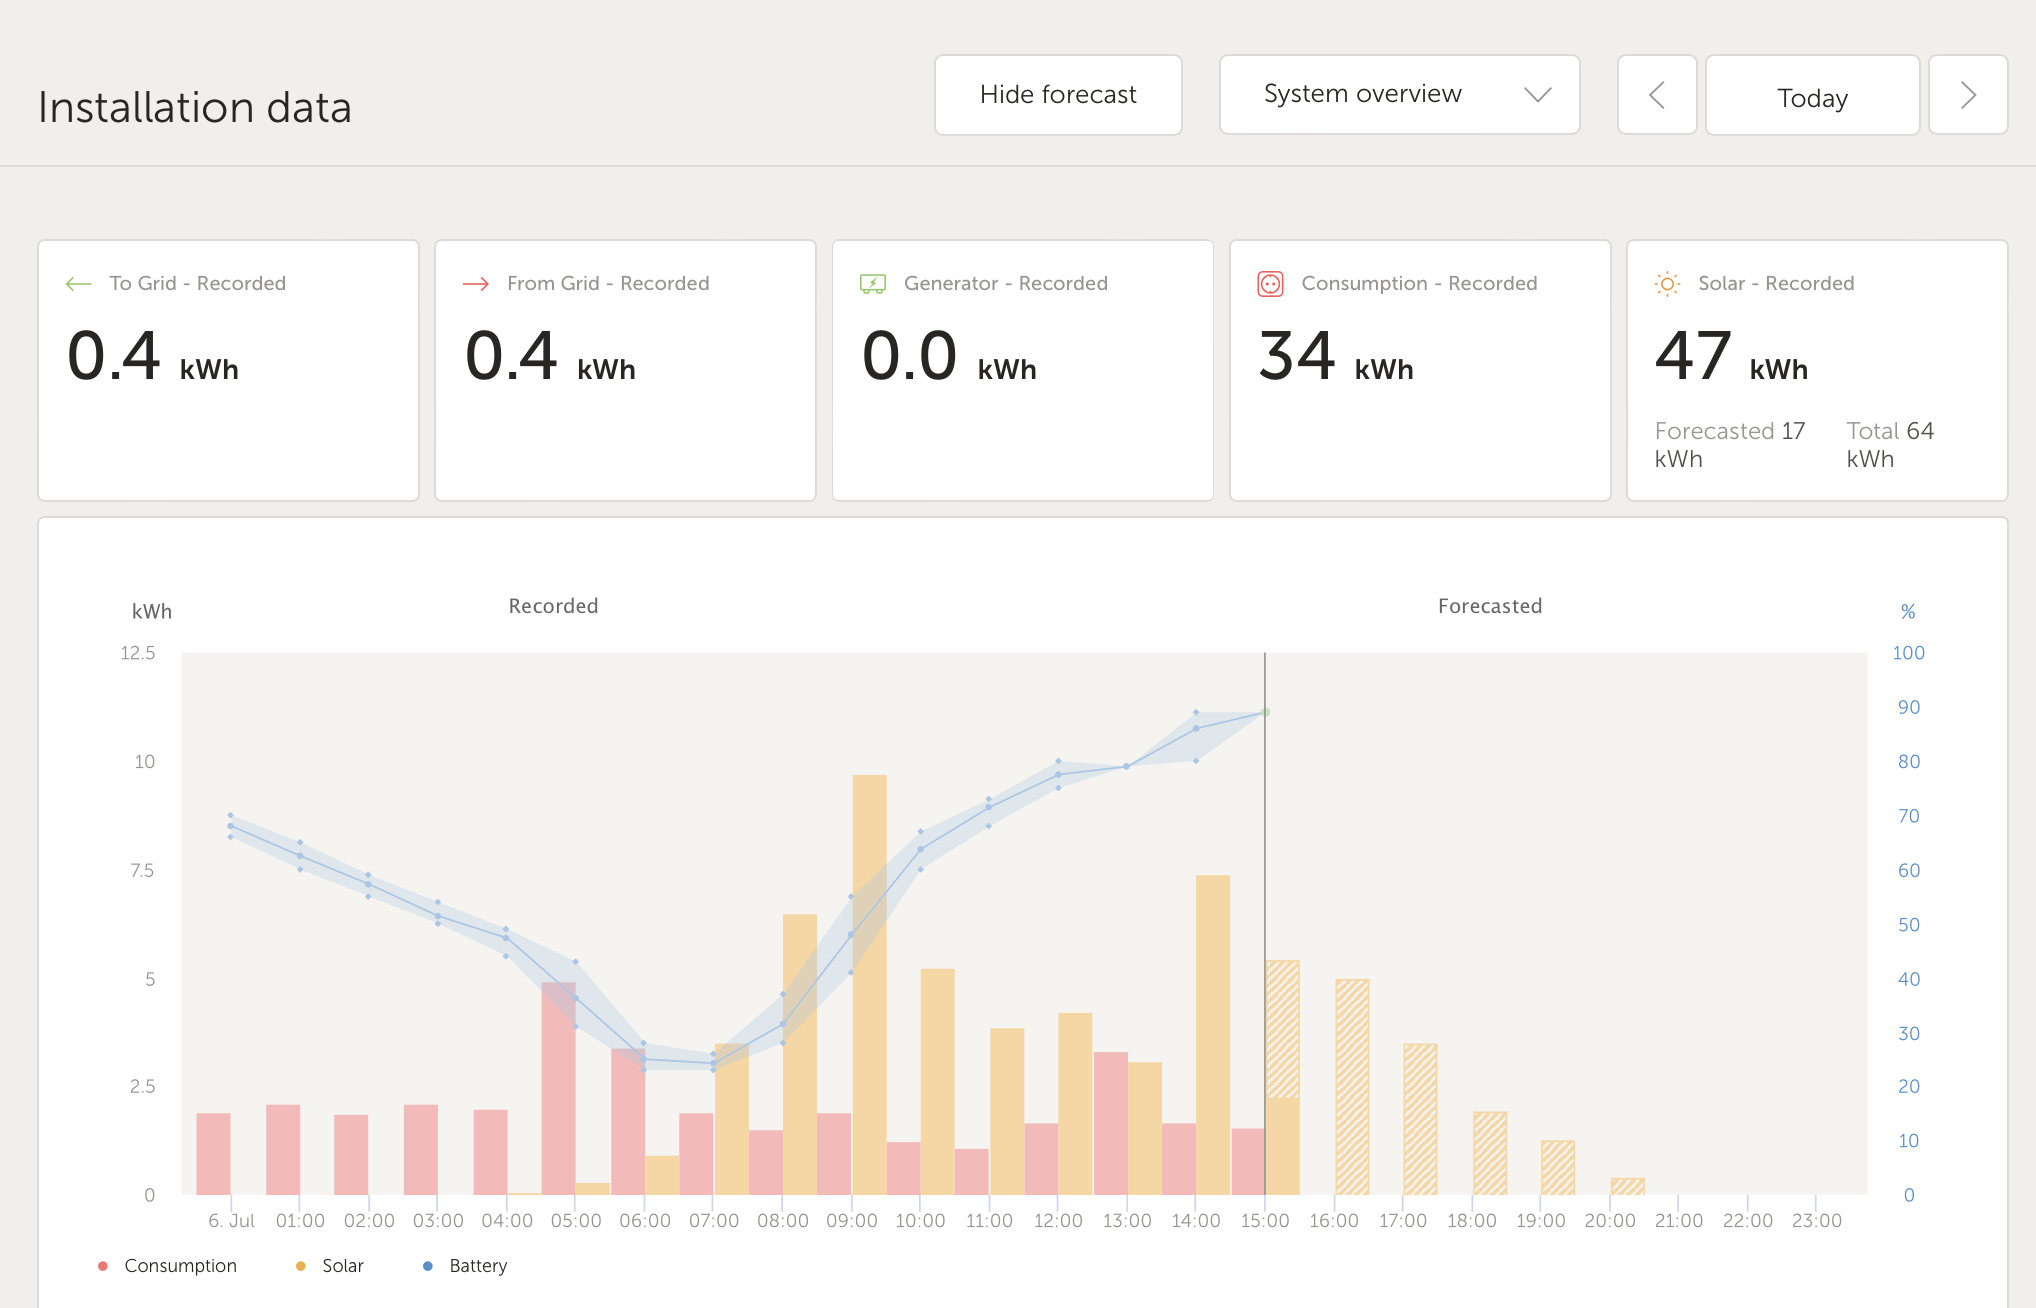
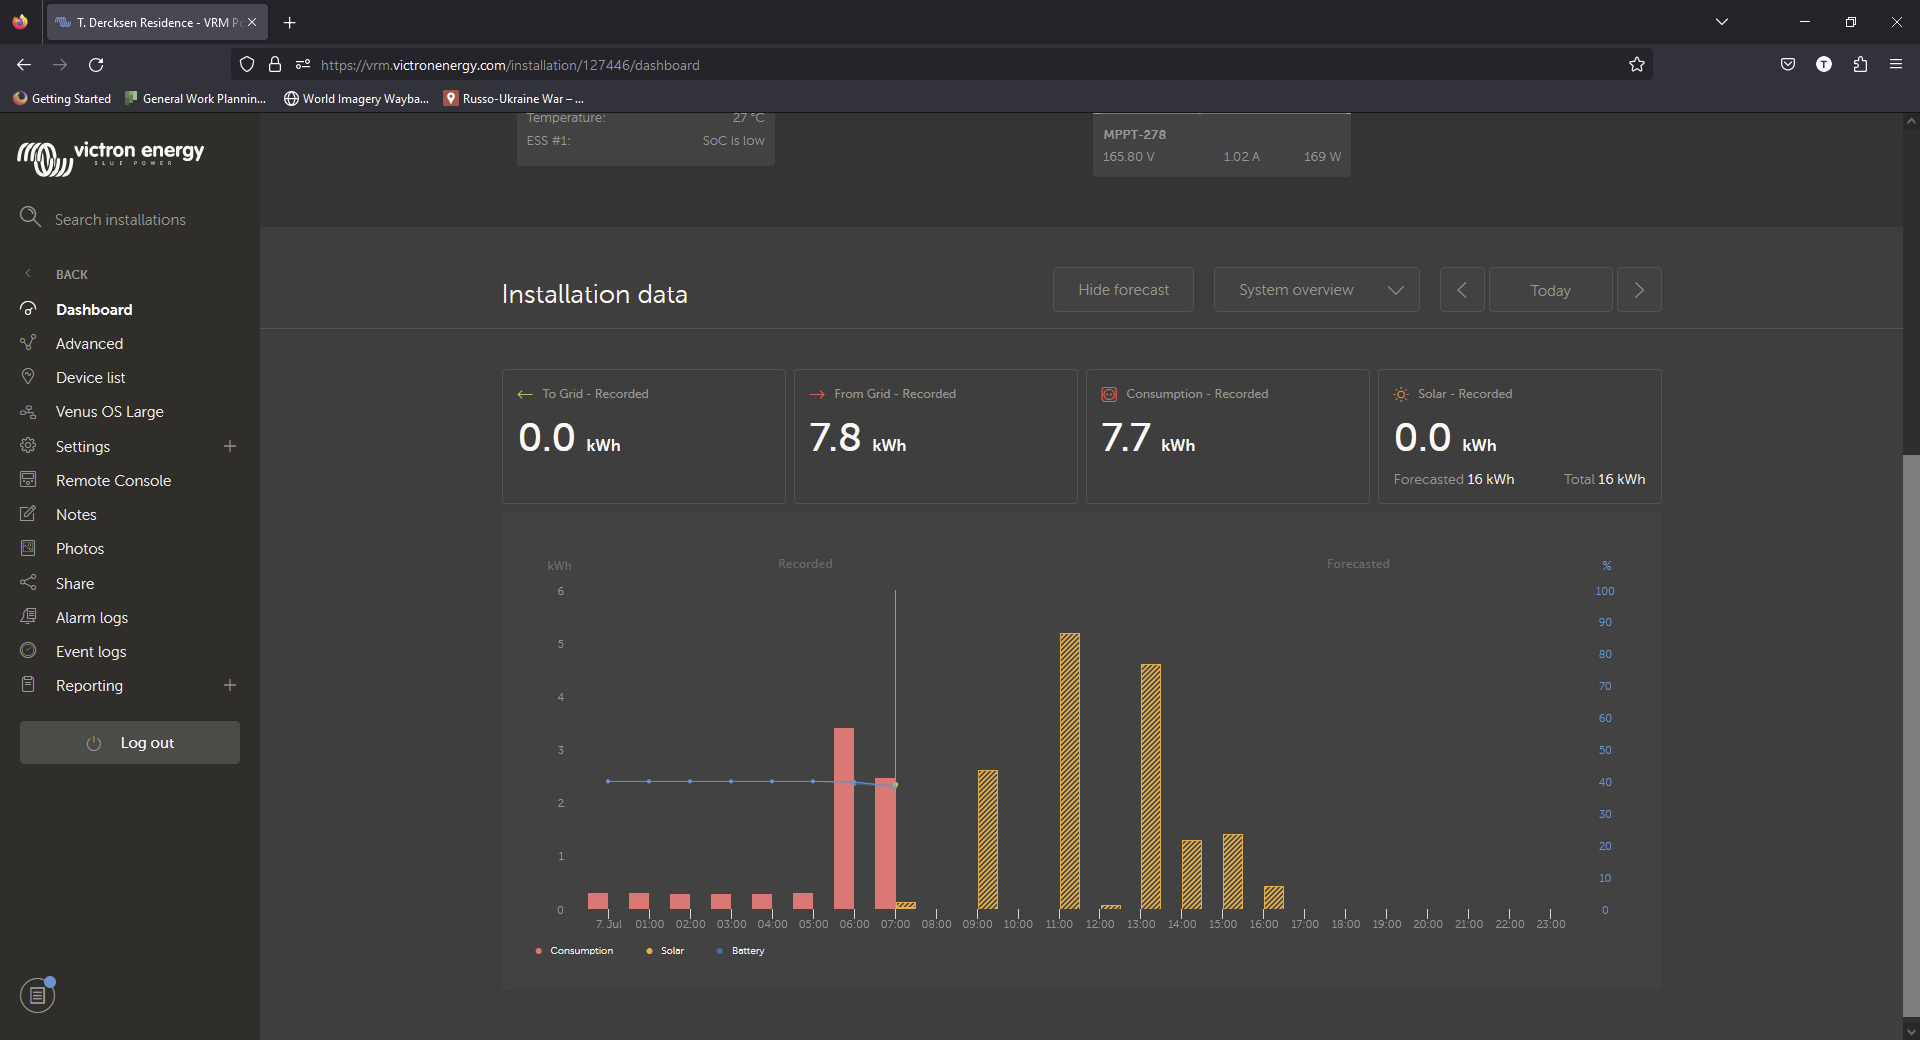
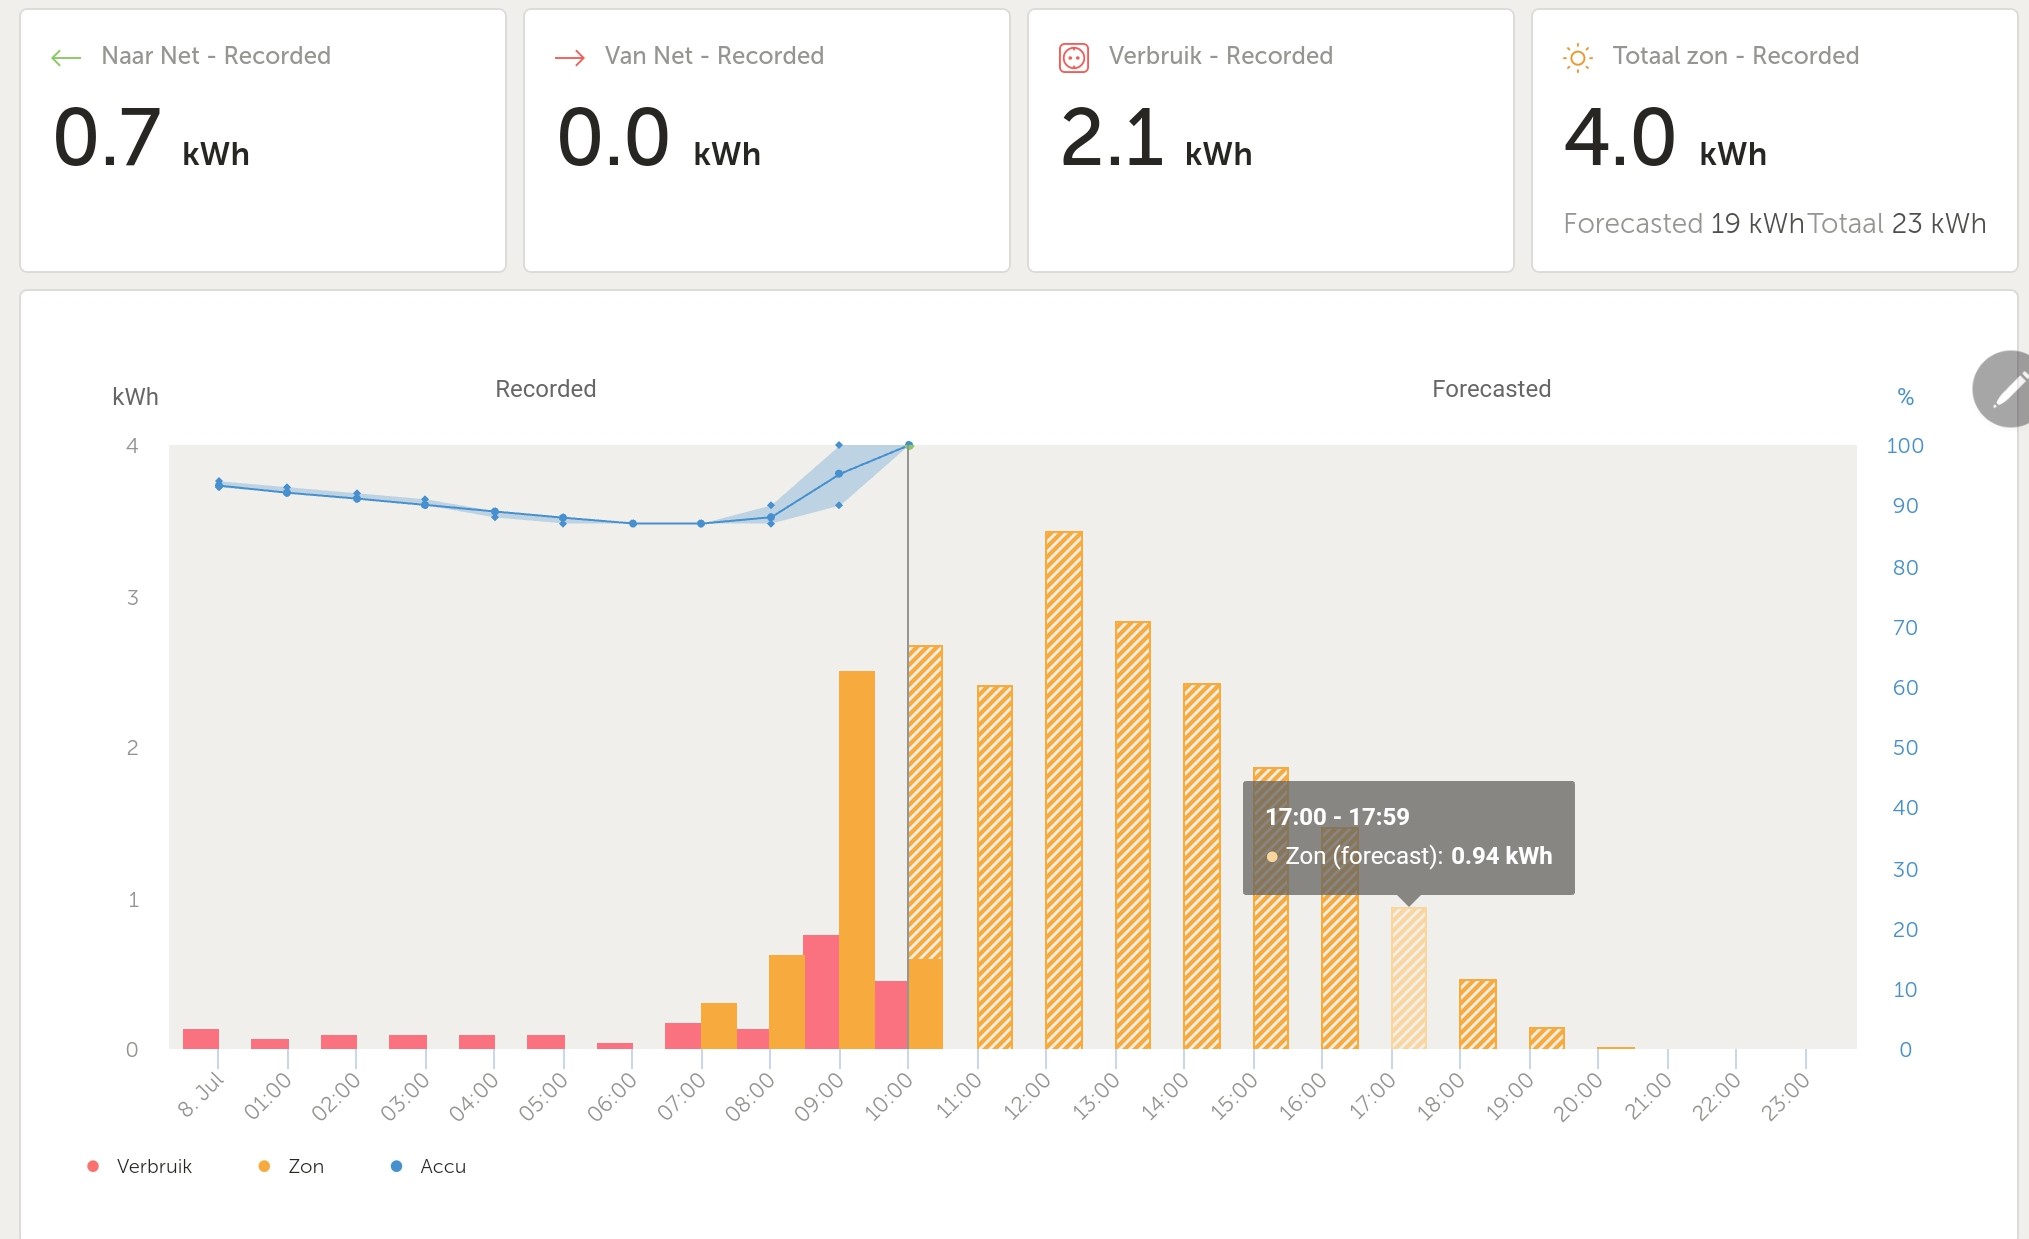
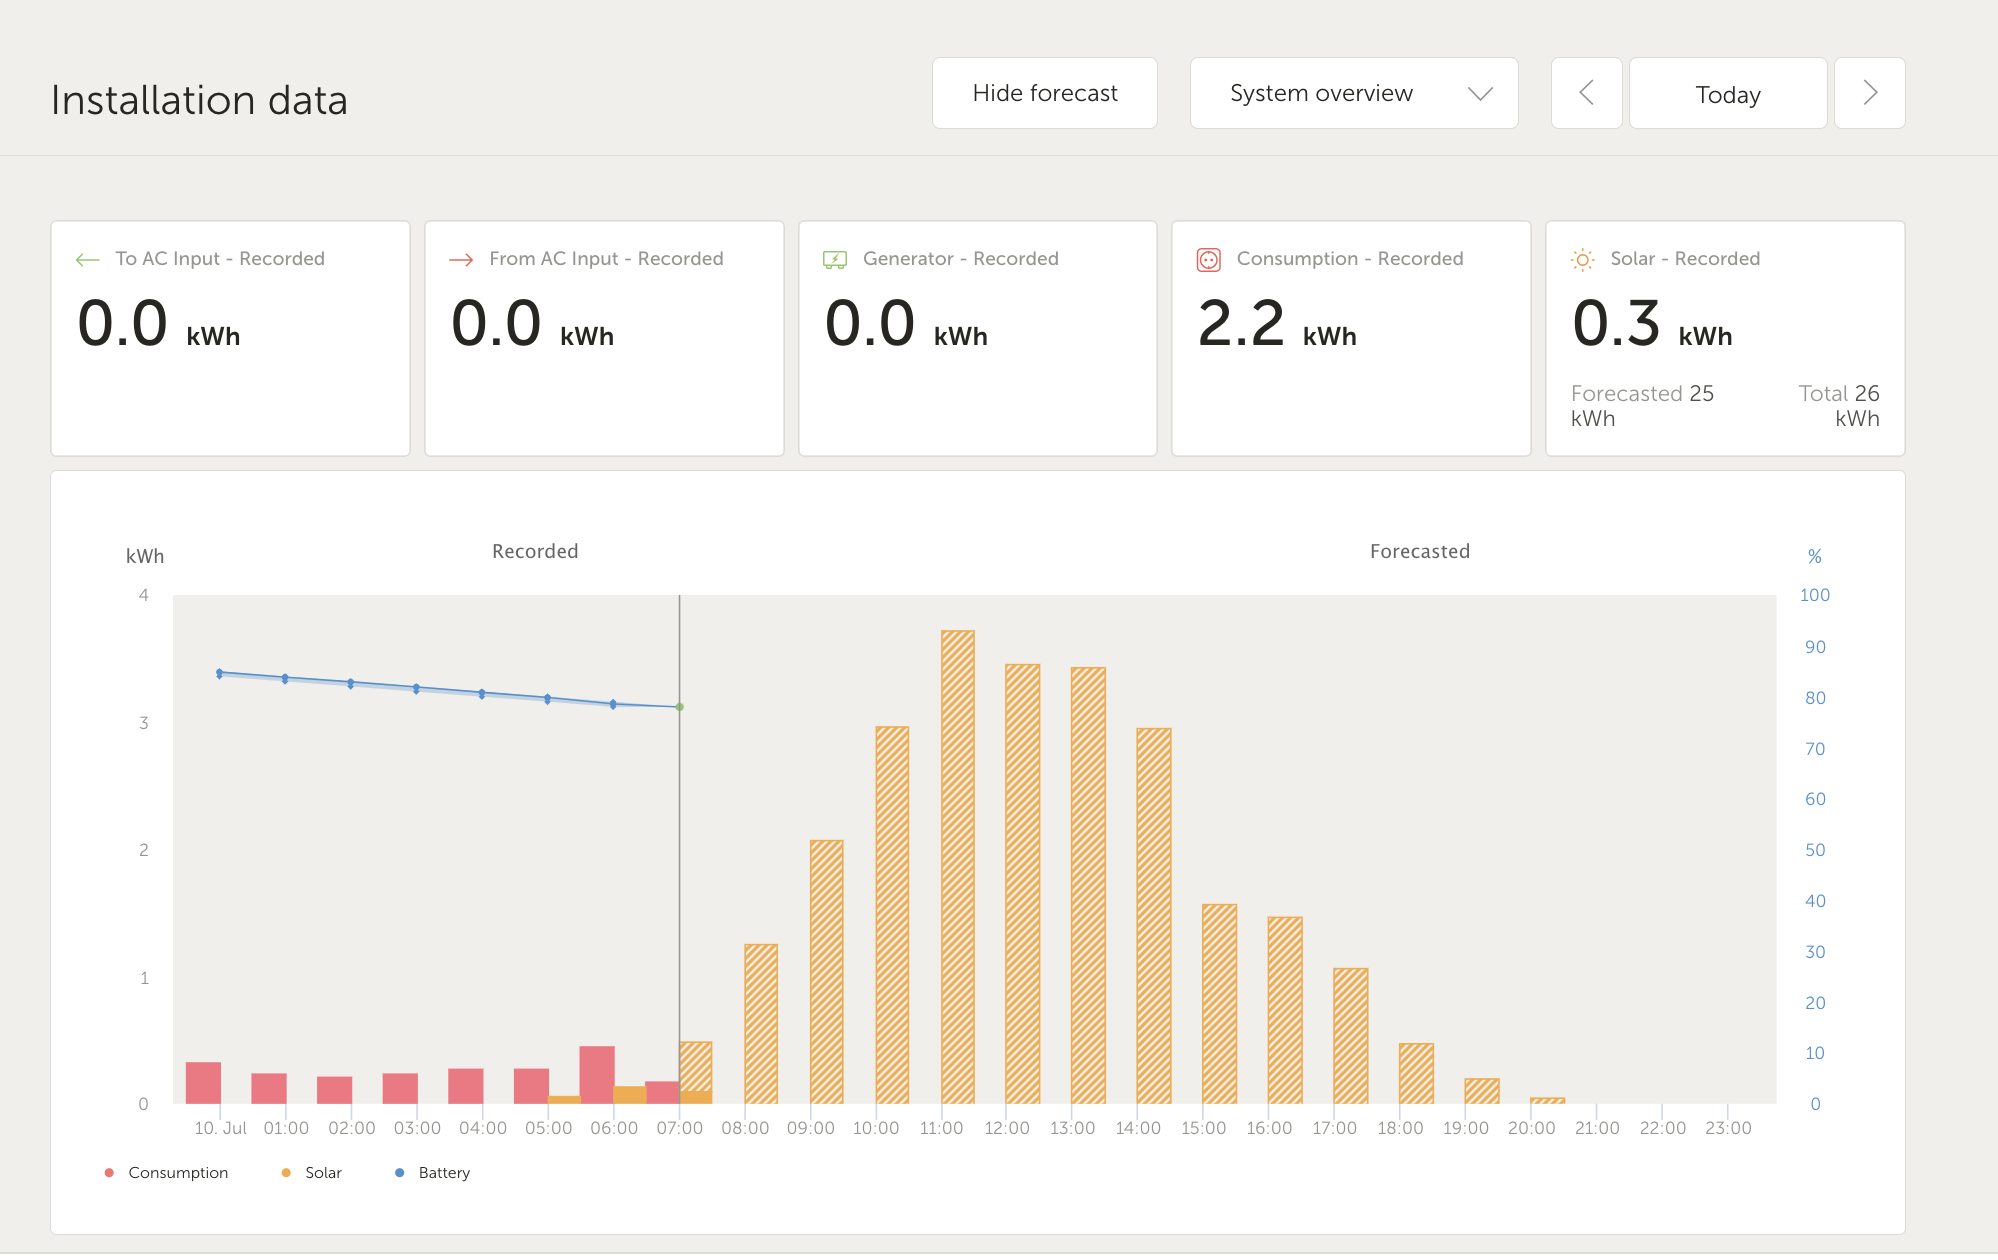
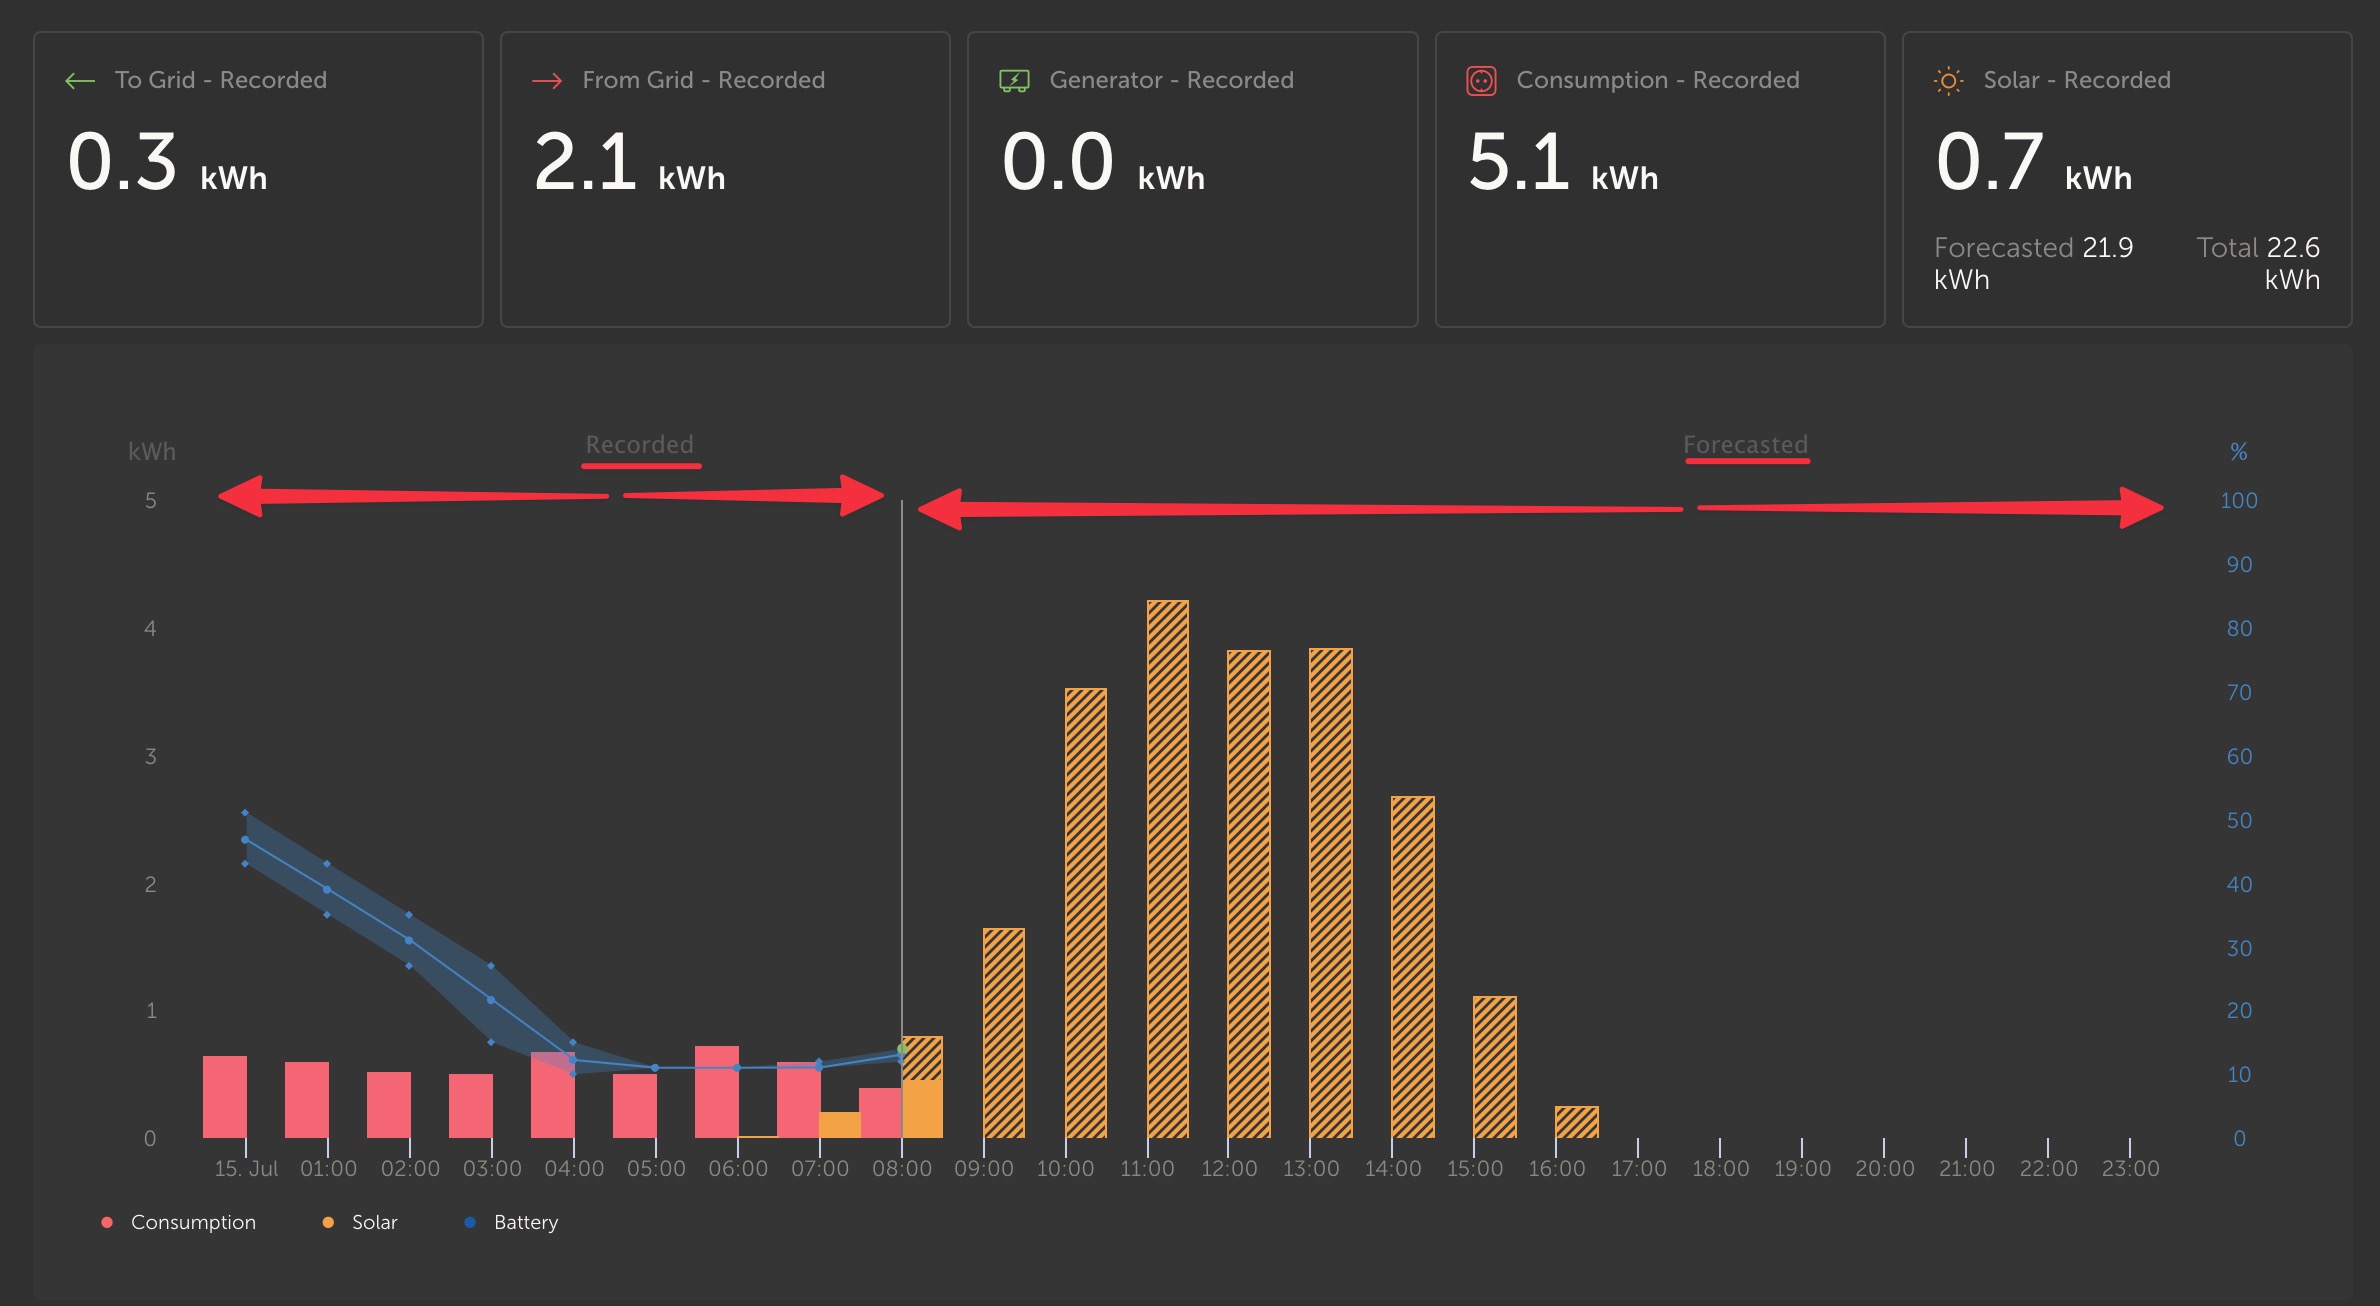
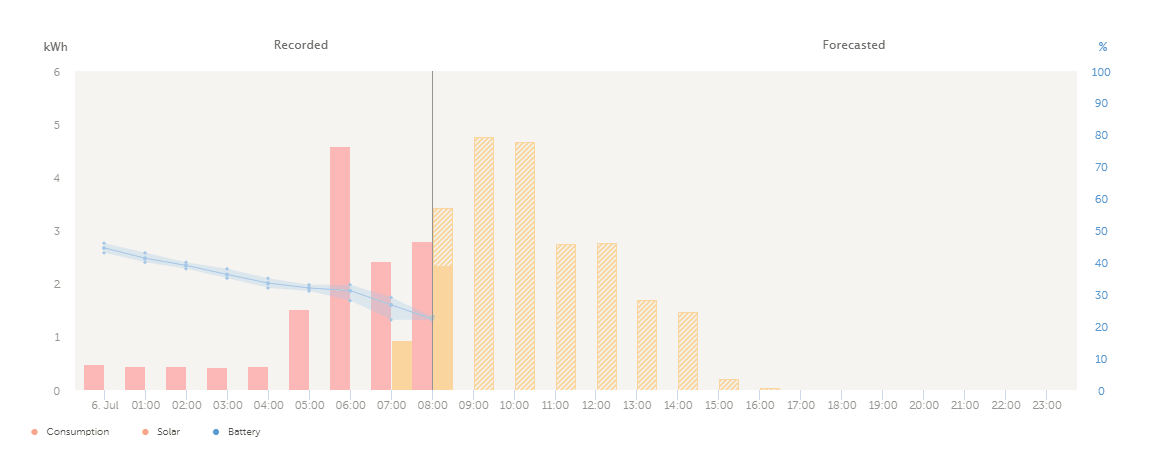
The major changes include:
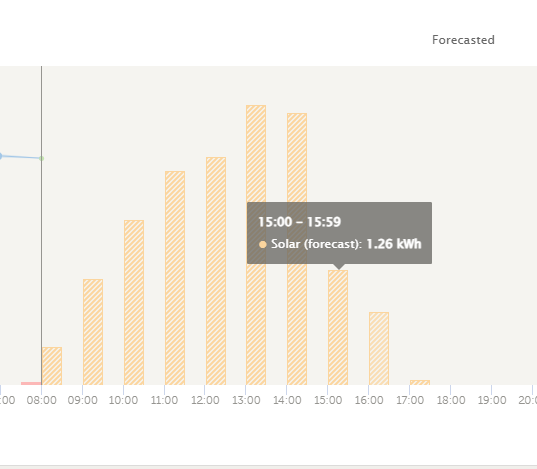
- Calculate the forecast based on forecasted solar irradiance
- Change layout of the installation data graphs to have more space for the forecast
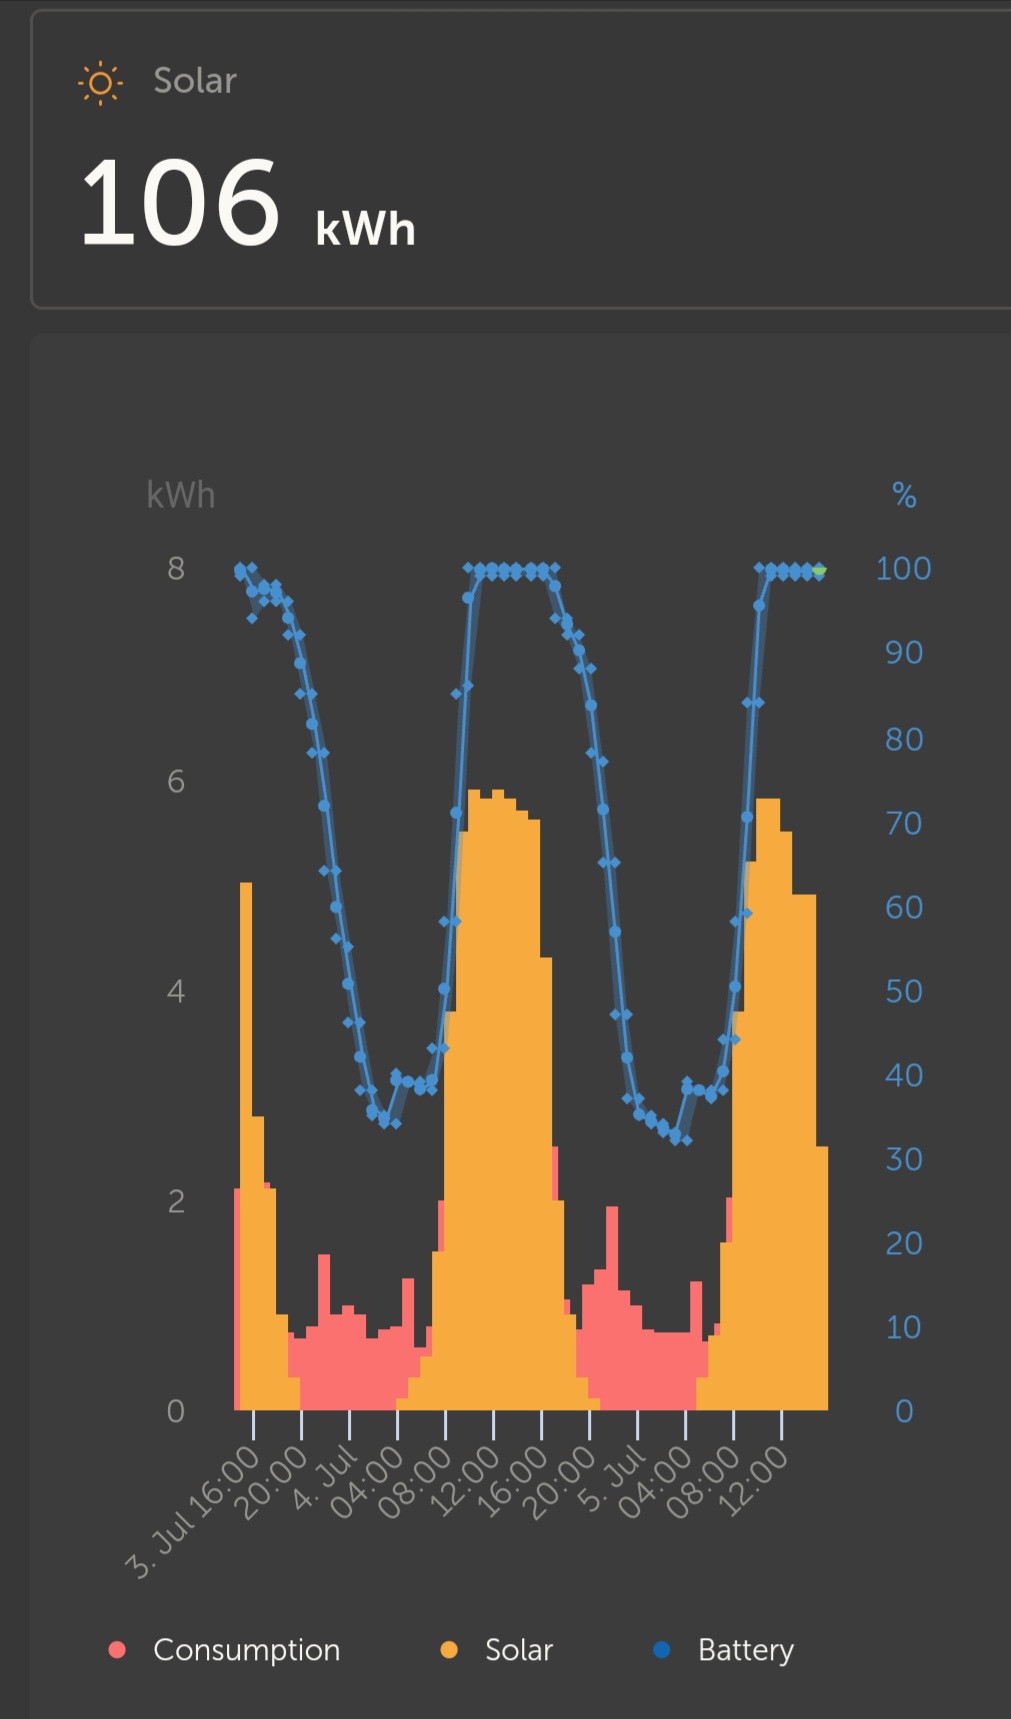
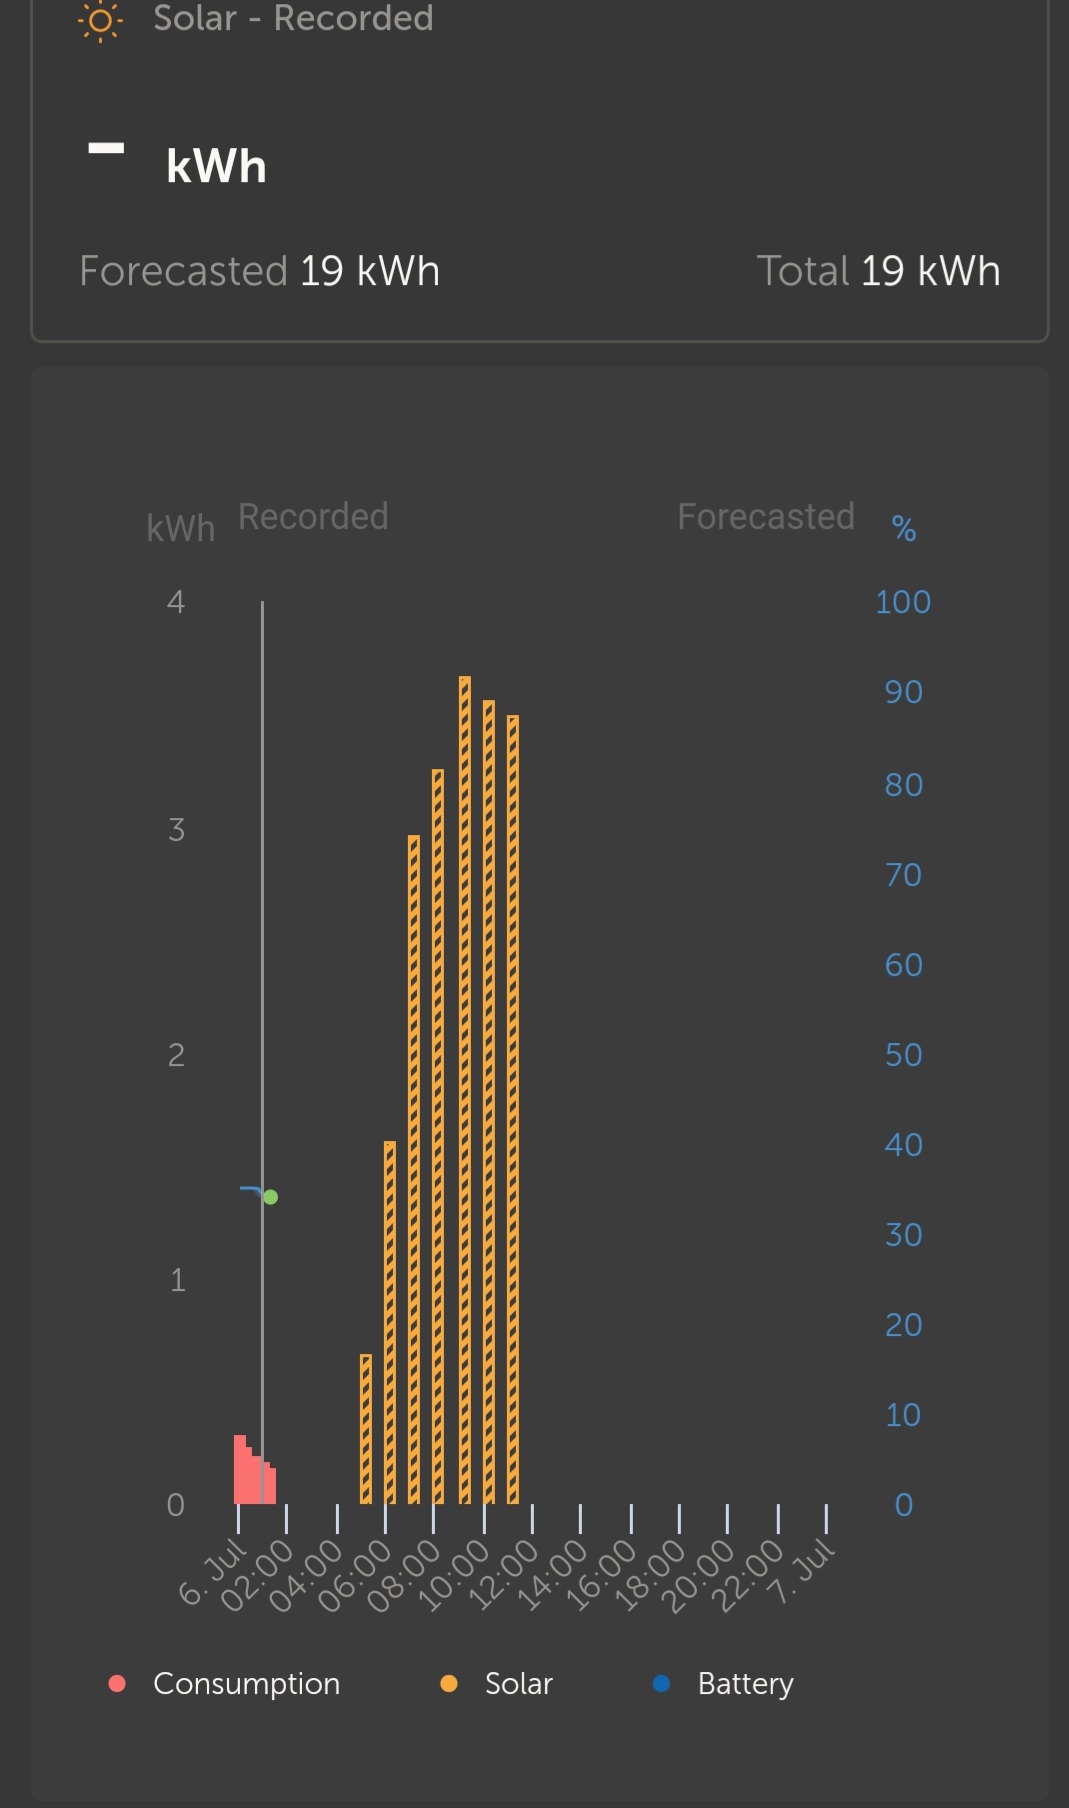
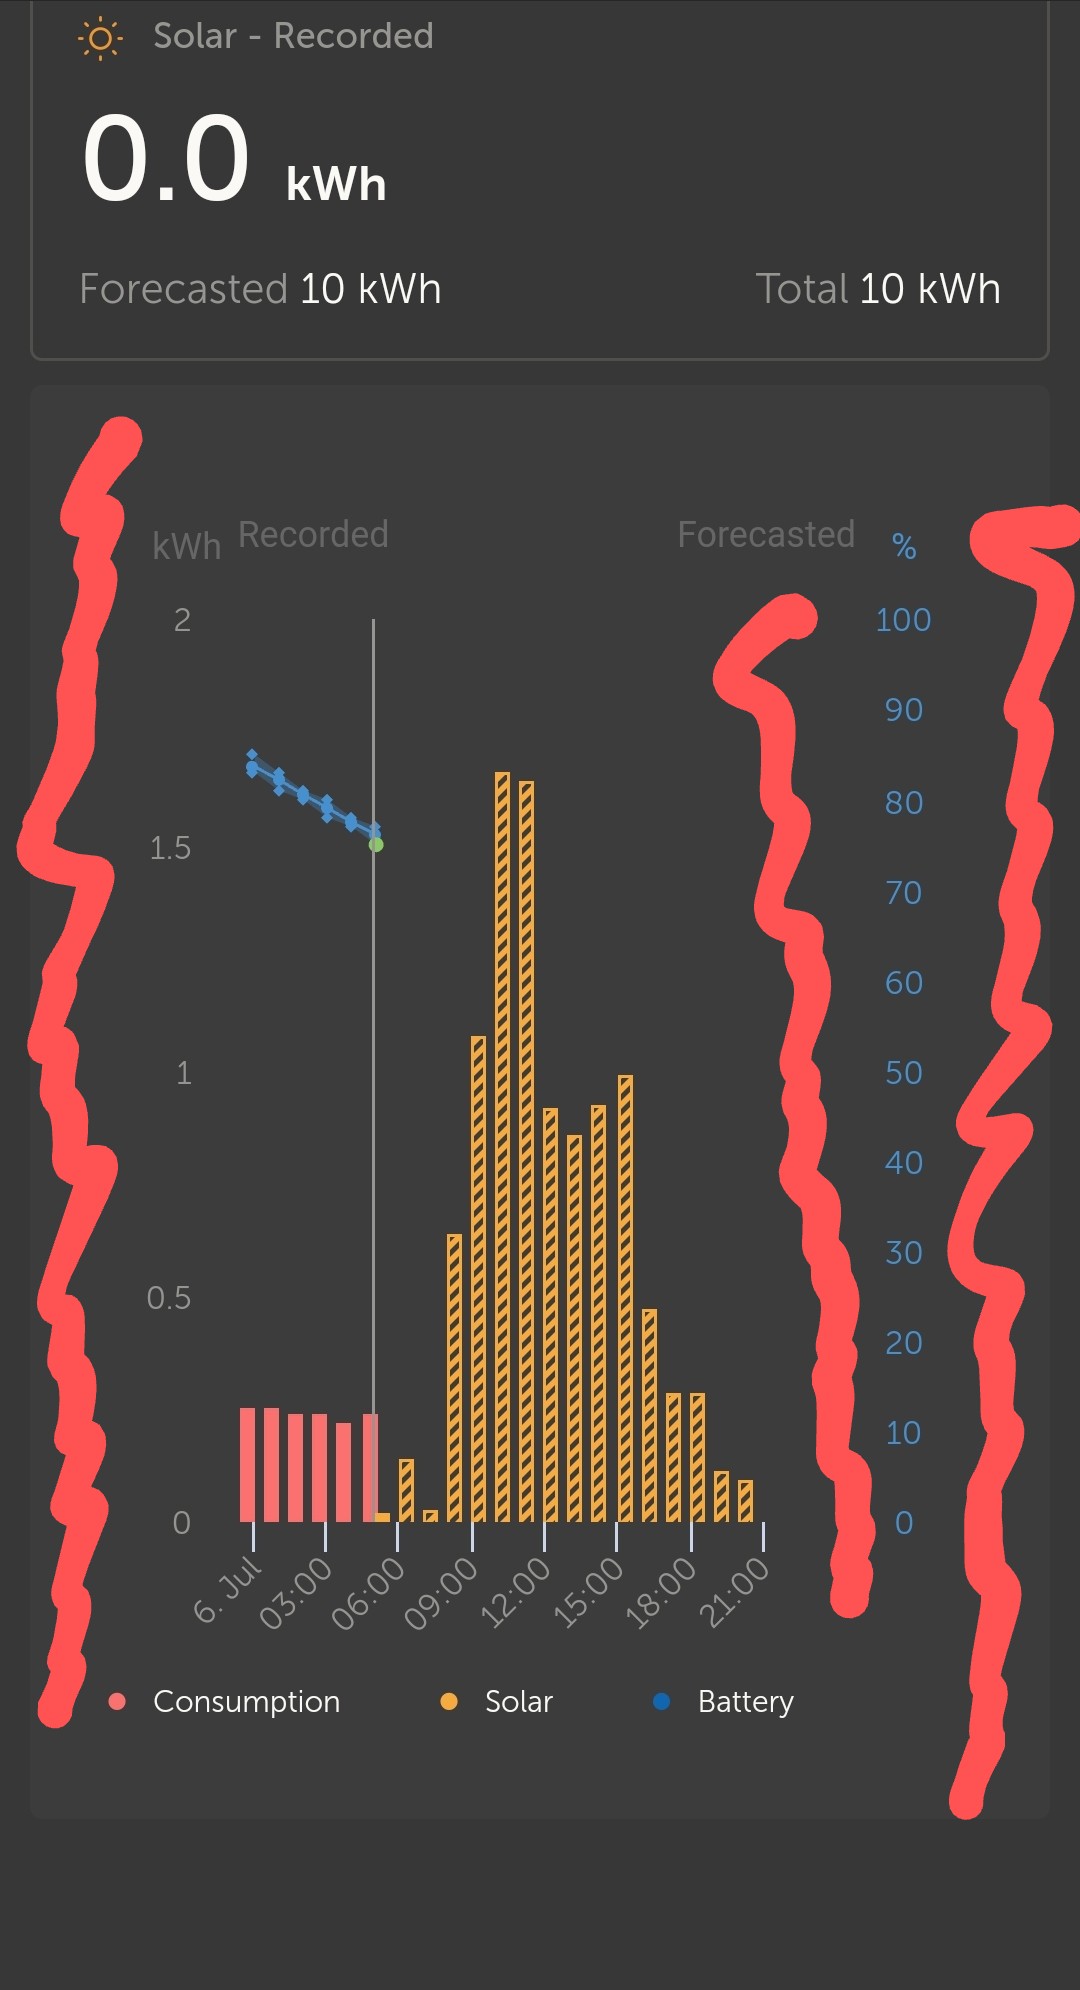
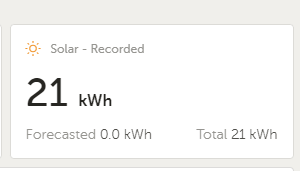
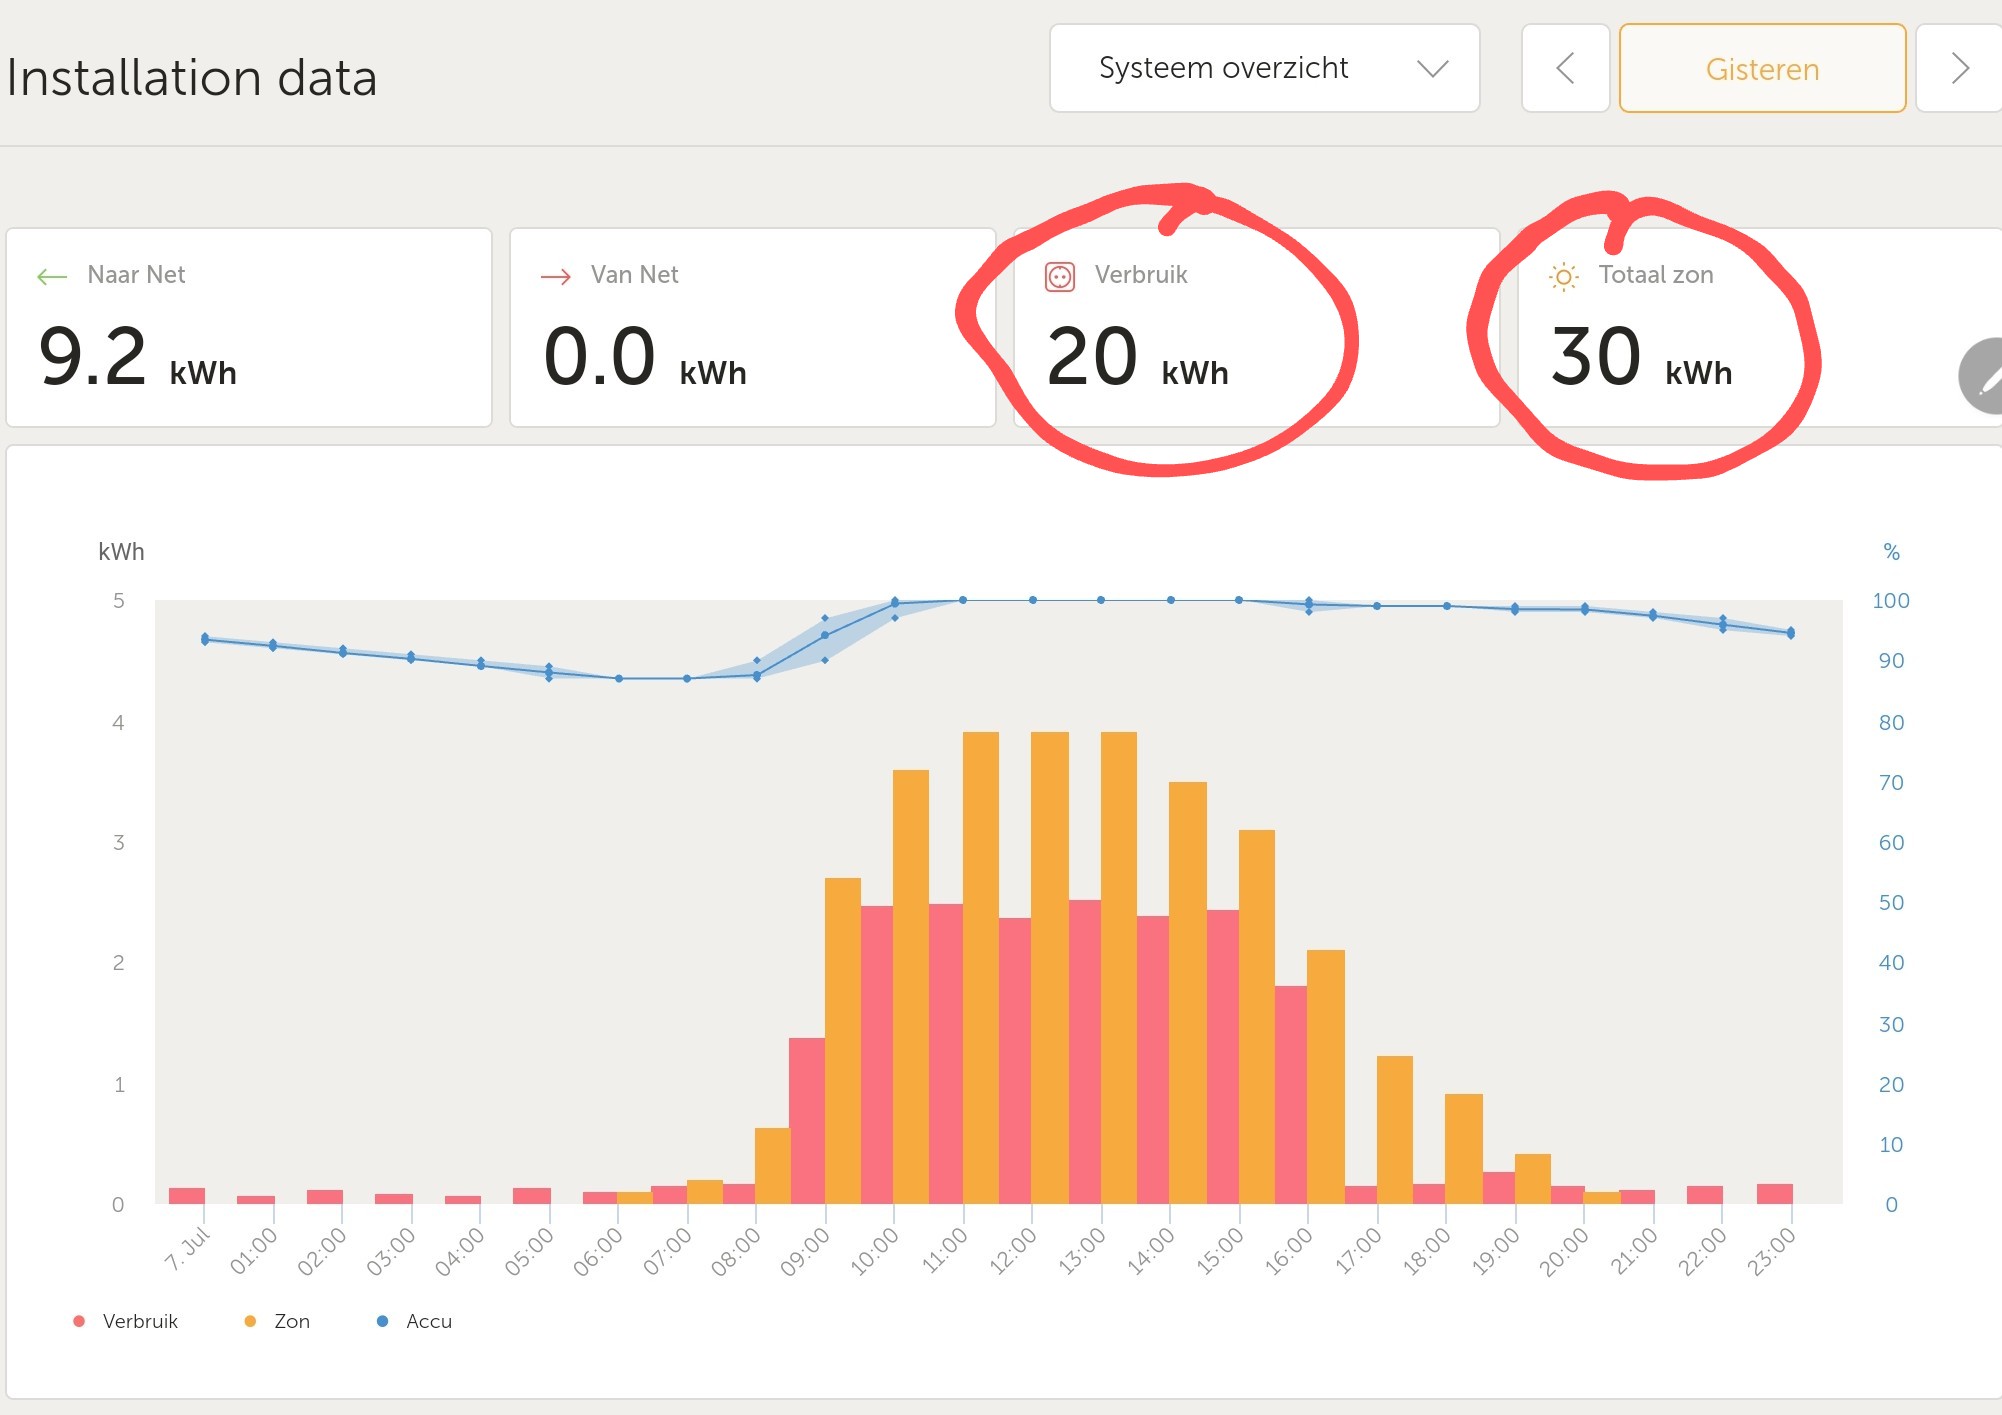
- Show the recorded, forecasted and expected total production for today
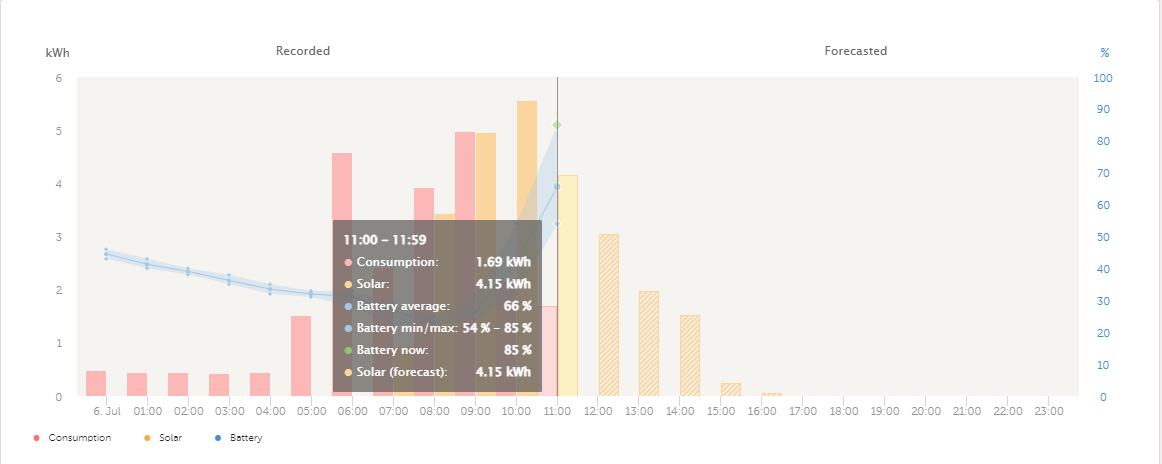
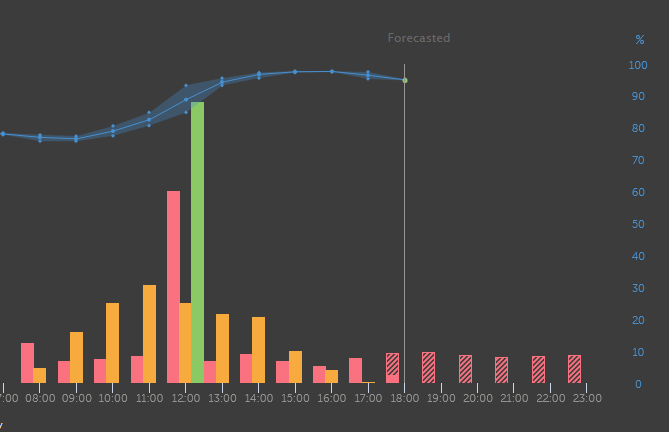
- Include the forecast per hour until 24:00 in the system overview graph
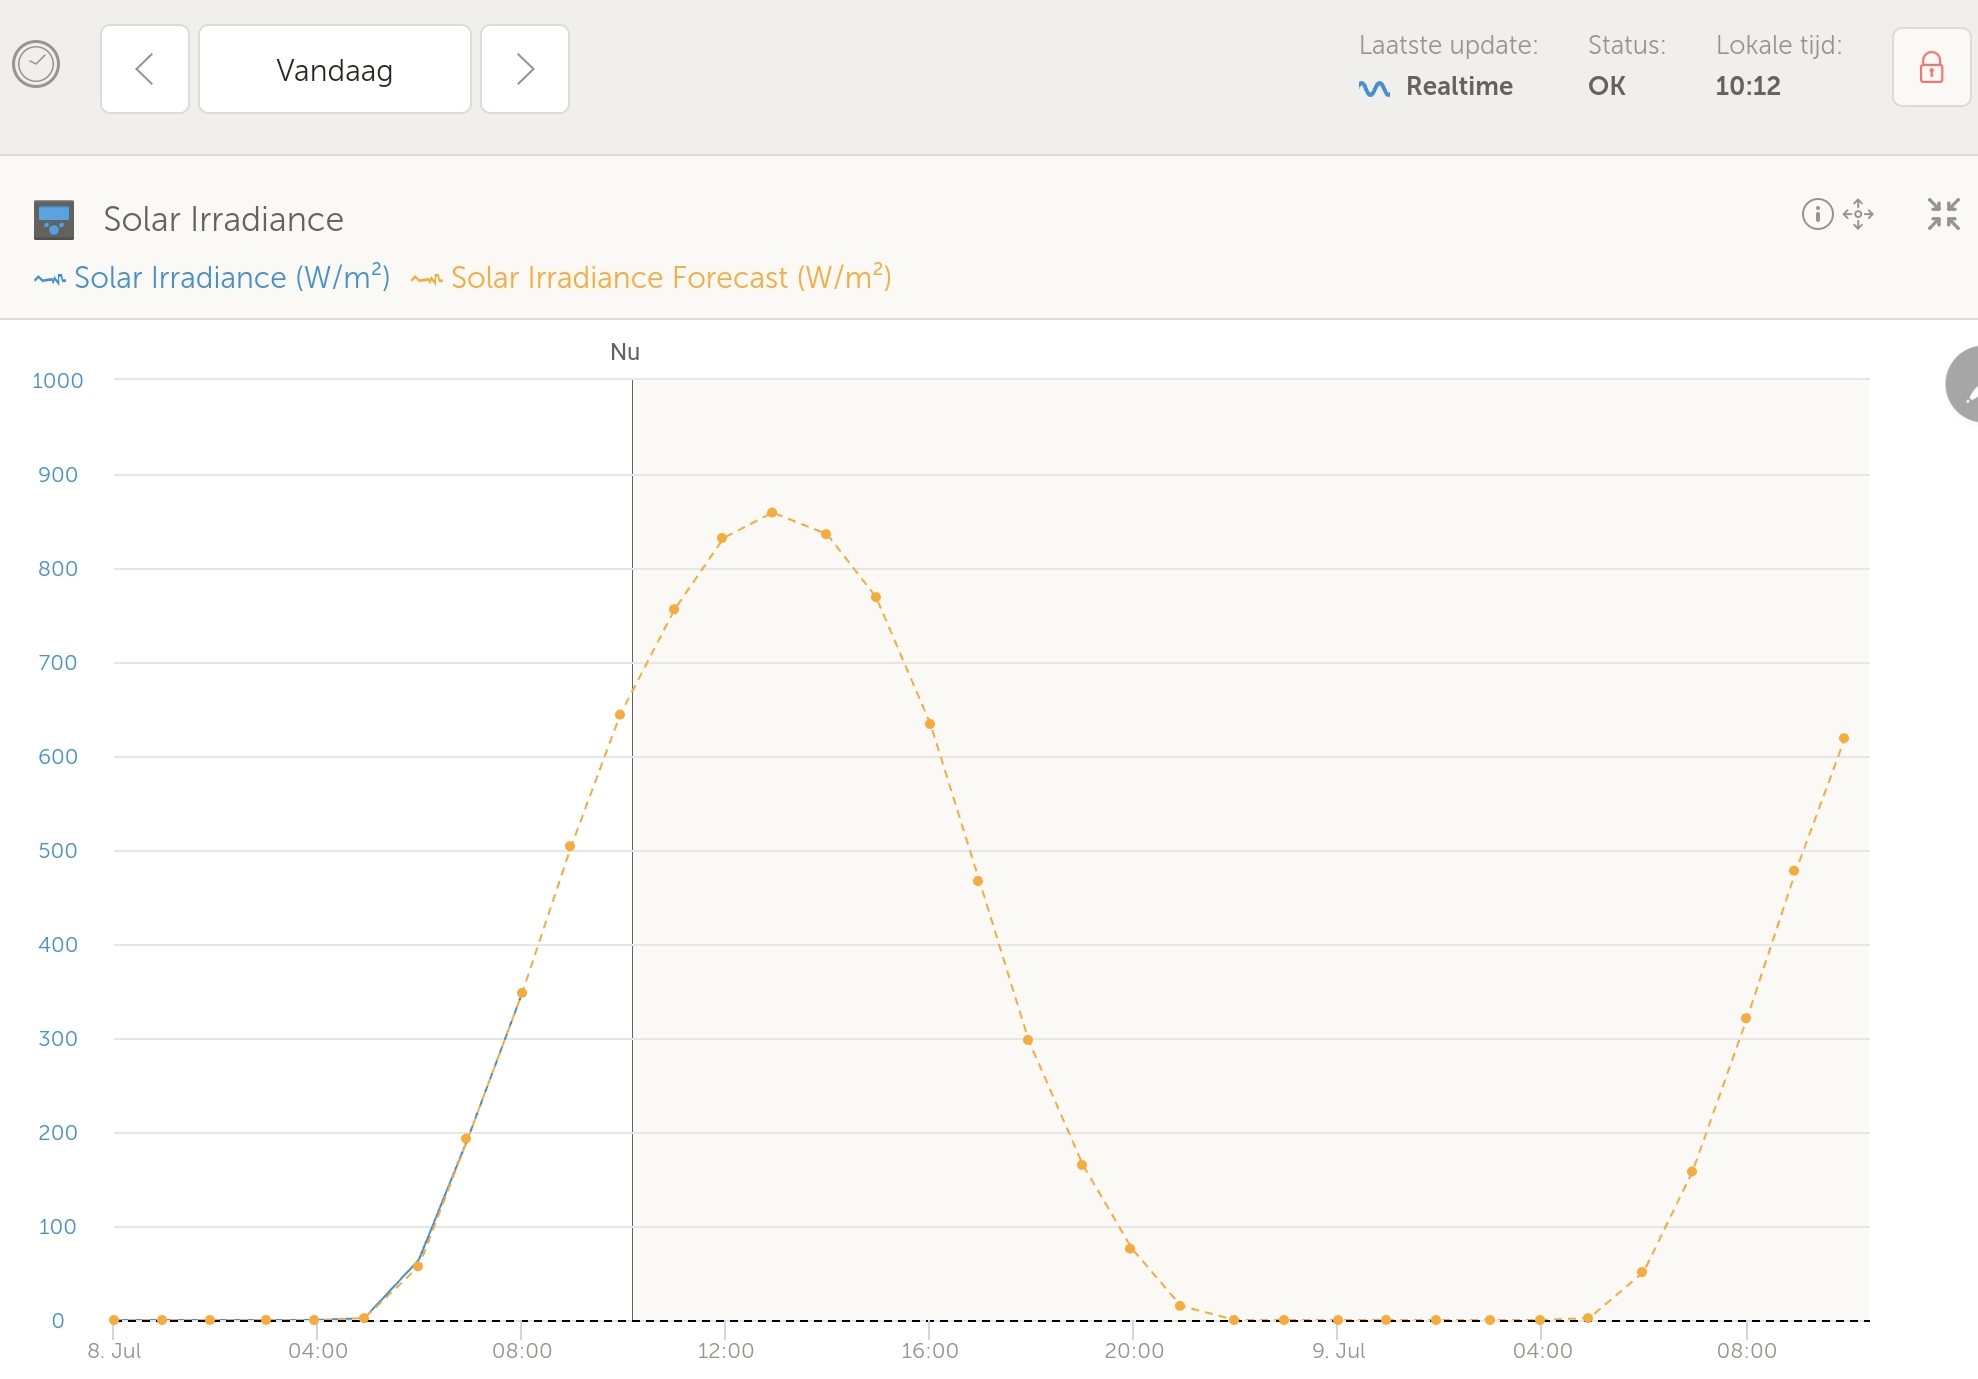
- Add a ‘solar irradiance’ widget on the advanced page
All the information you should need is here at the Victron Blog article about it.
We'd love to hear any feedback. Encouragement for the team, issues with the user interface, either suggestions for improvement or bugs. We are still improving the estimation algorithm, so are interested in reports of any unusual or impossible estimates.
We hope you enjoy this new feature :)
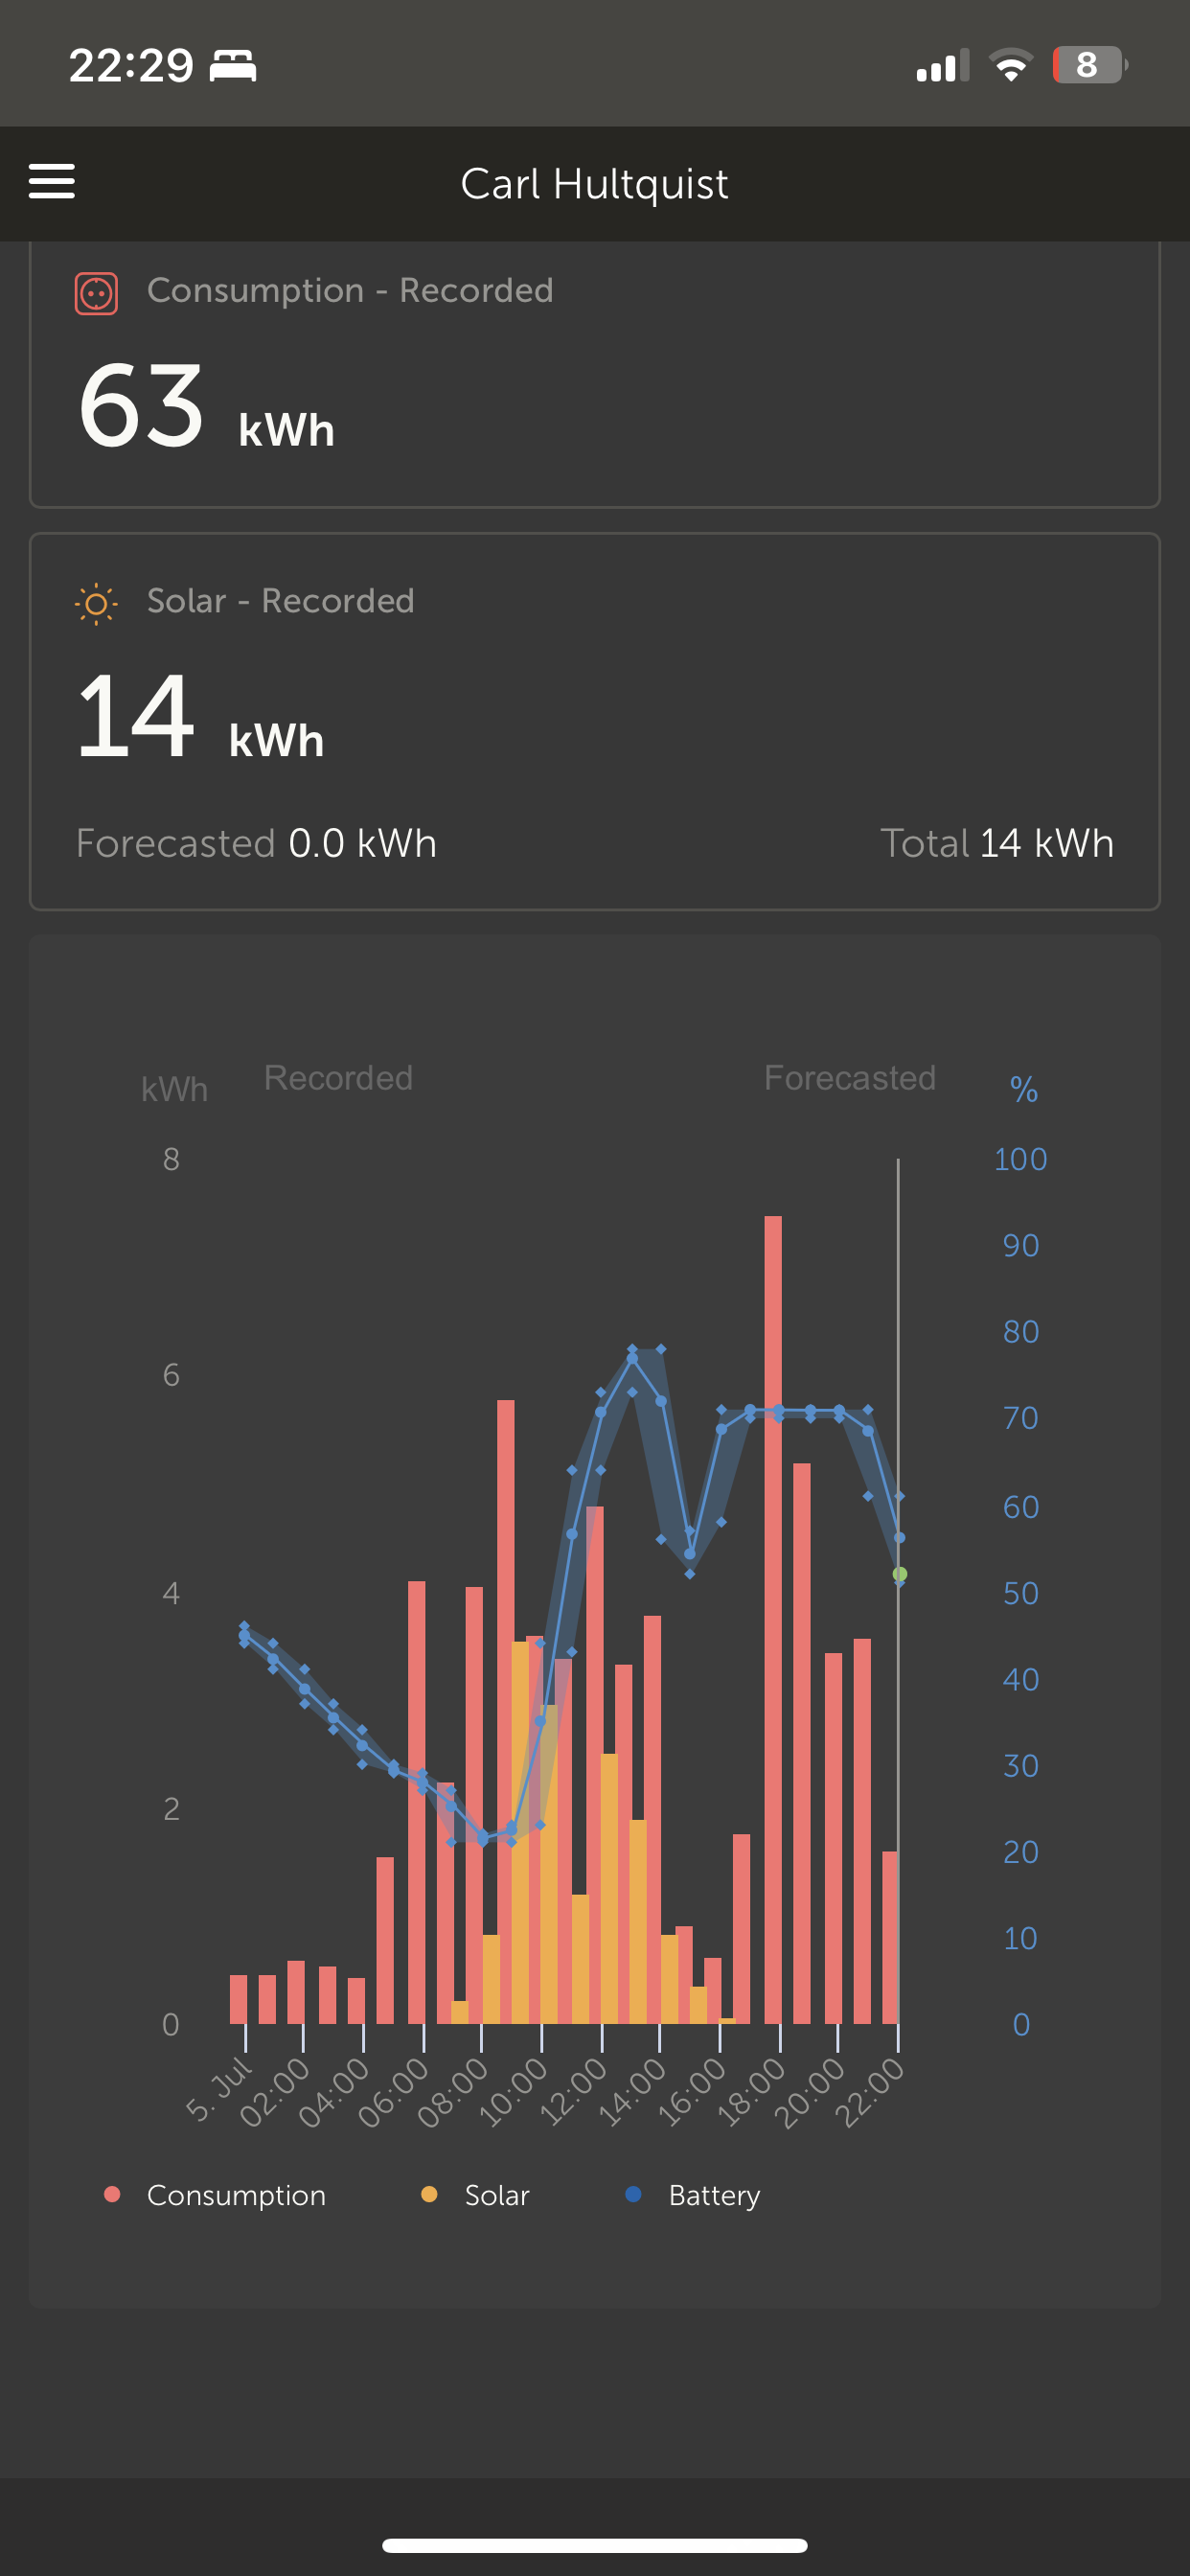

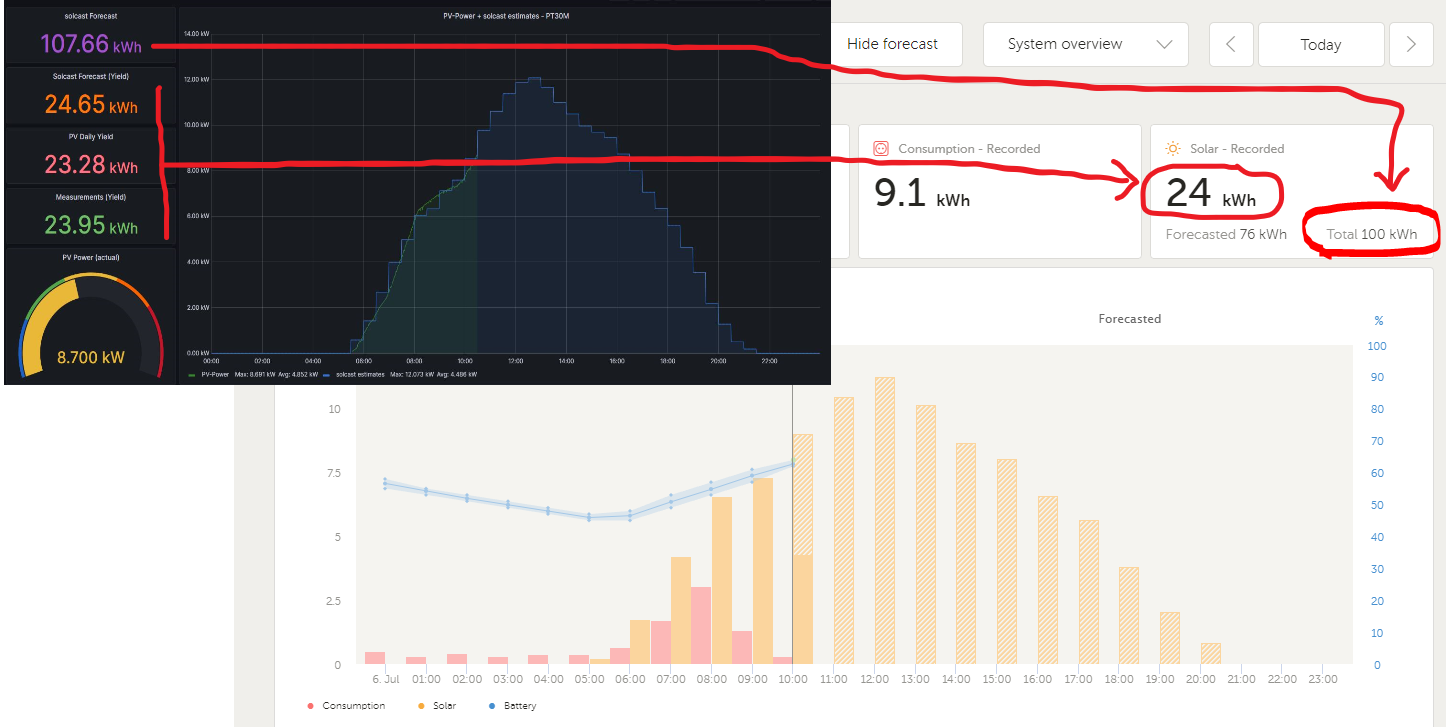
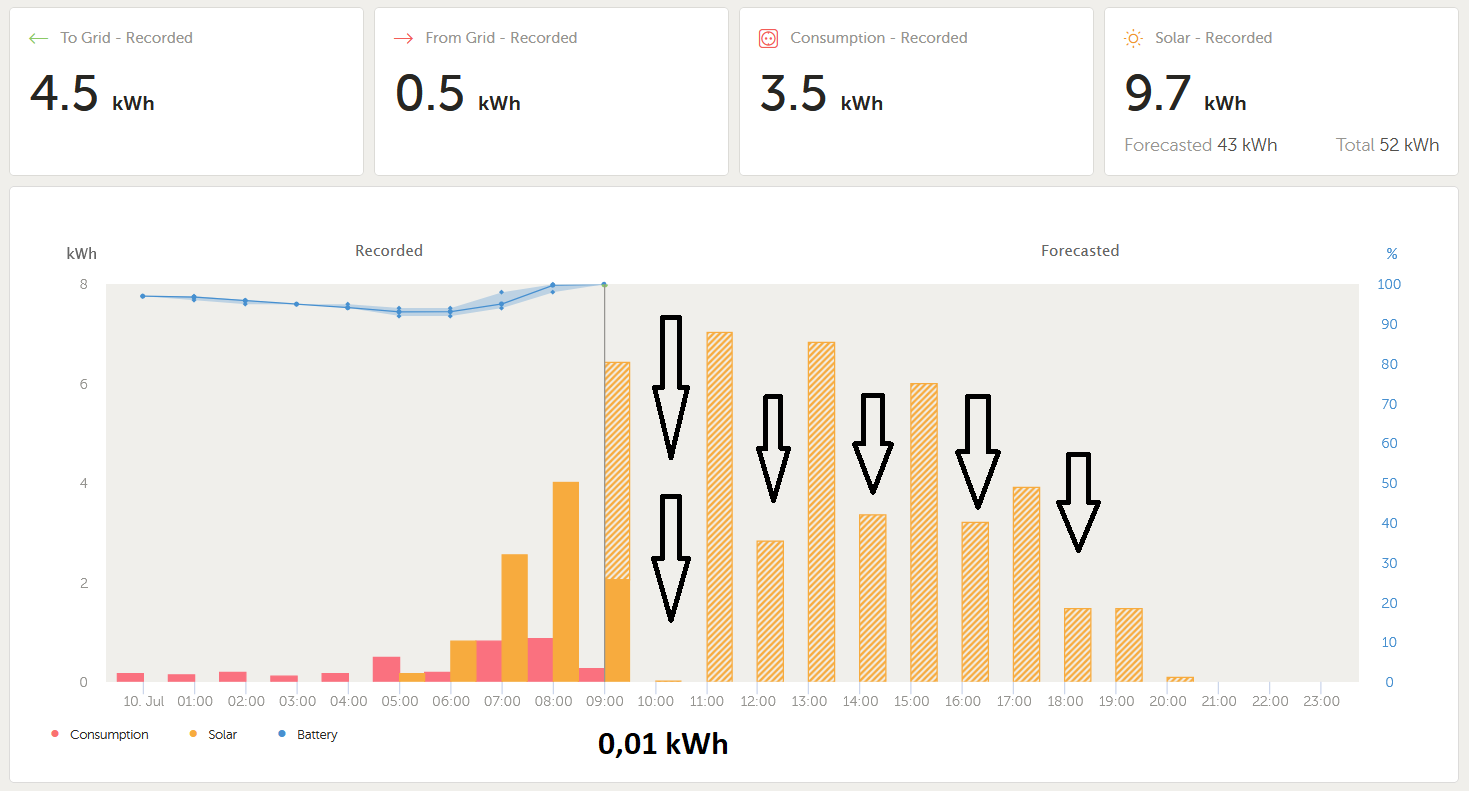
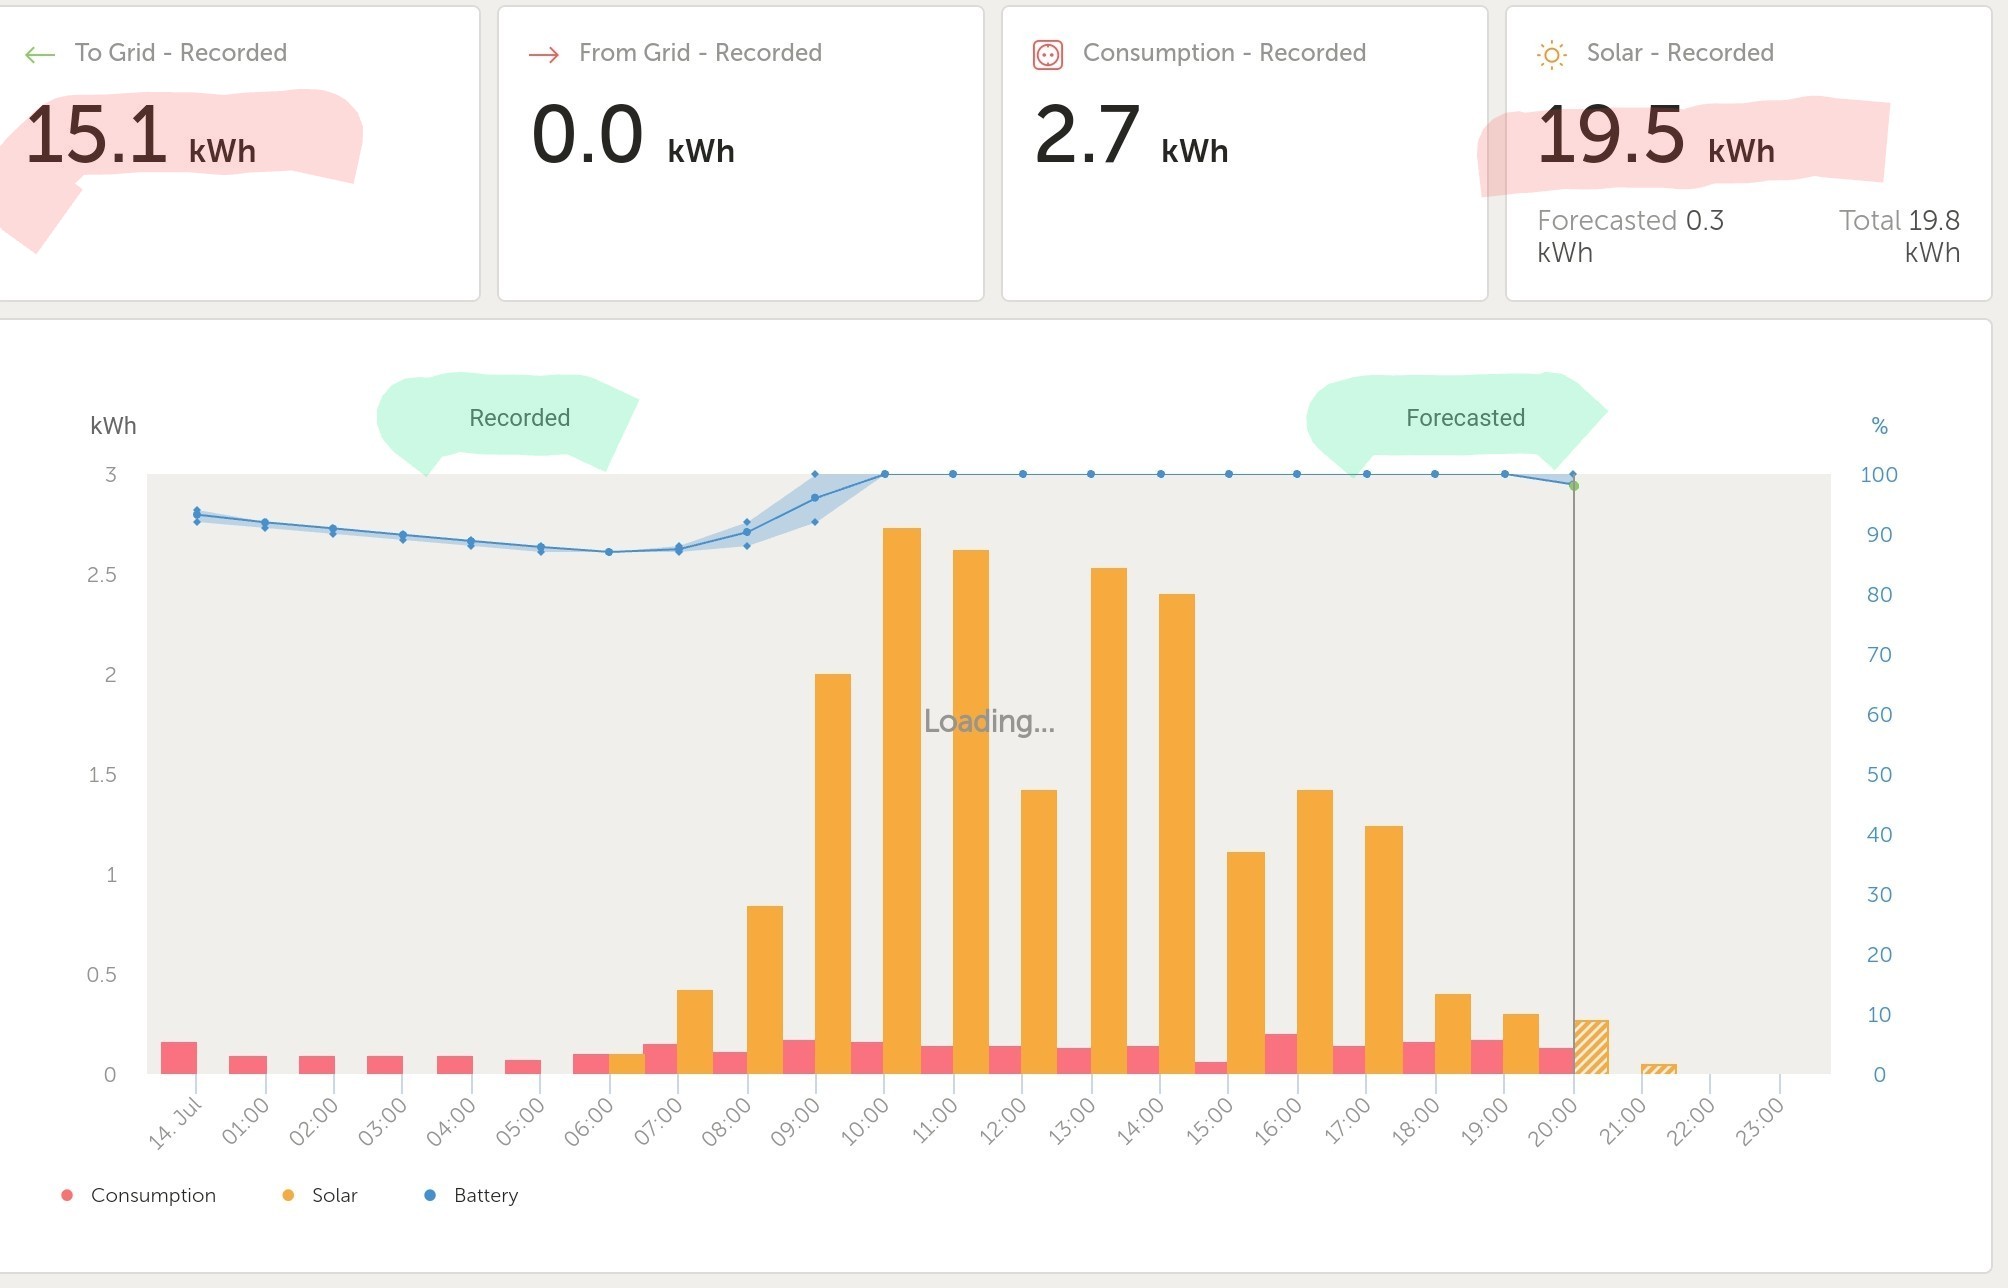
 since the update
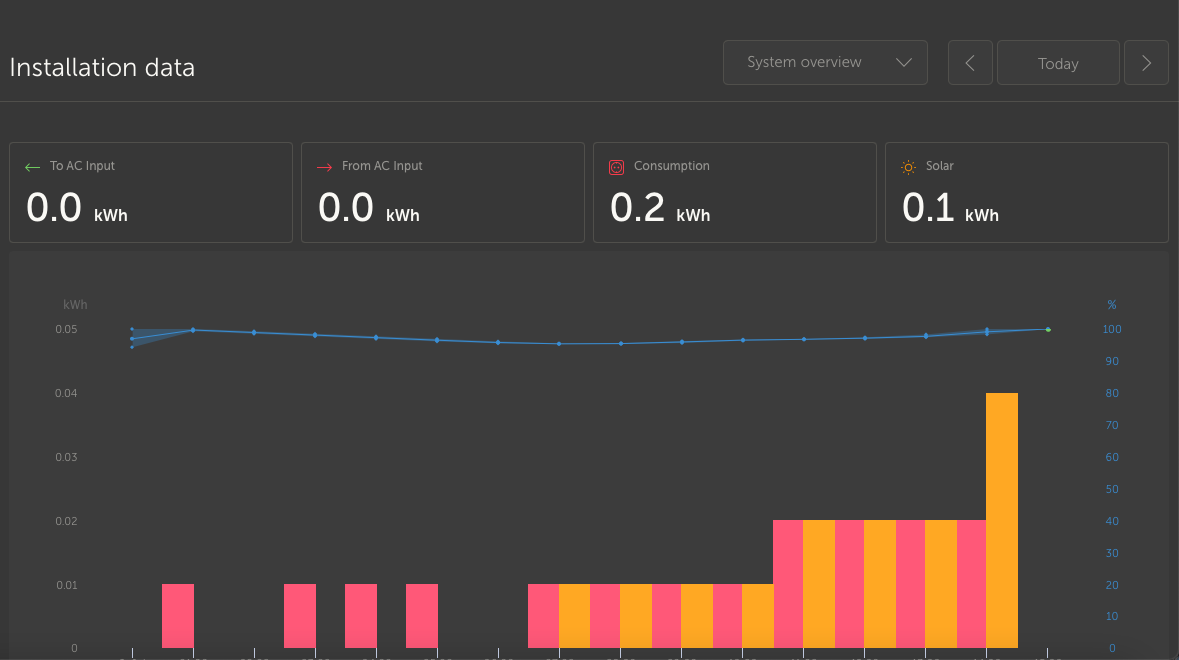
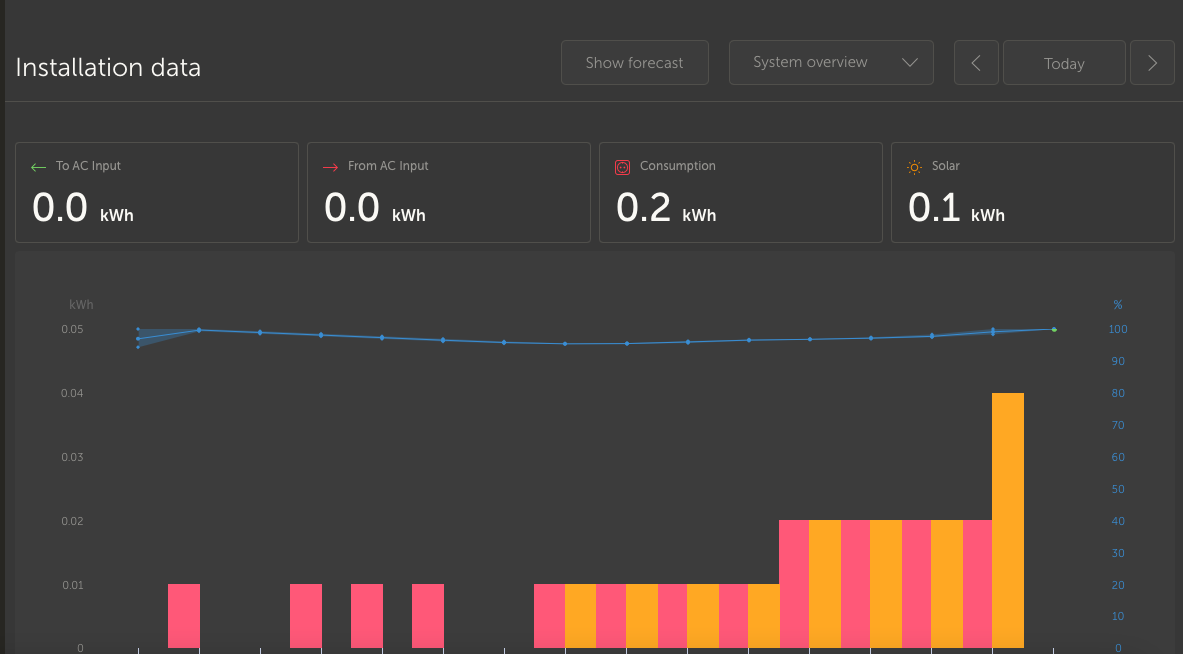