VeCAN.JPGConsole_02.JPGConsole_02.JPGVeCAN.JPGMy CarboGX is connected with SmartSolar over VeCAN. Cerbo gets CAN errors sporadically (about once a day). After that, the interface to the MPPT tracker is in CAN Active state (receives packets but does not send any). The MPTT Tracker then reacts with Error 67 (BMS Connection lost). After reboot everything works again. I replaced the cable and terminator. The error keeps coming. Can someone help with an idea? A solution is also welcome as I can reset the error without rebooting.
asked
CerboGX repeatly Ve.CAN error
Make sure both ends of the CANbus cable are terminated.
Try replacing the cable with a known good ethernet cable.
You may be able to reset the connection by disabling the CANbus port in Cerbo then reenabling it.
Make sure that all firmware is up to date on MPPTs and Inverter/Charger and GX device.
Hallo @Kevin Windrem,
Thank you for your reply!
The cable has already been replaced (2m). The final resistance was on the side of MPTT Tracker then on the side of Cerbo: Behavior is the same. The error comes very often in the morning when the tracker starts to supply electricity. This week:
- 2023-04-16 06:49
- 2023-04-17 06:32
- 2023-04-18 06:32
- 2023-04-19 06:18
In my view, this cannot be a coincidence. After that it works fine.
There must be a way to reset the error without rebooting Cerbo, but how?
Maybe restart a service in the Cerbo?
"The final resistance was on the side of MPTT Tracker then on the side of Cerbo" I may misunderstand, but there must be TWO terminators in place, one at either end, as Kevin mentioned. Maybe worth checking the terminator if you have the means or trying another set. What is the bus speed setting?
I can almost rule out a fault in the wiring because I replaced the cable.
In the last few days I have noticed a system in primeval times when the errors occur:
- 2023-04-16 06:49
- 2023-04-17 06:32
- 2023-04-18 06:32
- 2023-04-19 06:18
- 2023-04-20 06:16
This could be the time when the MPP tracker reaches the voltage threshold and starts producing electricity.
The remaining buses on the Cerbo (BMS.CAN, VeDirect, Ve.Bus) work without any problems.
Where are logs in Venus OS? There might be a hint there. Which service is responsible for VeCAN communication? In the event of an error, I could only restart this instead of rebooting the entire system or switching it off and on hard from the power supply.
It would be nice if it was possible to send questions to the software developer. If I can't find out from the system, I will connect a CAN logger and try to recognize something from the communication at the time of the error via reverse engineering.
I've been using the system for about 6 months. The problems only started 2 weeks ago. It is very strange that a storage device is full. Some VRM logger has filled the entire storage space (vrmlogger-backlog.sqlite3 1.105.637.376 Bytes). That could explain some side effects:
root@einstein:~# df
Filesystem 1K-blocks Used Available Use% Mounted on
/dev/root 963716 835760 59296 93% /
devtmpfs 465376 4 465372 0% /dev
tmpfs 515040 908 514132 0% /run
tmpfs 515040 564 514476 0% /var/volatile
/dev/mmcblk1p5 1134336 1117916 0 100% /data
tmpfs 515040 908 514132 0% /service
Does somebody has any idea?
If VRM logging is enabled but there is no network connection, the data is cached on the /data partition if no external SD or USB storage is detected. The GX manual indicates a log size of about 25 MB per month at a log interval of 1 minute. It could be larger if the system has lots of devices. At that rate it would take 3 years to fill up a 1 GB partition.
If you install an SD card or USB flash drive, the cache will switch to the removable media and not fill up /data.
You can also disable VRM logging if you aren't using it. Then you can delete the sqlite file.
I don't know what VRM and what VRM logging is, but if it causes problems I will turn it off. Only now I have to find out how...
My system has been in operation for about half a year and as you can see the entire space (over 1GB) is occupied by this log
There is a connection to the VRM-Online portal because I can see the data there.
VRM, VRM logging and VRM-Online portal are all related.
If you are seeing data for your system on VRM-Online portal then there should be no backup data being written to the sqlite file.
Enabling/disabling logging is the first selection under / Settings / VRM online portal. There is other information there like "Last contact" and Storage location and Free space and Stored records. If you have a good connection to the portable, Stored records should be zero.
If Stored records is zero, I would disable VRM logging, delete the sqlite file and reenable VRM logging.
If Stored records is not zero, you can still do the above but you would loose all records that have not been sent to the VRM online portal.
Eureka, my problem is solved (I hope)! Thanks to @Kevin Windrem 's tip, I put an SD card in Cerbo and deleted the DB file from the data folder. The "pseudo" CAN error has not come up for two days.
It may be correct that theoretically no data is written to the local DB when connected to the online portal, but reality shows otherwise. Theoretically, 3 years should be necessary for this DB size, but the system was installed for me about 6 months ago and the DB is larger than 1GB.
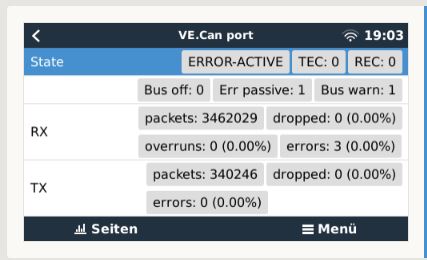
Today the error came back at the expected time (2023-04-21 06:18). I have not found any problems in the CAN driver in the system with the following command. And the driver is set to reset CAN-ACTIVE errors after 100 ms. My guess is that a high level software component still has a bug. Any component stops after the first error state even if the driver resets the state again. Theoretically, ERROR-ACTIVE is also not a real but only a temporary error state. In this state, the Rx counter continues to count, but the Tx counter stops
-----------------------------------------------------------------------
root@einstein:~# ip -details -statistics link show can0
4: can0: <NOARP,UP,LOWER_UP,ECHO> mtu 16 qdisc pfifo_fast state UP mode DEFAULT group default qlen 100
link/can promiscuity 0 minmtu 0 maxmtu 0
can state ERROR-ACTIVE (berr-counter tx 0 rx 0) restart-ms 100
bitrate 250000 sample-point 0.875
tq 250 prop-seg 6 phase-seg1 7 phase-seg2 2 sjw 1
sun4i_can: tseg1 1..16 tseg2 1..8 sjw 1..4 brp 1..64 brp-inc 1
clock 24000000
re-started bus-errors arbit-lost error-warn error-pass bus-off
0 0 0 0 0 0 numtxqueues 1 numrxqueues 1 gso_max_size 65536 gso_max_segs 65535
RX: bytes packets errors dropped overrun mcast
1405139 175643 0 0 0 0
TX: bytes packets errors dropped carrier collsns
252711 31592 0 0 0 0
-----------------------------------------------------------------------
root@einstein:/sys/class/net/can0/statistics# grep '.*' /sys/class/net/can1/statistics/*
/sys/class/net/can1/statistics/collisions:0
/sys/class/net/can1/statistics/multicast:0
/sys/class/net/can1/statistics/rx_bytes:2625242
/sys/class/net/can1/statistics/rx_compressed:0
/sys/class/net/can1/statistics/rx_crc_errors:0
/sys/class/net/can1/statistics/rx_dropped:0
/sys/class/net/can1/statistics/rx_errors:0
/sys/class/net/can1/statistics/rx_fifo_errors:0
/sys/class/net/can1/statistics/rx_frame_errors:0
/sys/class/net/can1/statistics/rx_length_errors:0
/sys/class/net/can1/statistics/rx_missed_errors:0
/sys/class/net/can1/statistics/rx_nohandler:0
/sys/class/net/can1/statistics/rx_over_errors:0
/sys/class/net/can1/statistics/rx_packets:386878
/sys/class/net/can1/statistics/tx_aborted_errors:0
/sys/class/net/can1/statistics/tx_bytes:884208
/sys/class/net/can1/statistics/tx_carrier_errors:0
/sys/class/net/can1/statistics/tx_compressed:0
/sys/class/net/can1/statistics/tx_dropped:0
/sys/class/net/can1/statistics/tx_errors:0
/sys/class/net/can1/statistics/tx_fifo_errors:0
/sys/class/net/can1/statistics/tx_heartbeat_errors:0
/sys/class/net/can1/statistics/tx_packets:110526
/sys/class/net/can1/statistics/tx_window_errors:0