question

srit avatar image
srit asked

VRM graph shows different results for the same period of time depending on the range and zoom

Hello,


I just noticed that the VRM graph shows different results for the same period of time depending on the range not being zoomed, vs then changing the zoom, and then different again when zooming a little bit more.


Three different sets of values, at least for the peaks that I was looking at.


I'll attach three different screen shots, using the exact same 12 hour range.


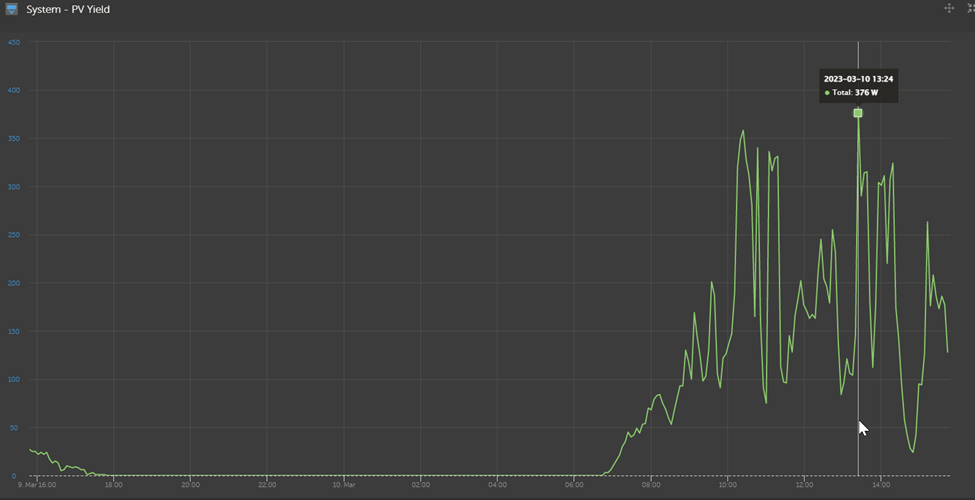
  • First screen is with no zoom. The highest peak is depicted as 376 W at 13:24.

1678494363787.png


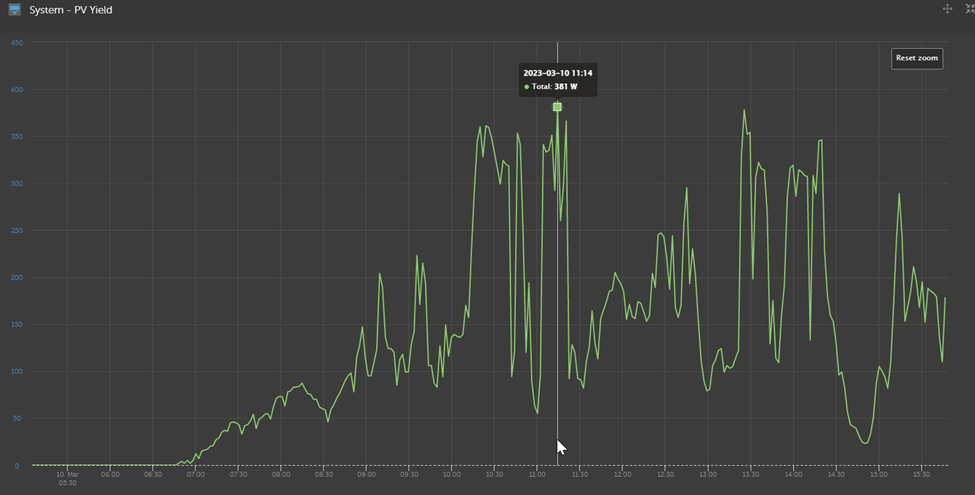
  • Second screen is with zooming starting at 5 AM to present time. The highest peak is depicted as 381 W at 11:14.

1678494383402.png


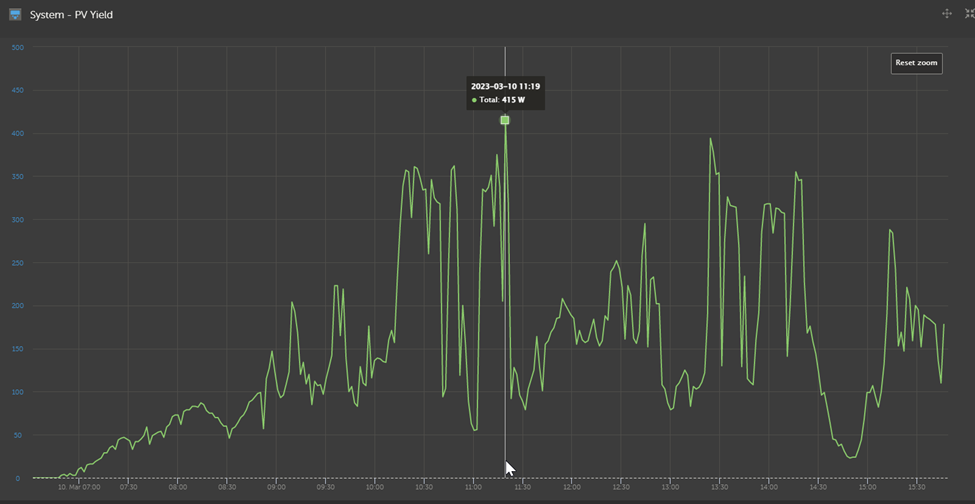
  • Third screen is adjusting the zoom a bit more granular starting at 6:30 AM to present time. The highest peak is depicted as 415 W at 11:19.

1678494414014.png


Has anyone seen this sort of behavior?

Is this a bug? Or something I have set incorrectly or doing something wrong on my side?


Thanks!

VRM
1678494363787.png (86.1 KiB)
1678494383402.png (111.1 KiB)
1678494414014.png (115.5 KiB)
2 |3000

Up to 8 attachments (including images) can be used with a maximum of 190.8 MiB each and 286.6 MiB total.

1 Answer
kevgermany avatar image
kevgermany answered ·

It's normal. Very abbreviated explanation follows.

To generate a graph the software has to balance the amount of data with the number of pixels available on the screen to display it. Usual method is to average the data for each point displayed. Averaging reduces peaks and troughs.

There's a option in each advanced graph to turn the averaging off (cogwheel/show range values), but it gives very thick lines on smaller screens.

2 comments
2 |3000

Up to 8 attachments (including images) can be used with a maximum of 190.8 MiB each and 286.6 MiB total.

srit avatar image srit commented ·

Hmm, interesting. Thanks for your explanation and feedback.


I was expecting, well hoping to be able to see what the peak PV was for any particular range of dates or times.

How would I be able to do that reliably?

0 Likes 0 ·
ralf-ct avatar image ralf-ct srit commented ·
I have the same problem: if I, for example, boil a 2,400W kettle now, set the range for 1hour, it shows up as a 2,350W peak. If I change the range to a week, that same 'kettle' peak may only be 800W. That defeats the object, especially if one wants to check on which day and when one used the maximum over a given period.
0 Likes 0 ·