question

kaypea avatar image
kaypea asked

Shaded area of graph and two plot points - why?

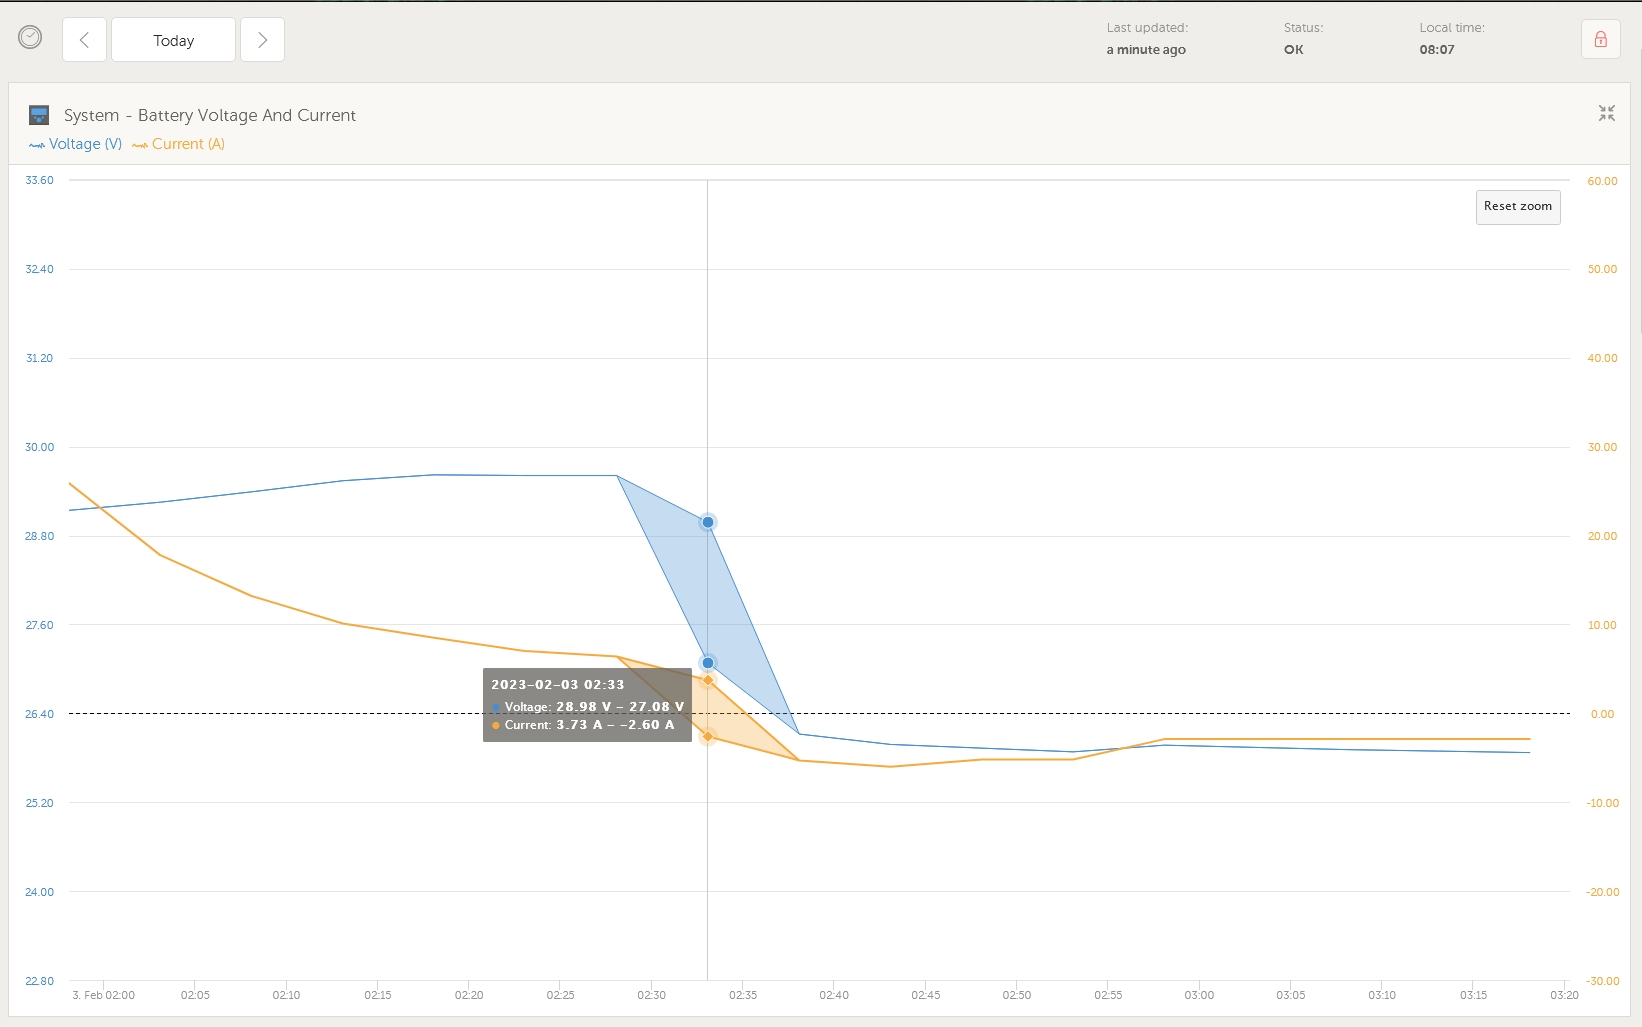
Something I've not seen until this morning on a VRM graph. i always understood the plotting to either be an average or snap-shot at the plotting time... however I noticed that there are two plots (for the same time) on one of the graphs this morning (see below).

Why are there two plots with a shaded area?

shaded-graph.jpg

VRM
shaded-graph.jpg (204.9 KiB)
2 |3000

Up to 8 attachments (including images) can be used with a maximum of 190.8 MiB each and 286.6 MiB total.

1 Answer
Alexandra avatar image
Alexandra answered ·

@kaypea

It is a hysteresis in the readings. So maybe under a bigger load, the voltage dropped and recovered in that time.

1 comment
2 |3000

Up to 8 attachments (including images) can be used with a maximum of 190.8 MiB each and 286.6 MiB total.

kaypea avatar image kaypea commented ·
Thanks for your answer - I just thought it should have been a single point on the graph, but that makes sense.
0 Likes 0 ·