question

kaarthik avatar image
kaarthik asked

VRM portal PI CHART VALUE

Dear all,

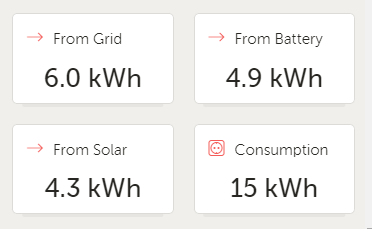
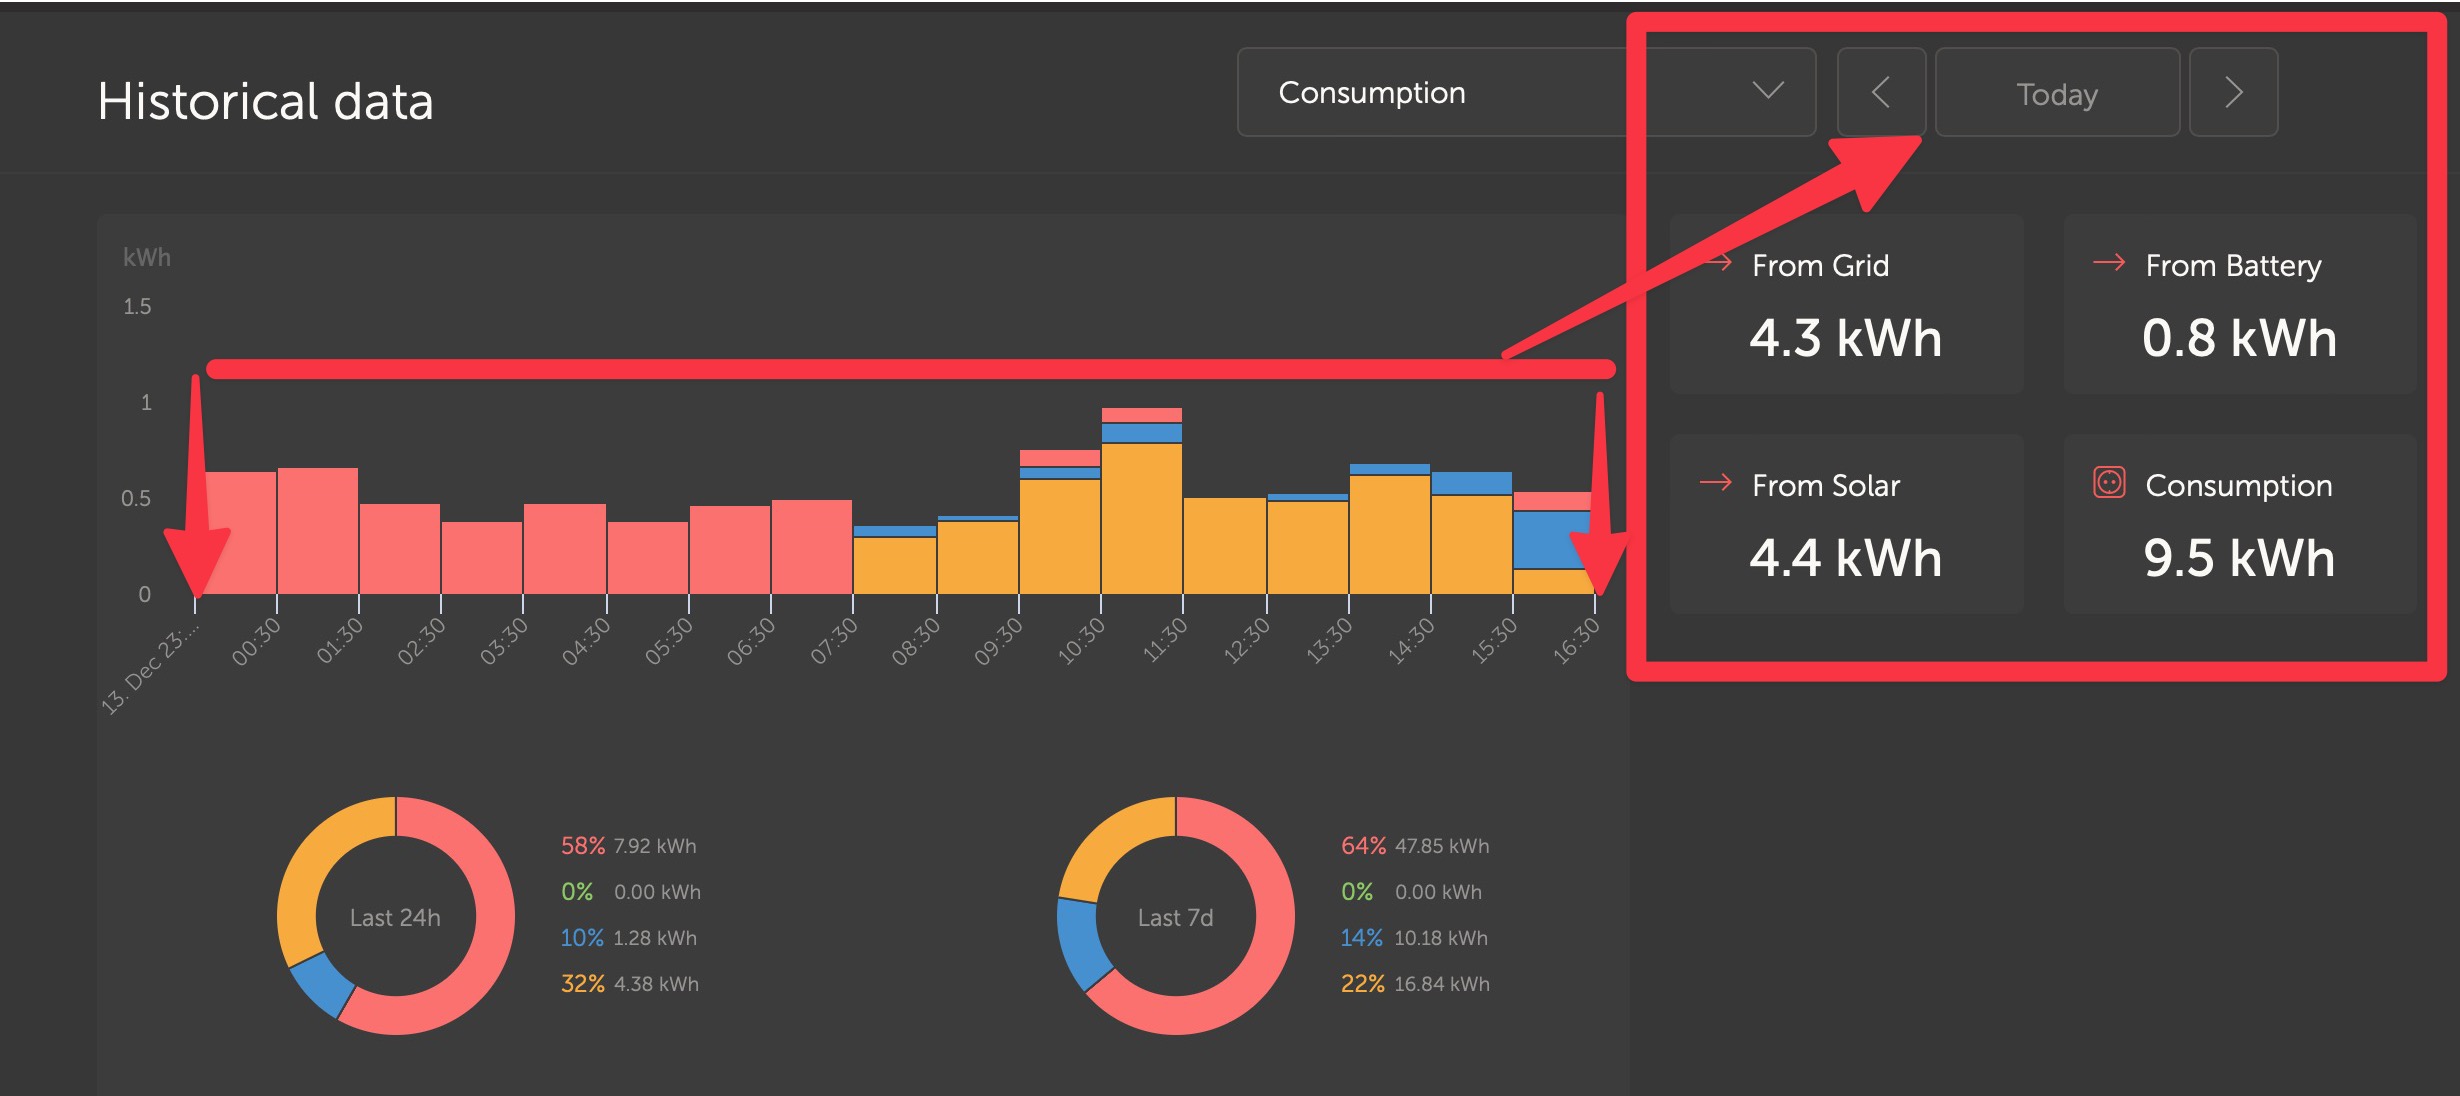
when i check with VRM portal last 24hours data , the value shows there is not match with pi chart value, check with below attached picture from grid it shows 6kWh in value but in chart it shows 5.99kWh , from battery value 4.9kWh but in chart it is 4.65kWh, then from solar value 4.3kWh but in chart it is 4.08kWh.Can you please help me to understand what is the value difference.

1671012060165.png1671012074610.png

VRM
1671012060165.png (9.2 KiB)
1671012074610.png (13.7 KiB)
2 |3000

Up to 8 attachments (including images) can be used with a maximum of 190.8 MiB each and 286.6 MiB total.

1 Answer
Guy Stewart (Victron Community Manager) avatar image
Guy Stewart (Victron Community Manager) answered ·

Hi @kaarthik,

This is something that will be improved in the future, so I won't go into too much detail but basically....

The 4 boxes on the right hand side relate to the time period set by the box above them. In this example "Today" starts at the recent midnight and runs till the present moment (local time to the system).

The donut below runs the full previous 24 hours, not just from midnight.


cleanshot-2022-12-14-at-222806.jpg


1 comment
2 |3000

Up to 8 attachments (including images) can be used with a maximum of 190.8 MiB each and 286.6 MiB total.

kaarthik avatar image kaarthik commented ·

Dear Guy Stewart,

Thanks for the clarification

0 Likes 0 ·