question

anieuwstadt avatar image
anieuwstadt asked

VRM Custom charts, number of values plotted

Hello,

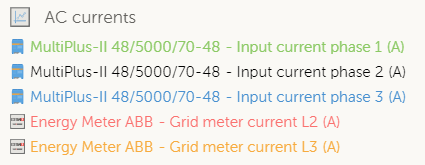
Please consider the merits of being able to display 6 values at a time on the custom widget charts. With 3-phase systems, it is common to want to plot 2 values of all phases at the same time. Example: L1, L2 and L3 Currents on the energy meter and the ACin of the inverter cluster. This would be 6 values.


1668491452520.png

feature requestvrm advanced
1668491452520.png (17.5 KiB)
1 comment
2 |3000

Up to 8 attachments (including images) can be used with a maximum of 190.8 MiB each and 286.6 MiB total.

Good suggestion, I will pass it on
0 Likes 0 ·
0 Answers

Related Resources

Additional resources still need to be added for this topic

The feature requests topic tag can help Victron R&D find feature suggestions for products. 

There are many factors that go into the Victron product roadmap, and feedback from end-users can help.