question

allure1932 avatar image
allure1932 asked

Strange DC readings on VRM

099e82c4-e985-4cb5-8427-eddaa6f57df6.pngHi,

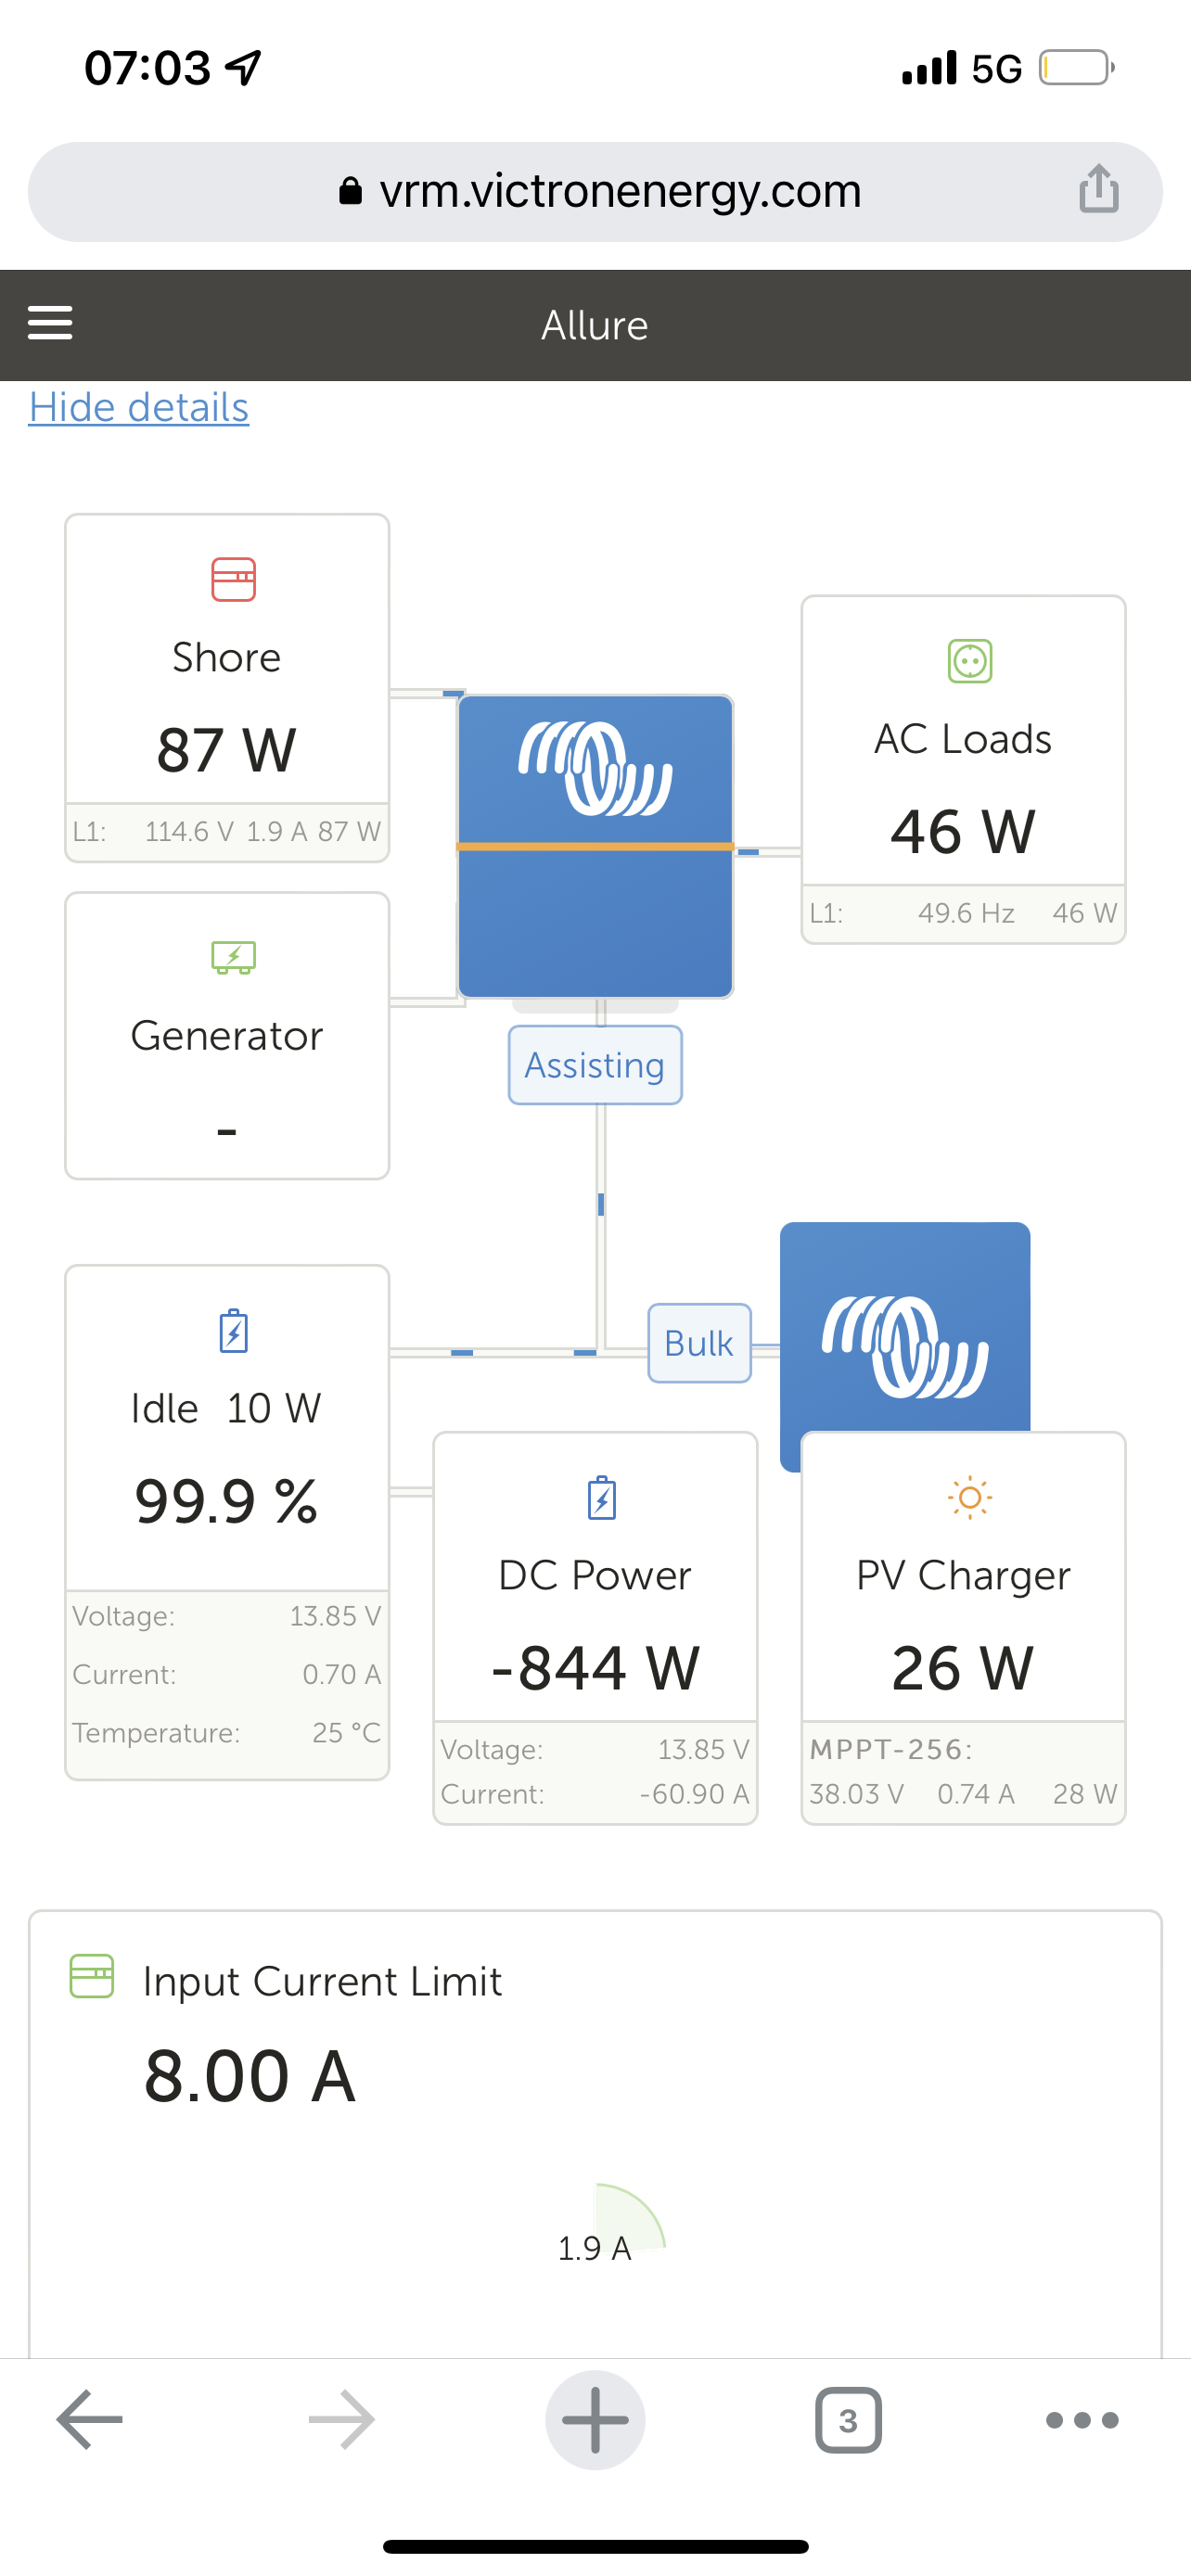
I just noticed strange DC readings on VRM. Please see photo.

I have nothing that can generate that load on the DC and the 60A breaker would trigger.

When I look at the CCGX the system is not showing these values. It looks normal.

Has anyone seen this before? Is some component in my system acting up? I hope not since CCGX looks normal. Can communication with VRM be bad? I am hoping that there is checksums on the data that is sent to VRM so broken data is discarded before being shown?


Any advice greatly appreciated!


Per


VRM
2 |3000

Up to 8 attachments (including images) can be used with a maximum of 190.8 MiB each and 286.6 MiB total.

7 Answers
alan avatar image
alan answered ·

Unless you have a shunt measuring the dc loads, then it's a calculated value and can be off.

2 |3000

Up to 8 attachments (including images) can be used with a maximum of 190.8 MiB each and 286.6 MiB total.

allure1932 avatar image
allure1932 answered ·

31423765-381d-4954-909a-096faf913679.pngI have no shunt on the DC loads, only on the entire battery bank.

Looking at the time plot of DC and AC loads, the big DC loads mostly line up with AC activity, supporting a calculation/sample error.


1 comment
2 |3000

Up to 8 attachments (including images) can be used with a maximum of 190.8 MiB each and 286.6 MiB total.

alan avatar image alan commented ·
It's possible to add a smartshunt to measure dc loads if your require.
0 Likes 0 ·
kevgermany avatar image
kevgermany answered ·

What AC loads do you have?

Just wondering if the values on the dashboard are all instantaneous or affected by collection delays.

The continuous chart does show good correlation between AC peaks and DC loads.

2 |3000

Up to 8 attachments (including images) can be used with a maximum of 190.8 MiB each and 286.6 MiB total.

Trevor Bird avatar image
Trevor Bird answered ·

I notice the inverter is in power assist mode. I think we are seeing some timing sampling anomalies giving those results because the input current doesn’t suggest the need for power assist.

2 |3000

Up to 8 attachments (including images) can be used with a maximum of 190.8 MiB each and 286.6 MiB total.

allure1932 avatar image
allure1932 answered ·

Right now we are at a dock where I have limited the AC current to 8A (@110V) and on top of that the power comes and goes. Even for medium loads the inverter is either assisting or providing it all.

So yes, it is possible that this comes from instantaneous samples that are not perfectly correlated and/or not smoothed, so when VRM puts together the DC load from calculations, you get spikes that are not real.

Is there a setting that improves on this?

2 |3000

Up to 8 attachments (including images) can be used with a maximum of 190.8 MiB each and 286.6 MiB total.

Trevor Bird avatar image
Trevor Bird answered ·

Yes, on the CerboGX under the VRM portal heading is a variable called “log interval”. I think in the default condition it is 15 minutes but that can be reduced at the expense of data use.

2 |3000

Up to 8 attachments (including images) can be used with a maximum of 190.8 MiB each and 286.6 MiB total.

allure1932 avatar image
allure1932 answered ·

I think a shorter log interval will make a strange reading go away quicker, as in what is displayed on vrm, but i think the fundamental challenge here is how to sample all system data at the “same” time so it is consistent.

2 |3000

Up to 8 attachments (including images) can be used with a maximum of 190.8 MiB each and 286.6 MiB total.