Hi all
My setup:
- Cerbo GX & Touch GX
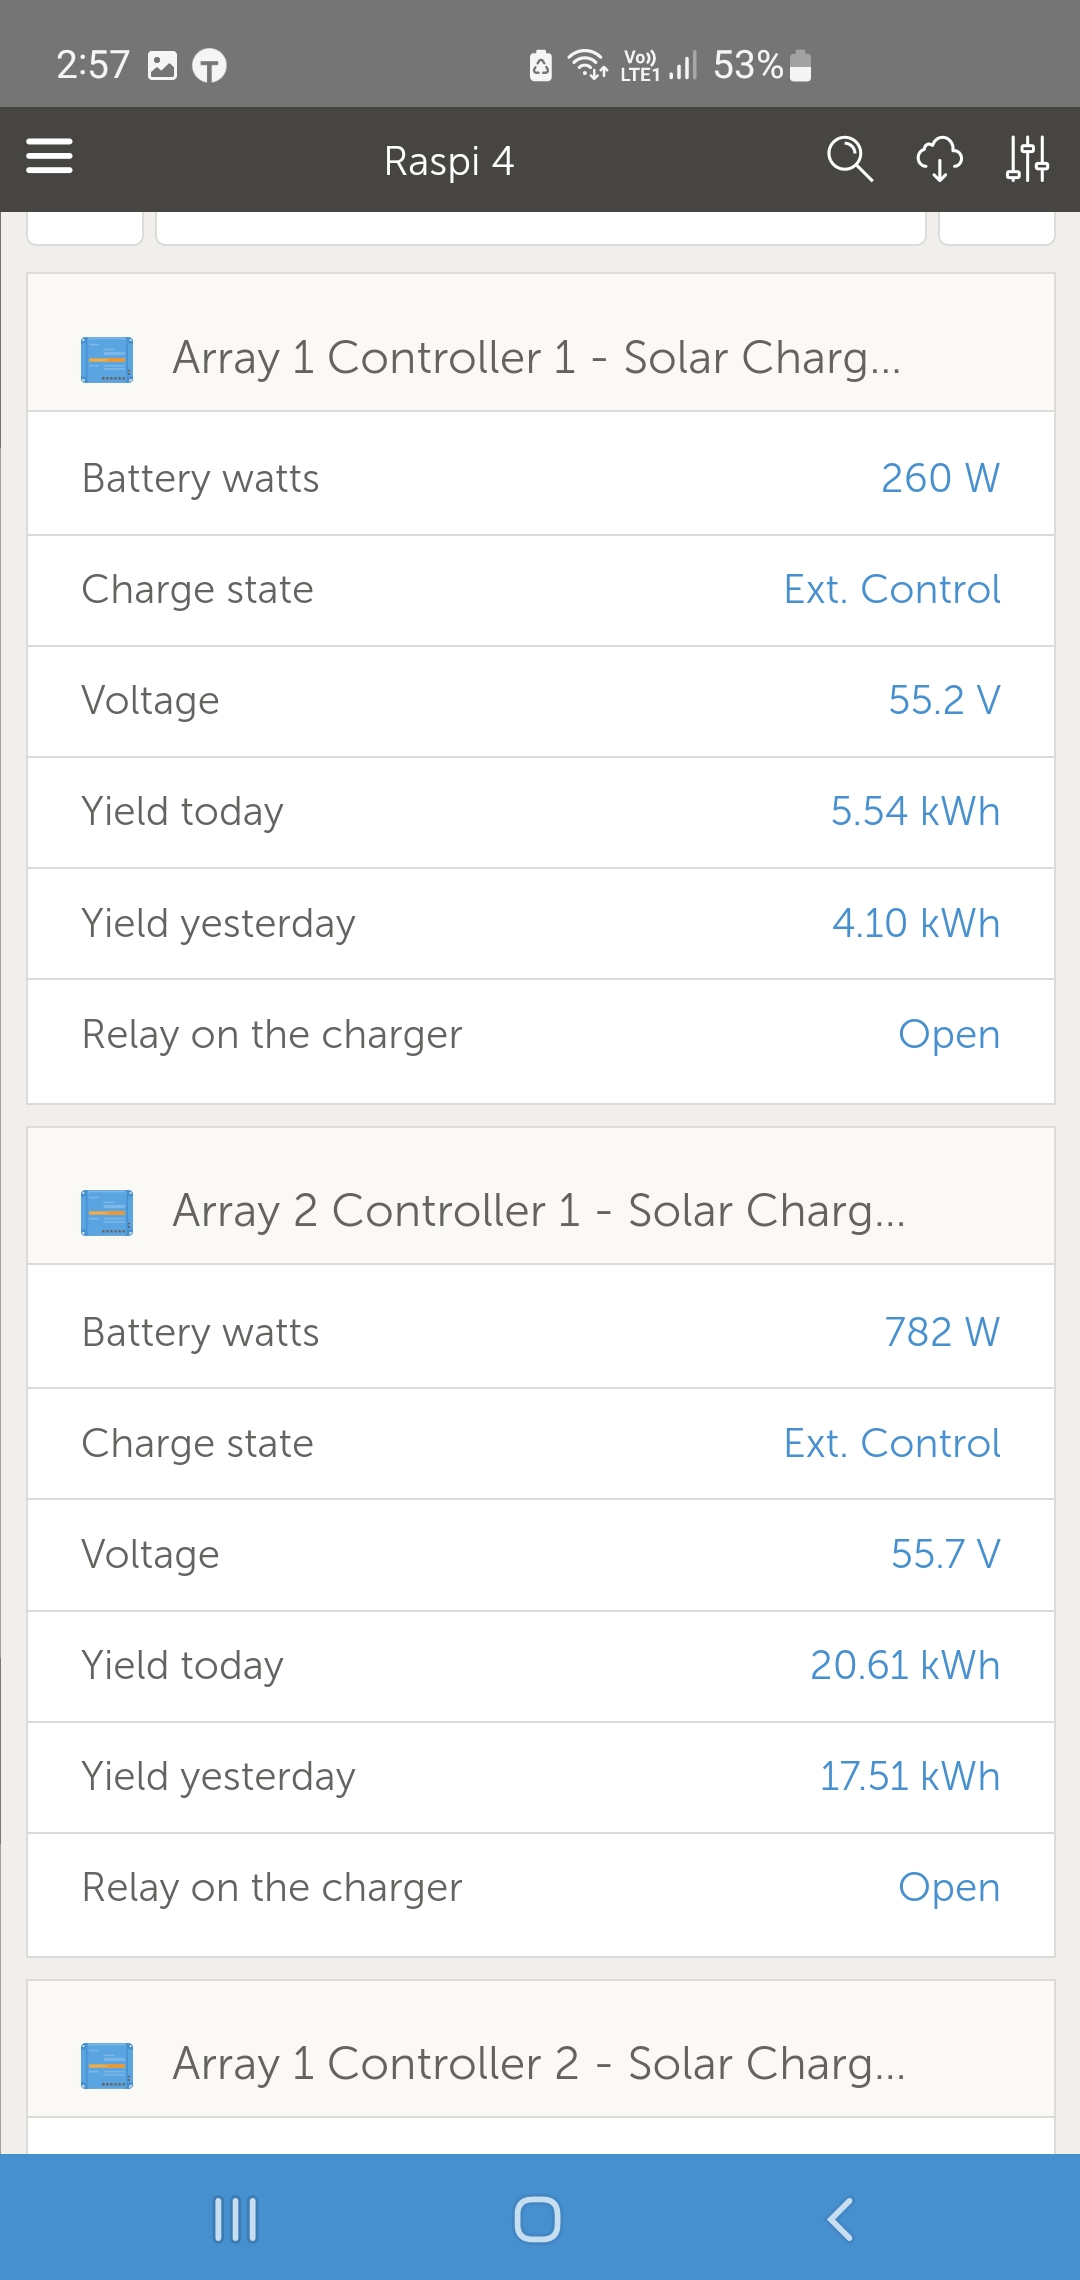
- Smartsolar MPPT
- Multiplus 12/3000
looking at the VRM historical data:
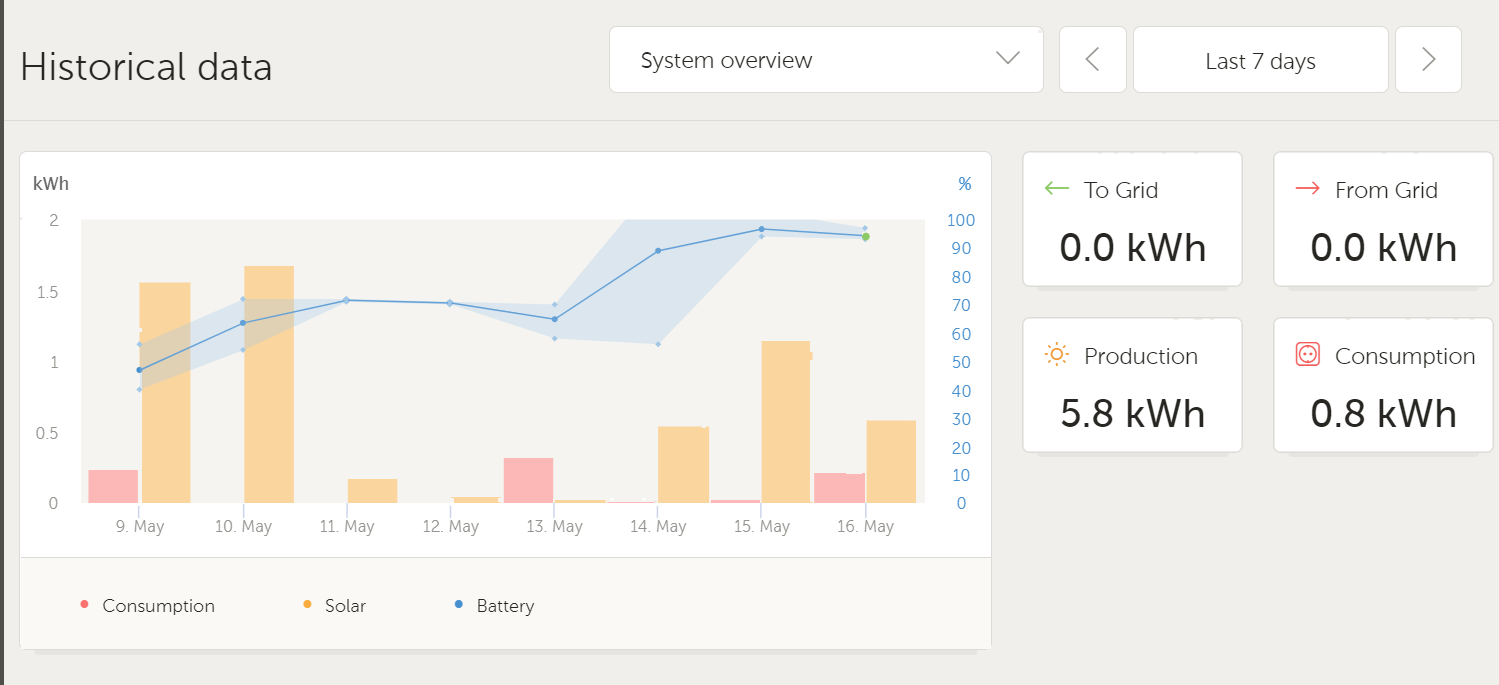
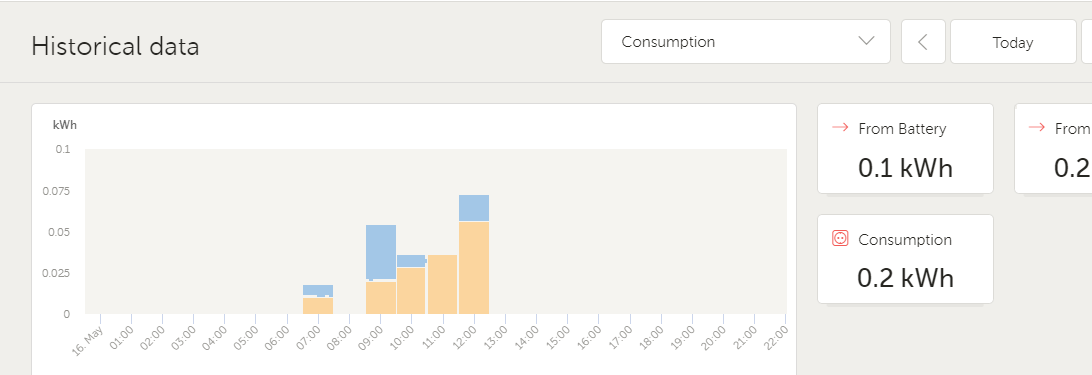
- The system overview is missing the current from the generator:
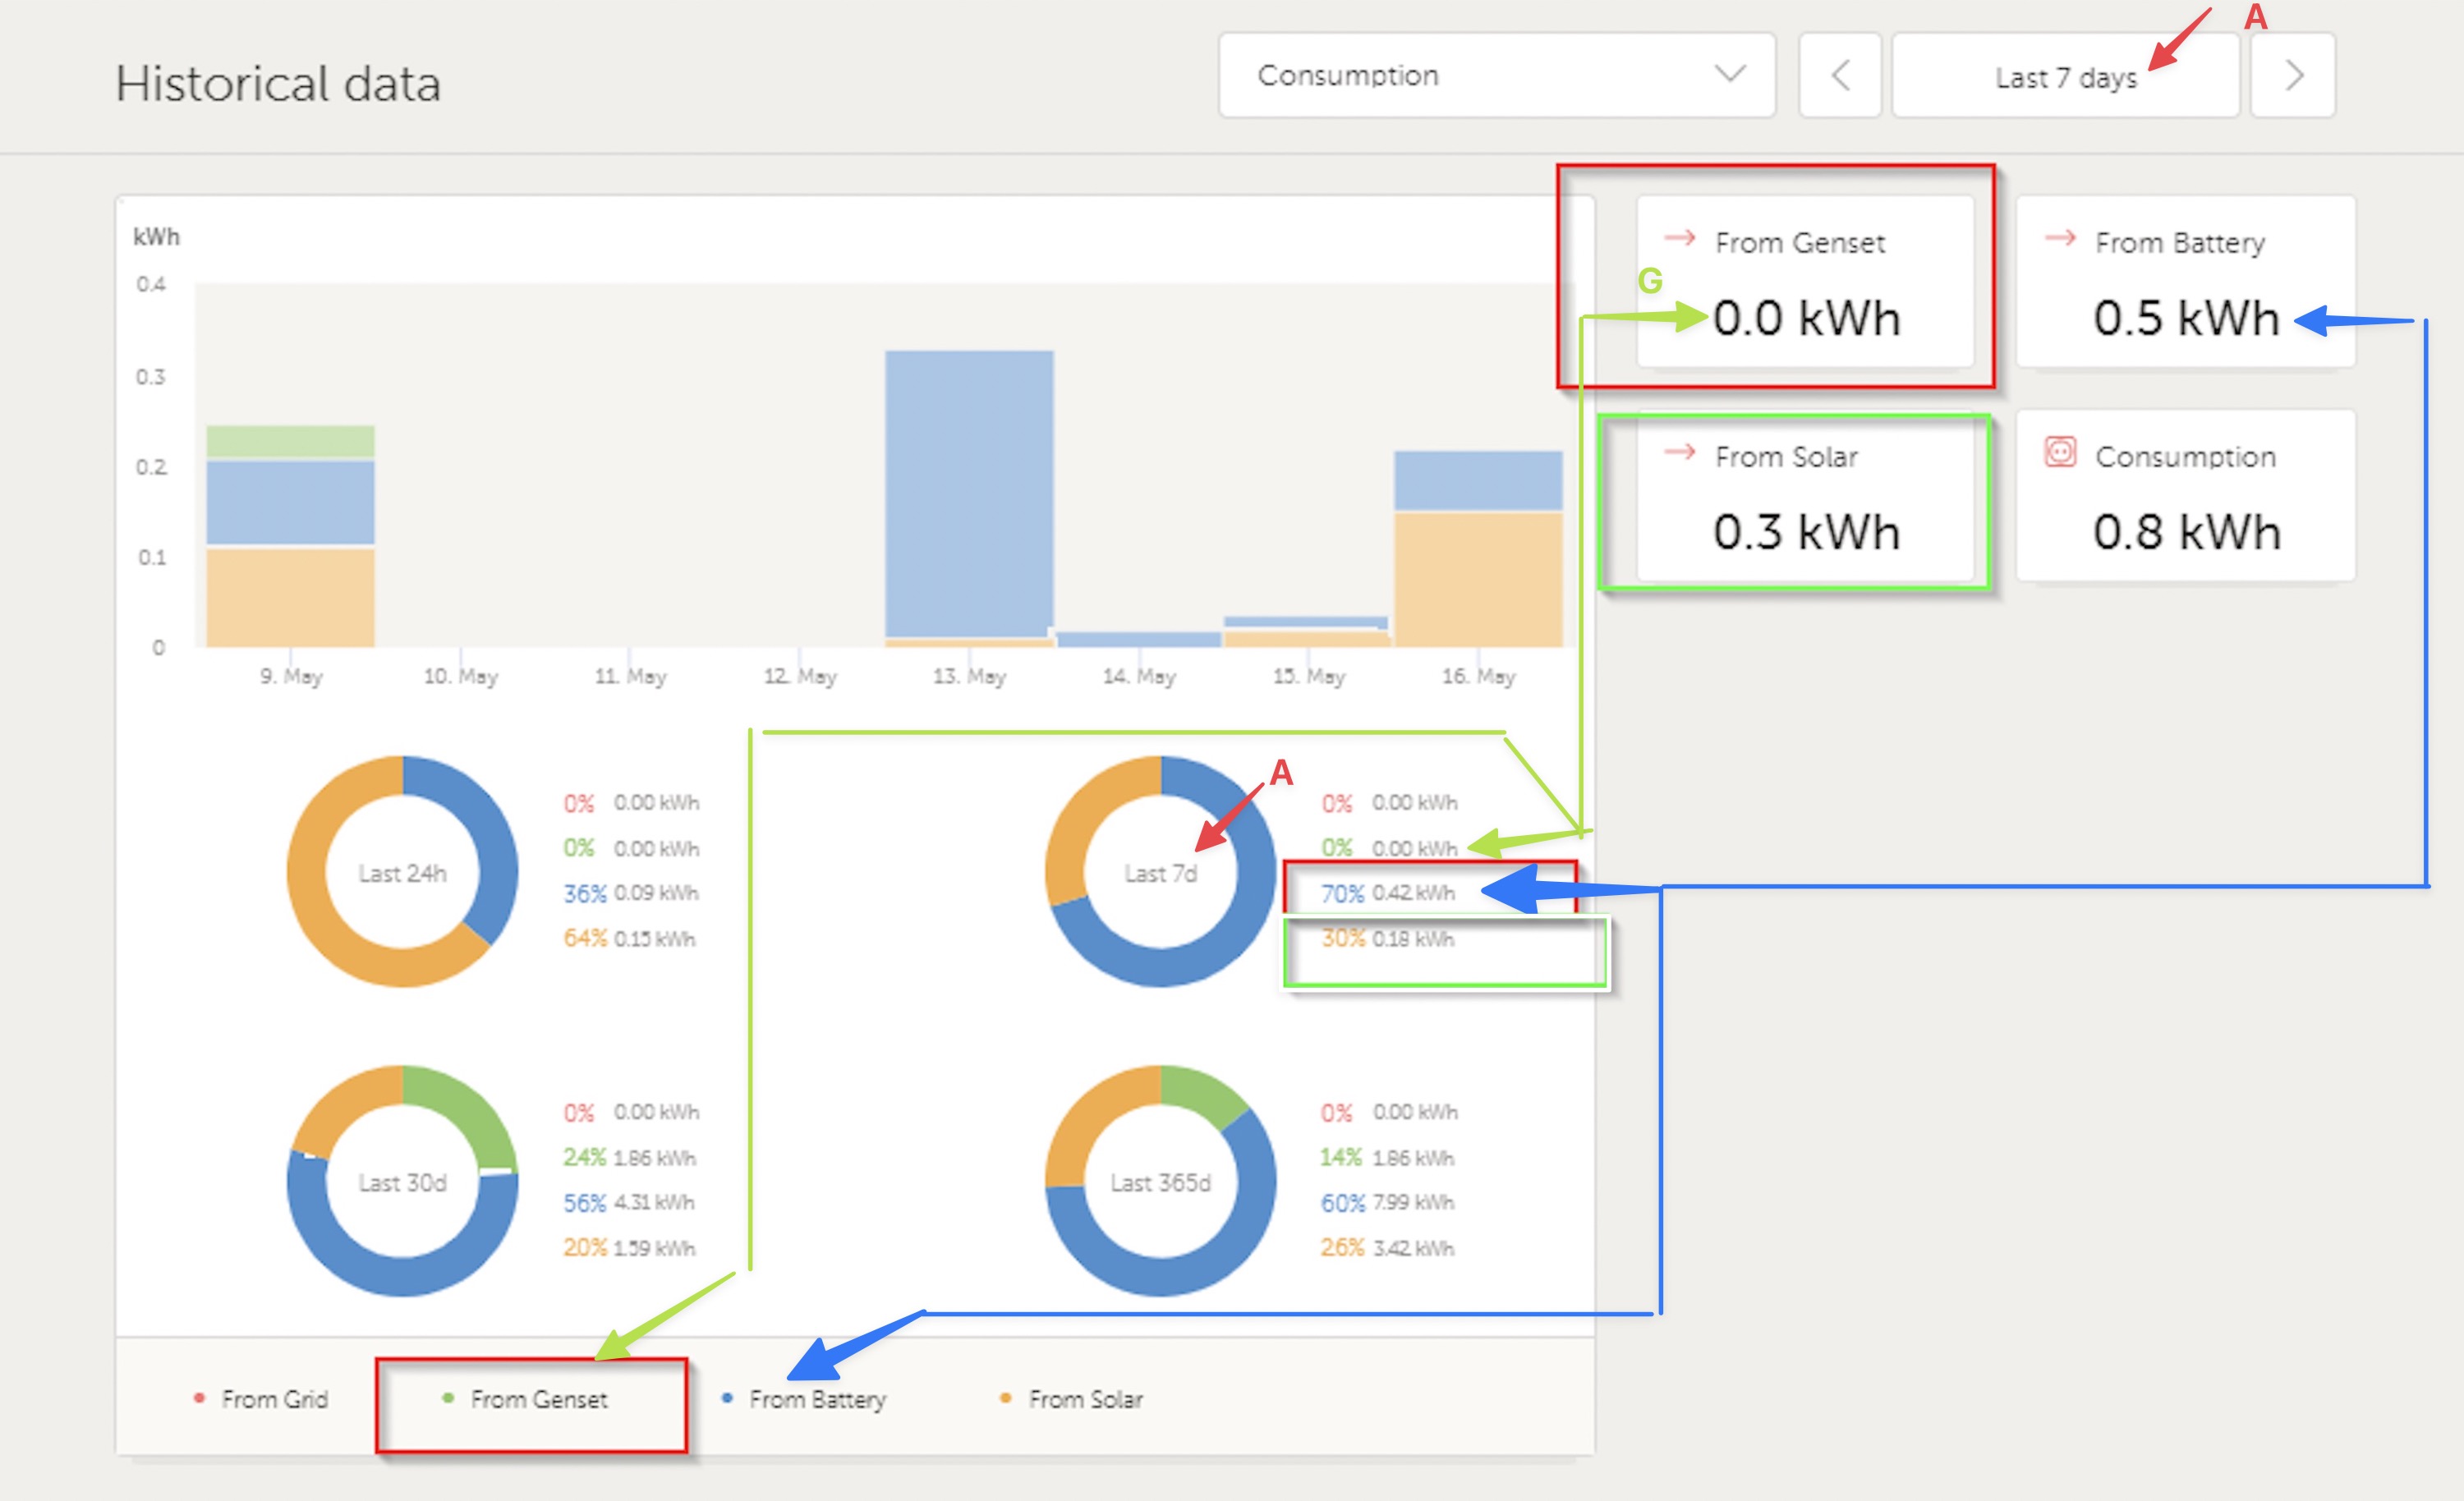
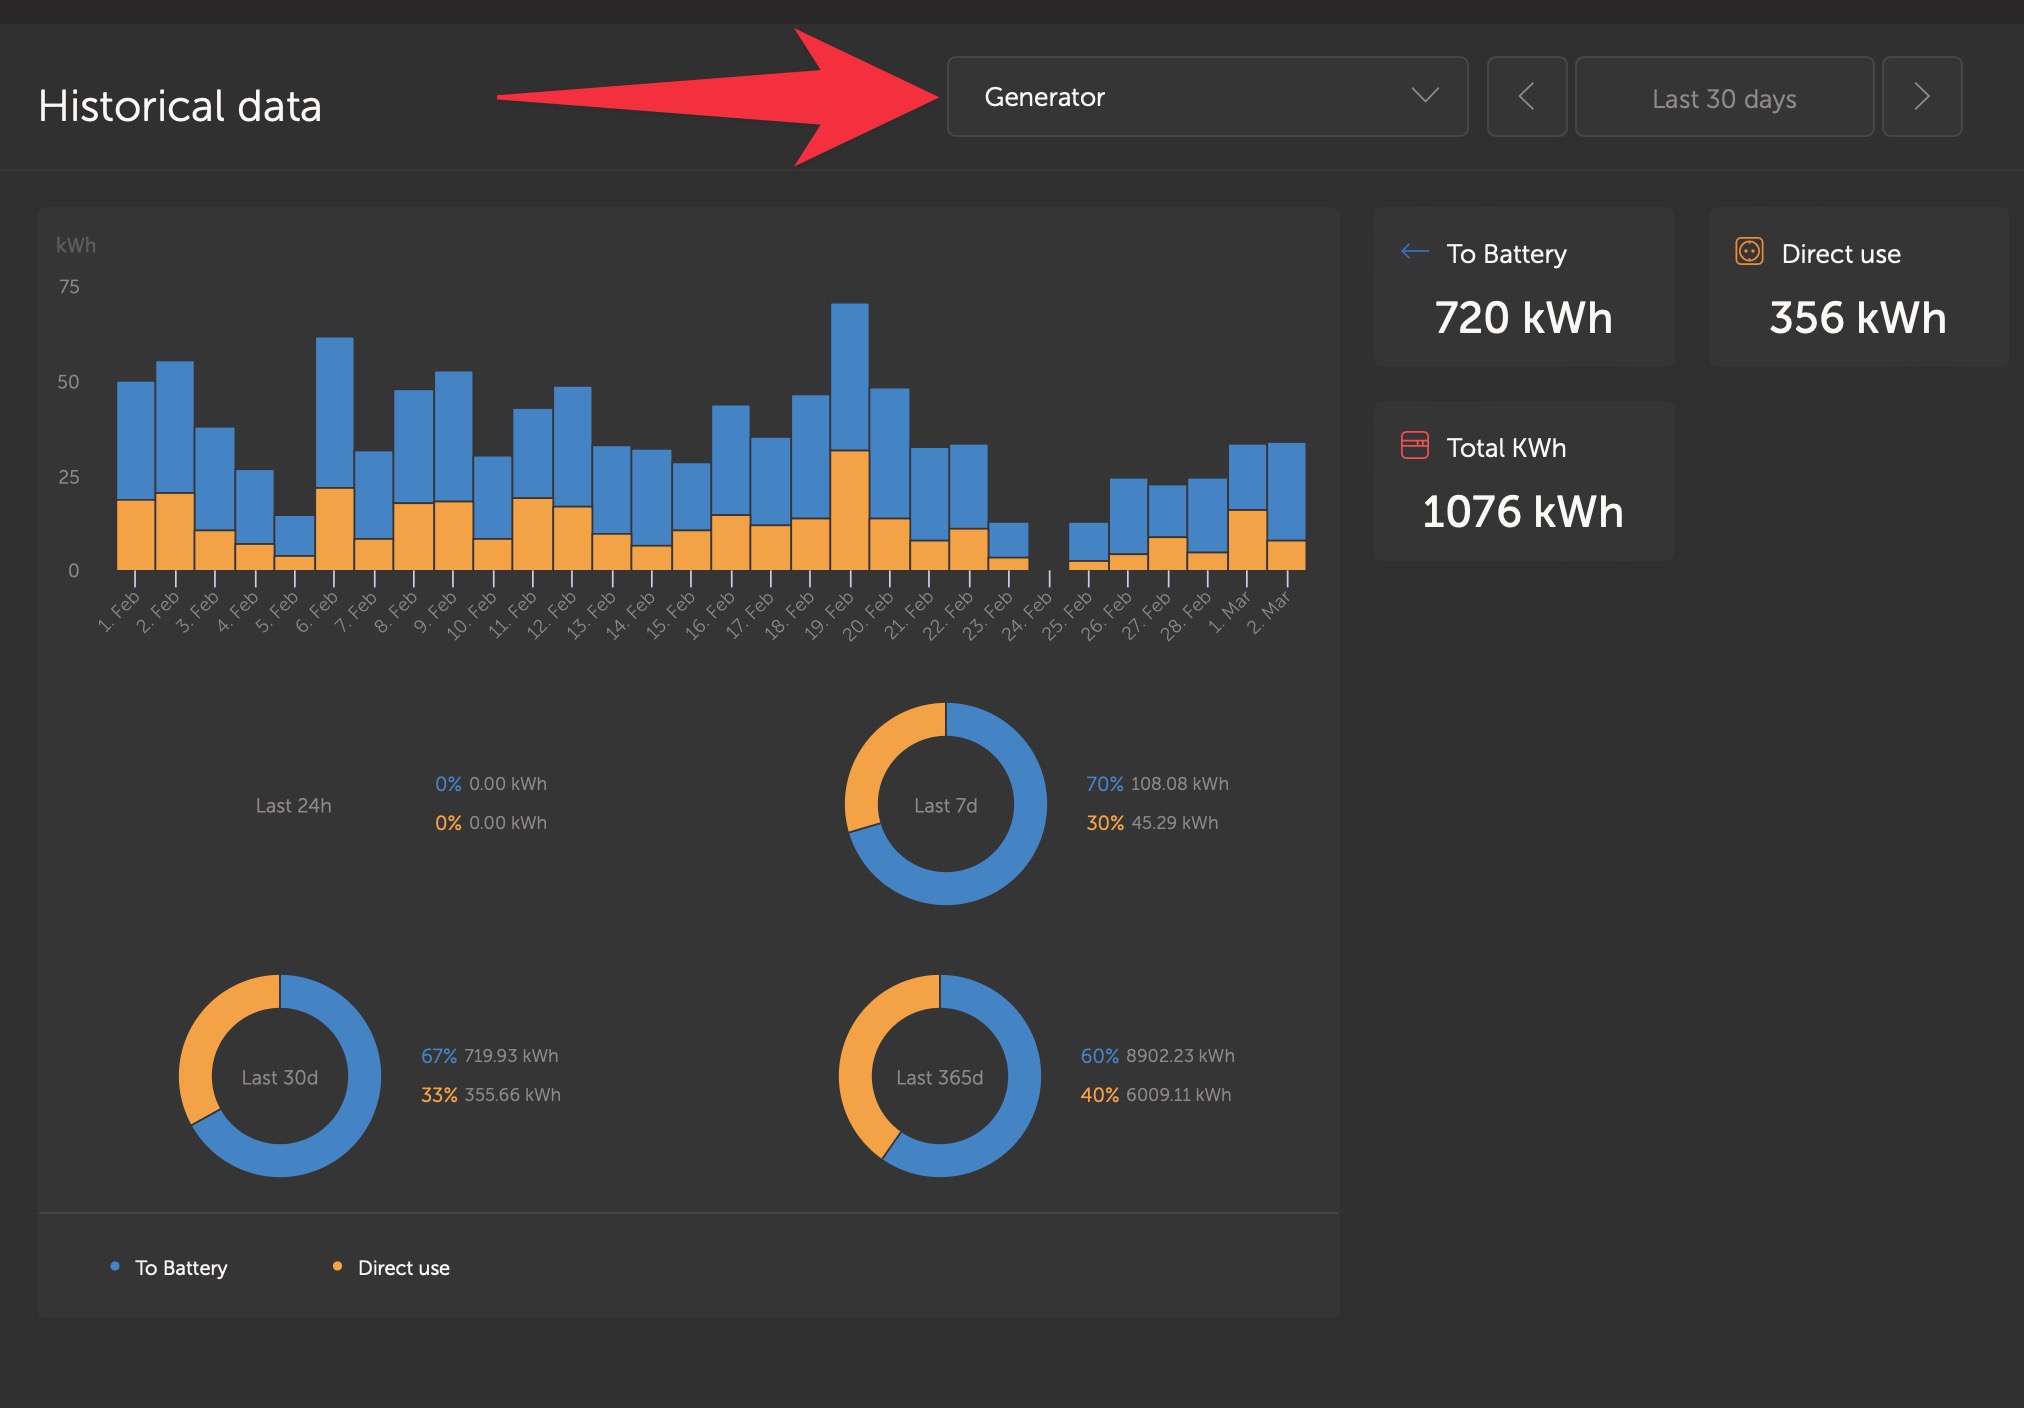
but if I look at the 'Consumption tab' then I can see the generator input:
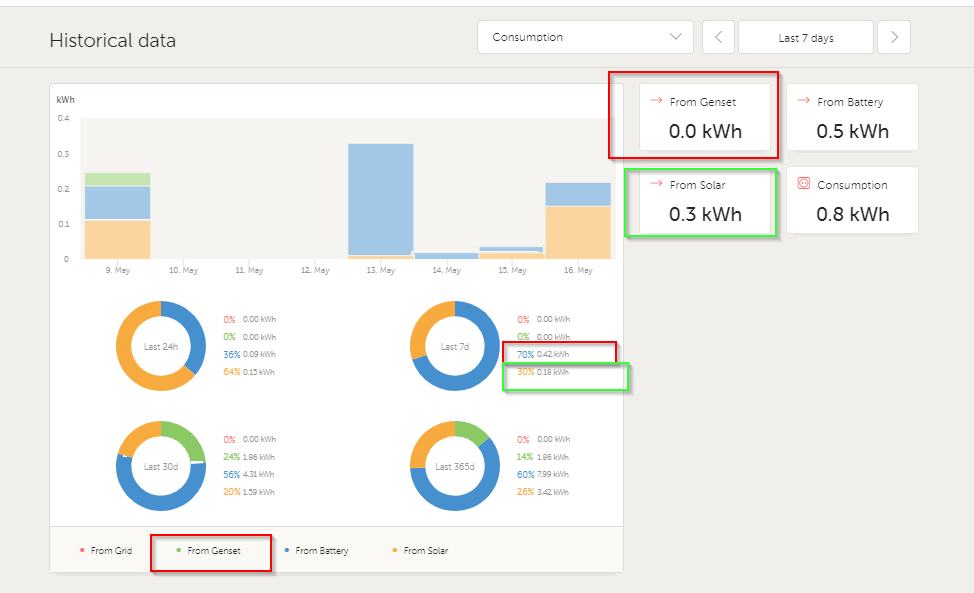
I am curious to know why the voltage generated/used from the Genset shows as 0.0 kWh, while on the red box shows 70%
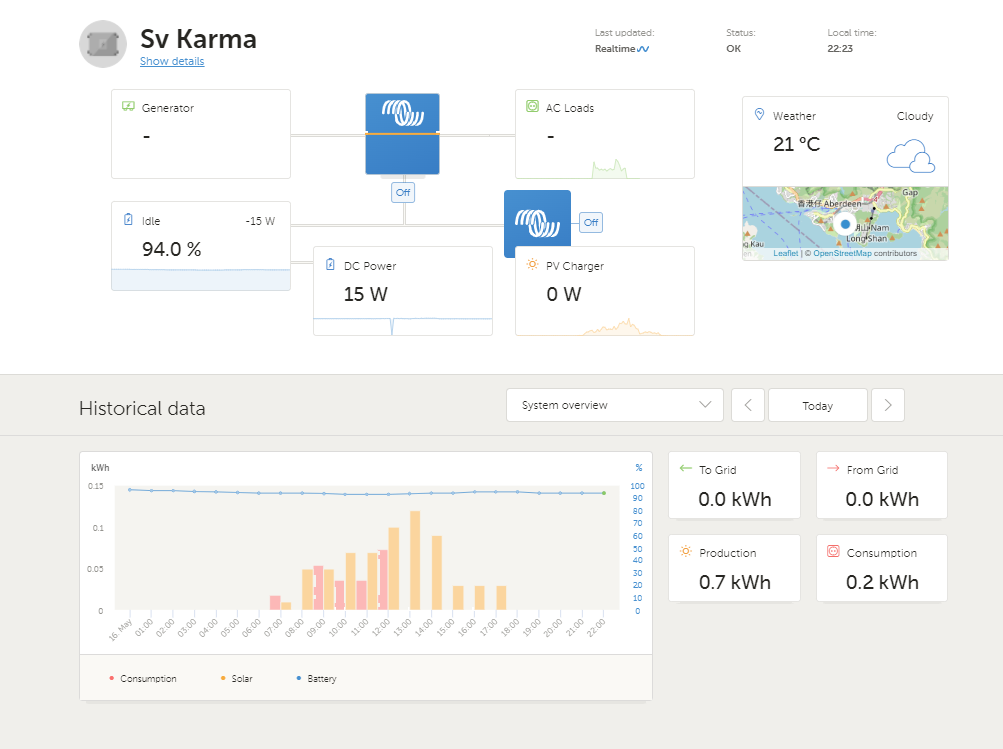
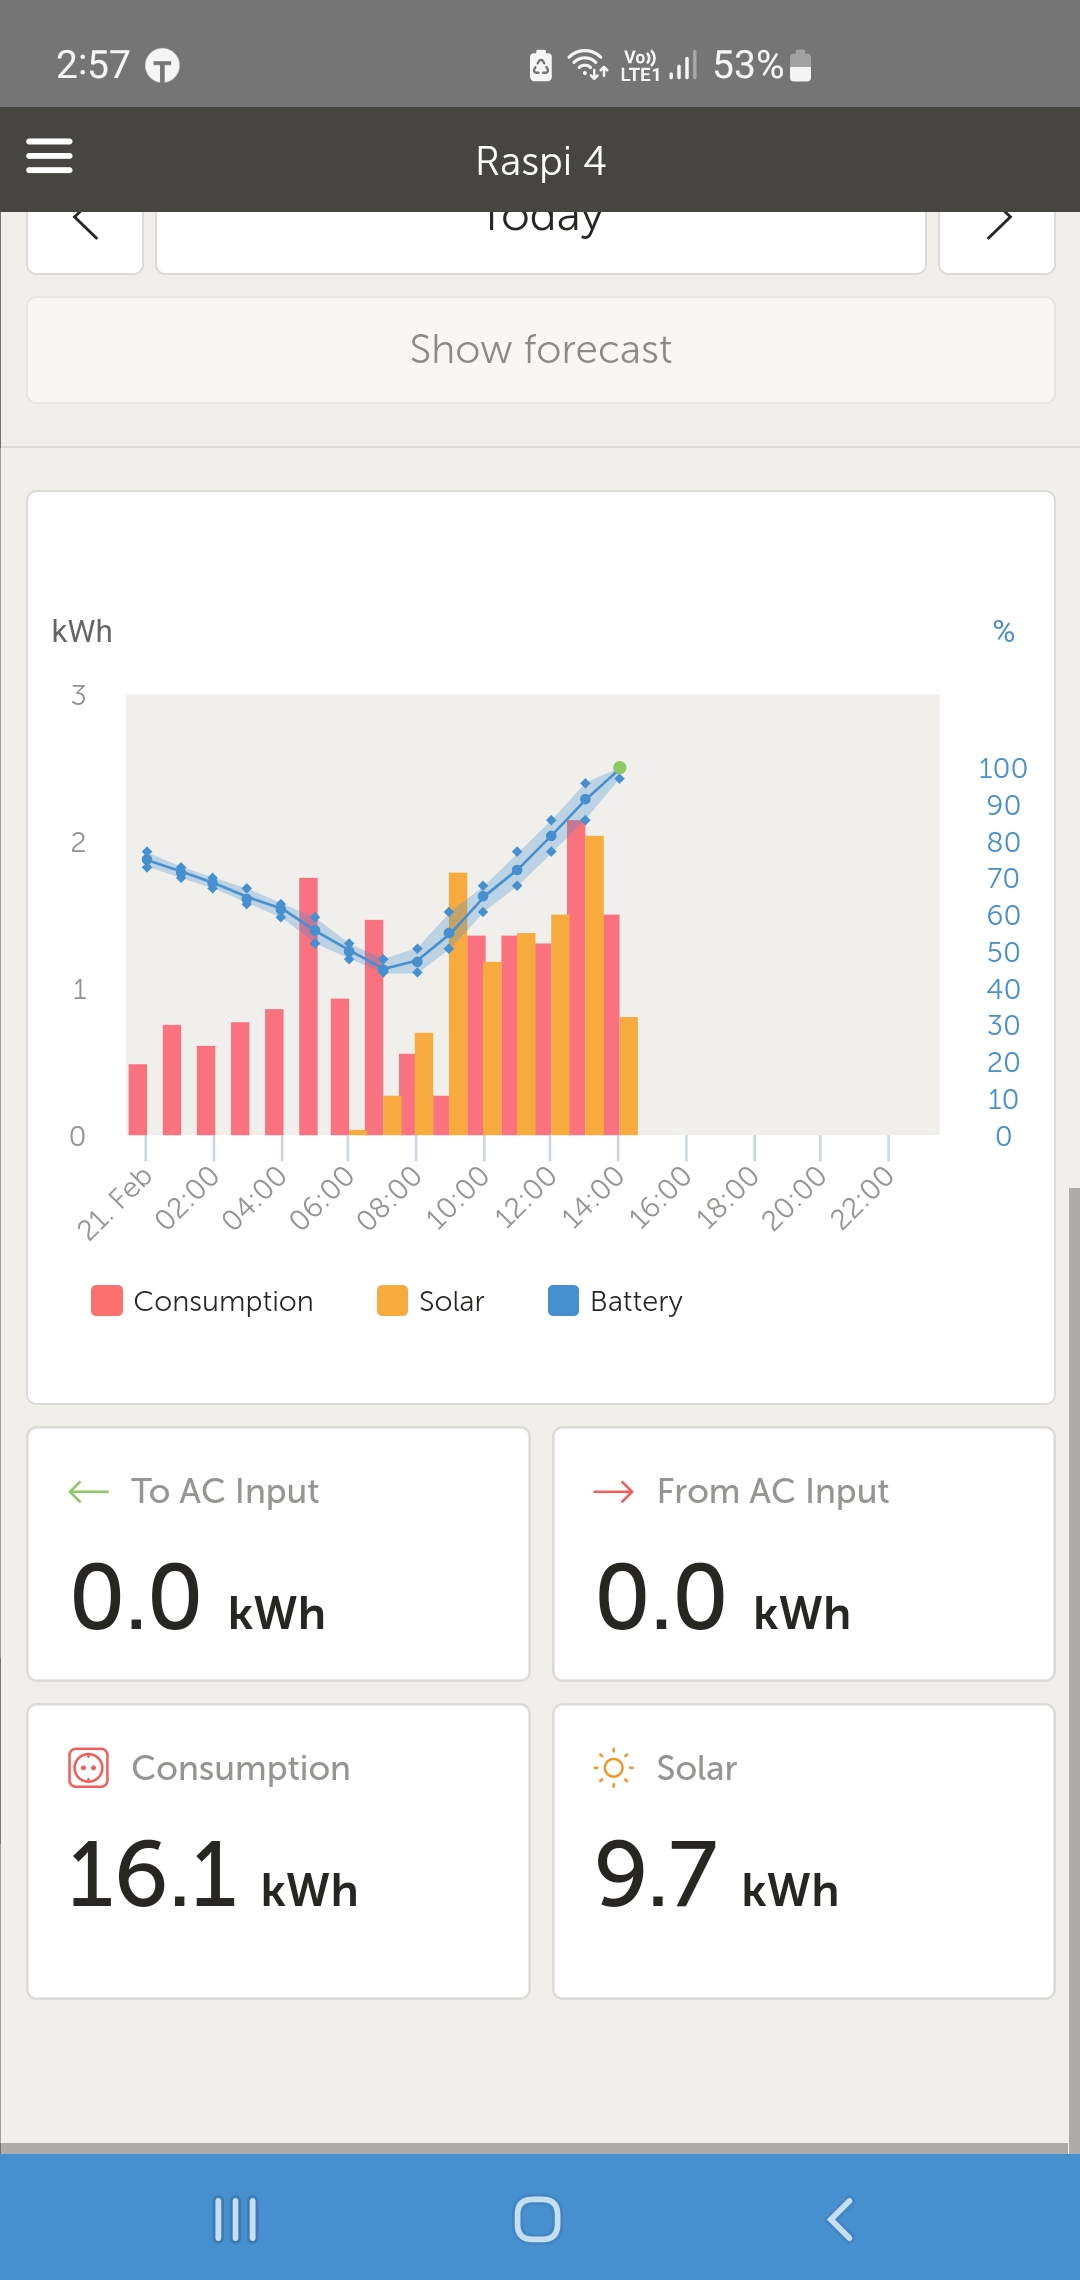
in addition, at the time there was an AC load in the system, and the multiplus was also charging the LIPO batteries
Any ideas?
Cheers