question

wysiwyg avatar image
wysiwyg asked

Suspecting SOC is not accuarte

Hi Everyone,

Needing some assistance please.

Running SmartShunt 500A, GX Cerbo and MPPT150/60

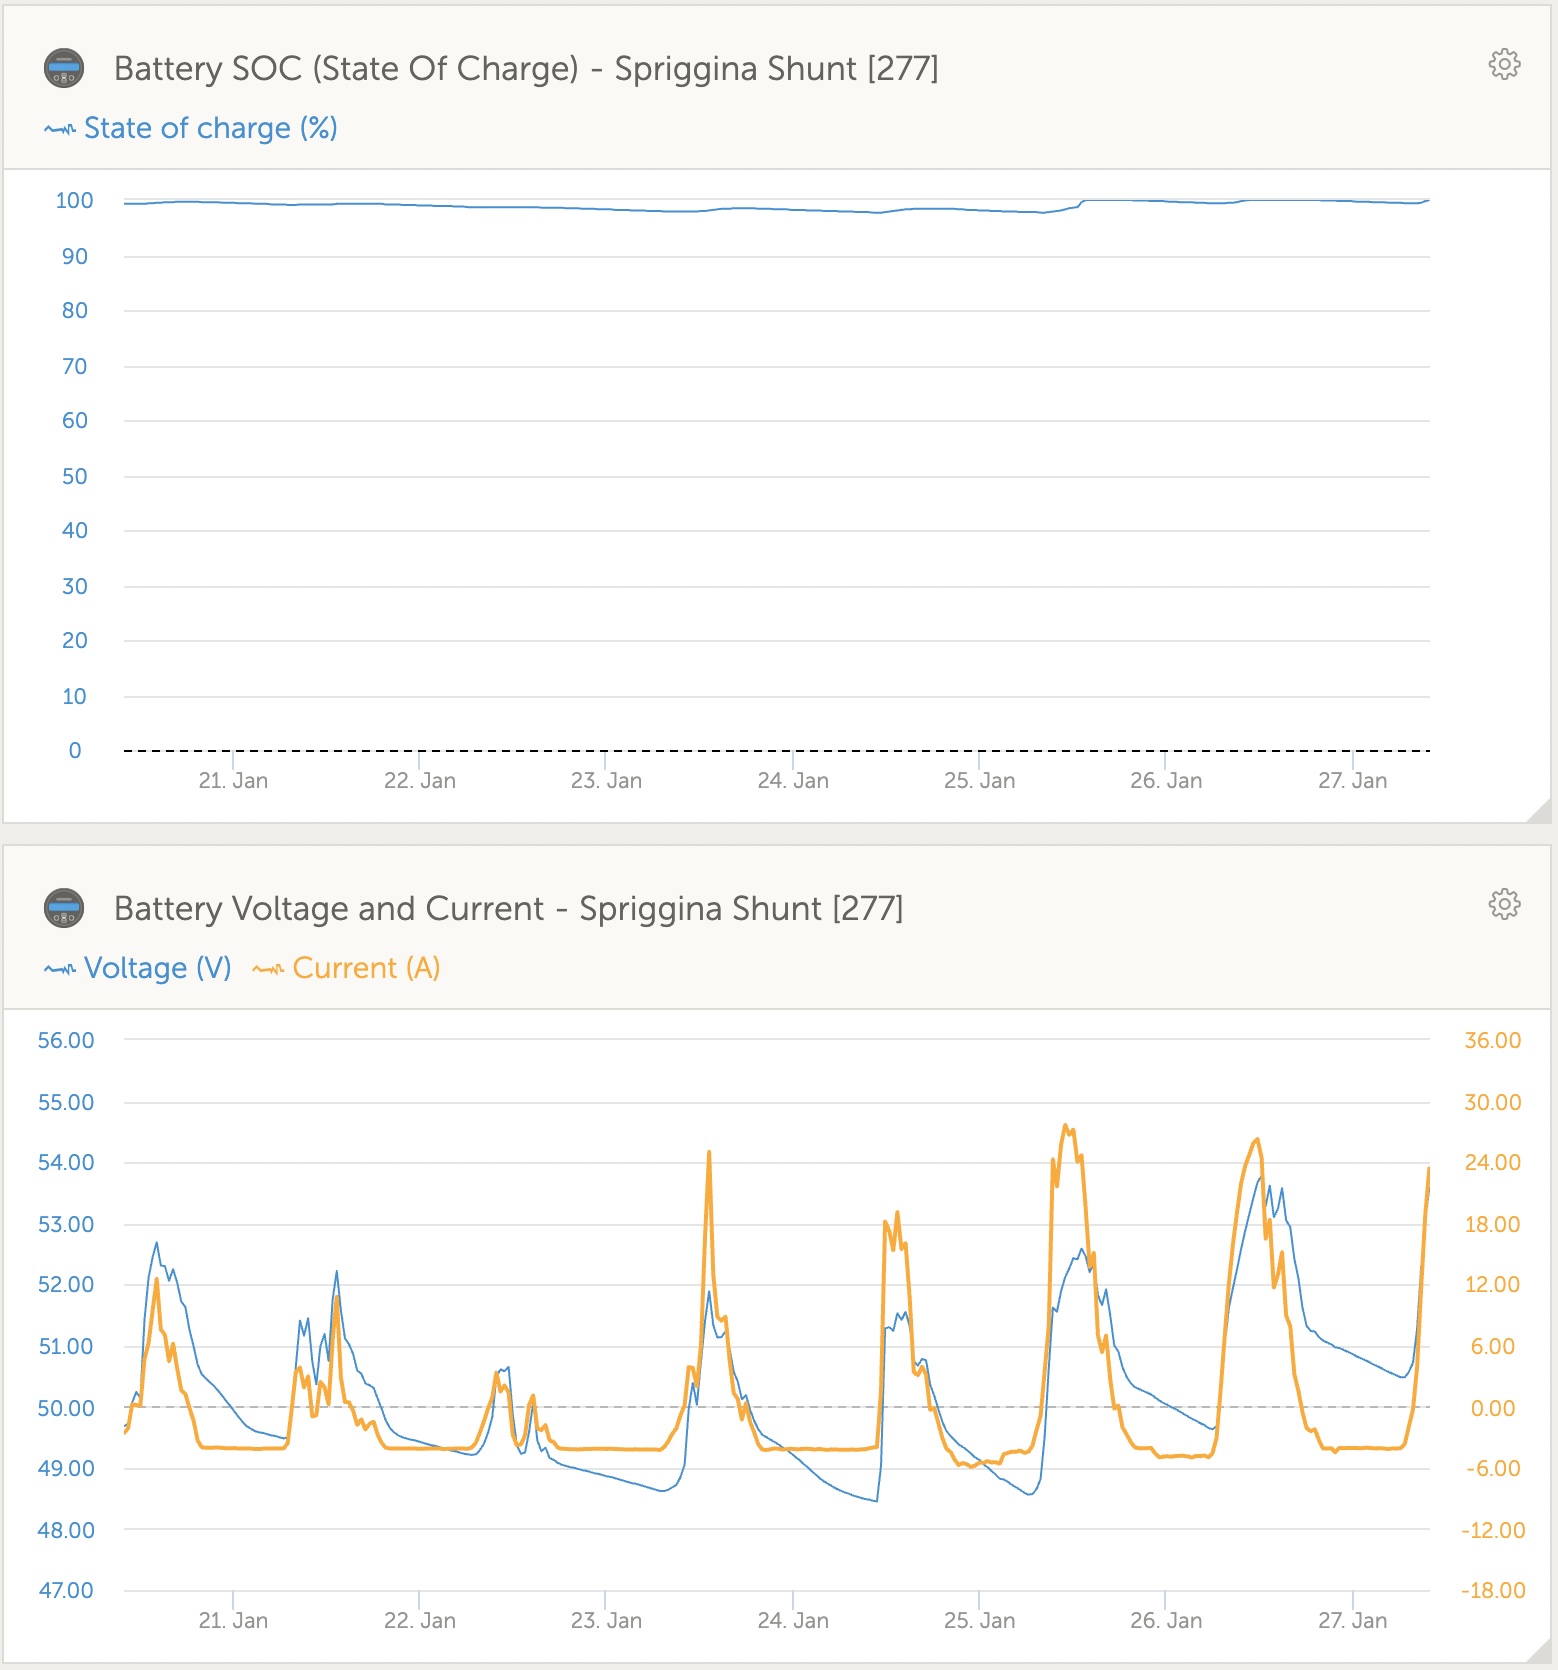
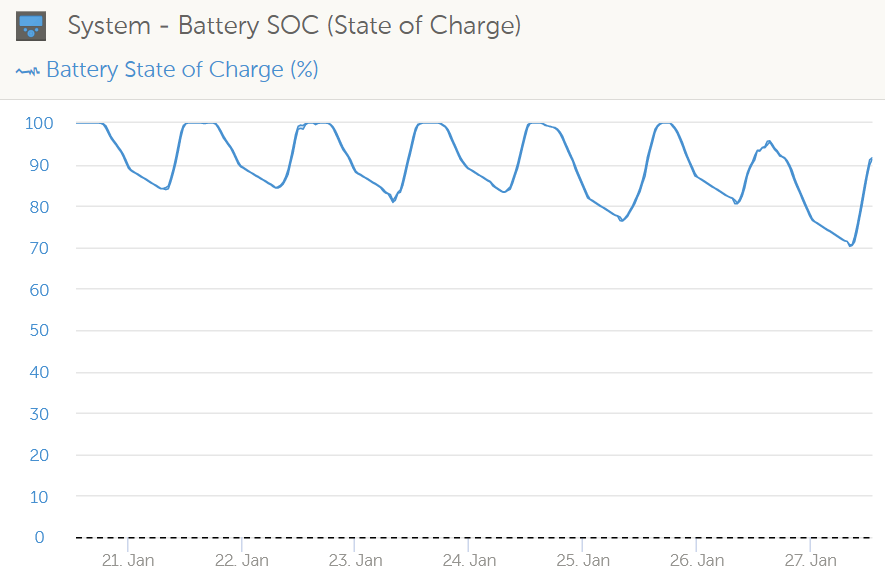
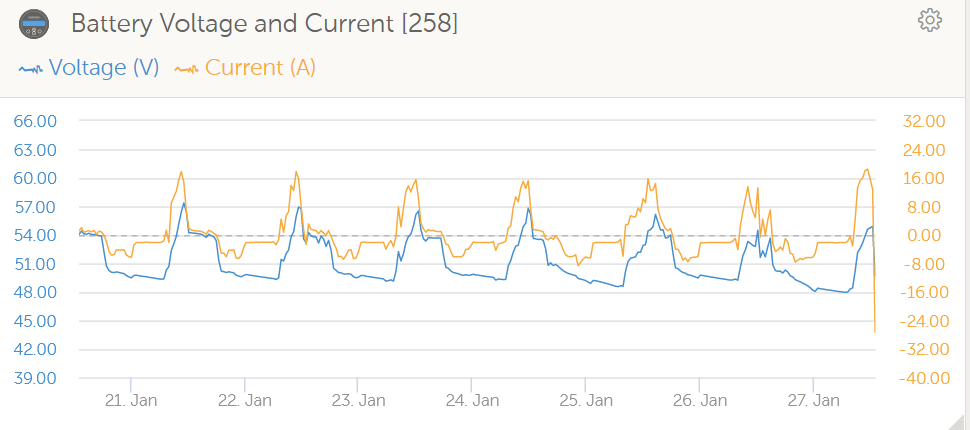
Last week has been cloudy and the batteries have receded to a much lower voltage, and yet SOC was still showing values above 97%, see images attached.

Now that the weather has cleared up, the voltages are creeping up again to normal.

It got as low as 48.45V, surely the SOC should have been representative of that voltage?

Am I missing something here or is this thing lying to me?

screen-shot-2022-01-27-at-100431.jpg

SmartShuntSOC
2 |3000

Up to 8 attachments (including images) can be used with a maximum of 190.8 MiB each and 286.6 MiB total.

3 Answers
JohnC avatar image
JohnC answered ·

Hi @wysiwyg

I remember you, the guy with 1650Ah (1.3 tonne) of batts. So what you're seeing isn't unusual with such light loads. The SShunt doesn't consider V to calculate SOC. If you wanted it to do that then you could have bought some Chinee junk. And looking closely at the curves, your V is still good when crossing zero current.

Maybe my loads aren't too far off yours broadly, so you can compare with my 225Ah batts (that's 7.3 times smaller than yours)..

1643252211924.png

1643252314418.png

(I had a bad day yesterday, ~70% my record low SOC)

So if you divide my drawndown SOC by 7, then your figures look reasonable. But it doesn't mean they're perfect. With such low loads the Peukert Exponent may underestimate SOC drawdown if you're using the default value. If you want to pursue this, get your batt C20 and C100 ratings and run them through Victron's Peukert Calculator. Post back here with your settings too, and we'll see if we can help.


1643252211924.png (40.0 KiB)
1643252314418.png (57.9 KiB)
1 comment
2 |3000

Up to 8 attachments (including images) can be used with a maximum of 190.8 MiB each and 286.6 MiB total.

wysiwyg avatar image wysiwyg commented ·
Yes thats me, however this is another installation with only 875AH @ 48V.

Thanks for the info, I would rather it overestimate than under, will play around with the Calculator.
Might also manually set SOC next time the batteries are at around 48V, set the SOC to 60% SOC and work on it from the other end of the scale.

0 Likes 0 ·
Lionel SEYDOUX avatar image
Lionel SEYDOUX answered ·

wWth lead bats, at the end of bulk, CCGX shows a 100% soc. But it goes on absorbing for a while up to float. Thence this 100% SOC is optimistic. Is there a way to have the proper SOC?

System: 2kWo on roof (SSE, slope 8/10), about 30kwh lead bats, Blue solar MPPT 150/65 charge controlers, One multiplus 24/5000/230, CCGX and VRM

2 comments
2 |3000

Up to 8 attachments (including images) can be used with a maximum of 190.8 MiB each and 286.6 MiB total.

nickdb avatar image nickdb ♦♦ commented ·
Do you have a shunt?
0 Likes 0 ·
Lionel SEYDOUX avatar image Lionel SEYDOUX nickdb ♦♦ commented ·
of course, it is a BMV712
0 Likes 0 ·
Lionel SEYDOUX avatar image
Lionel SEYDOUX answered ·

From Lionel: I have BMV. SOC is NOT an accurate estimation. It is based on an intruduced capacity in Ah, But as the years go by, that capacity is lowering, which is not measured by BMV or any means. All the more it shows 100% at the beginning of absrbtion which goes on charging. At that moment, my very sensitive nose would estimate the soc at 80% only. So dont worry.

My strategy is to follow all data from the very installation of the batts by following what happens during periods without any charge (at night) and with a constant load. I then can estimate:

- total exhausing lengh = period lengh / DOD in %/100

- maximum capacity = used Ah in that period / DOD

Graphs show a pretty linear rule for any specific load.

Repeating monthly should hel estimate the actual tatal capacity. But I may be wrong: only started this procedure now with my 10 years old bats


2 |3000

Up to 8 attachments (including images) can be used with a maximum of 190.8 MiB each and 286.6 MiB total.

Related Resources