question

multivictor avatar image
multivictor asked

Difference between the values shown in the tabs "system overview" and "consumption".

Hello,

I have a MultiPlus-II 48/5000/70-50 in combination with a BYD LVL 15.36 kWh battery/E112 energymeter and a monofase + N 40A grid and 5.6 kWp monofase solar system. It is now 3 months in use.

Problem:

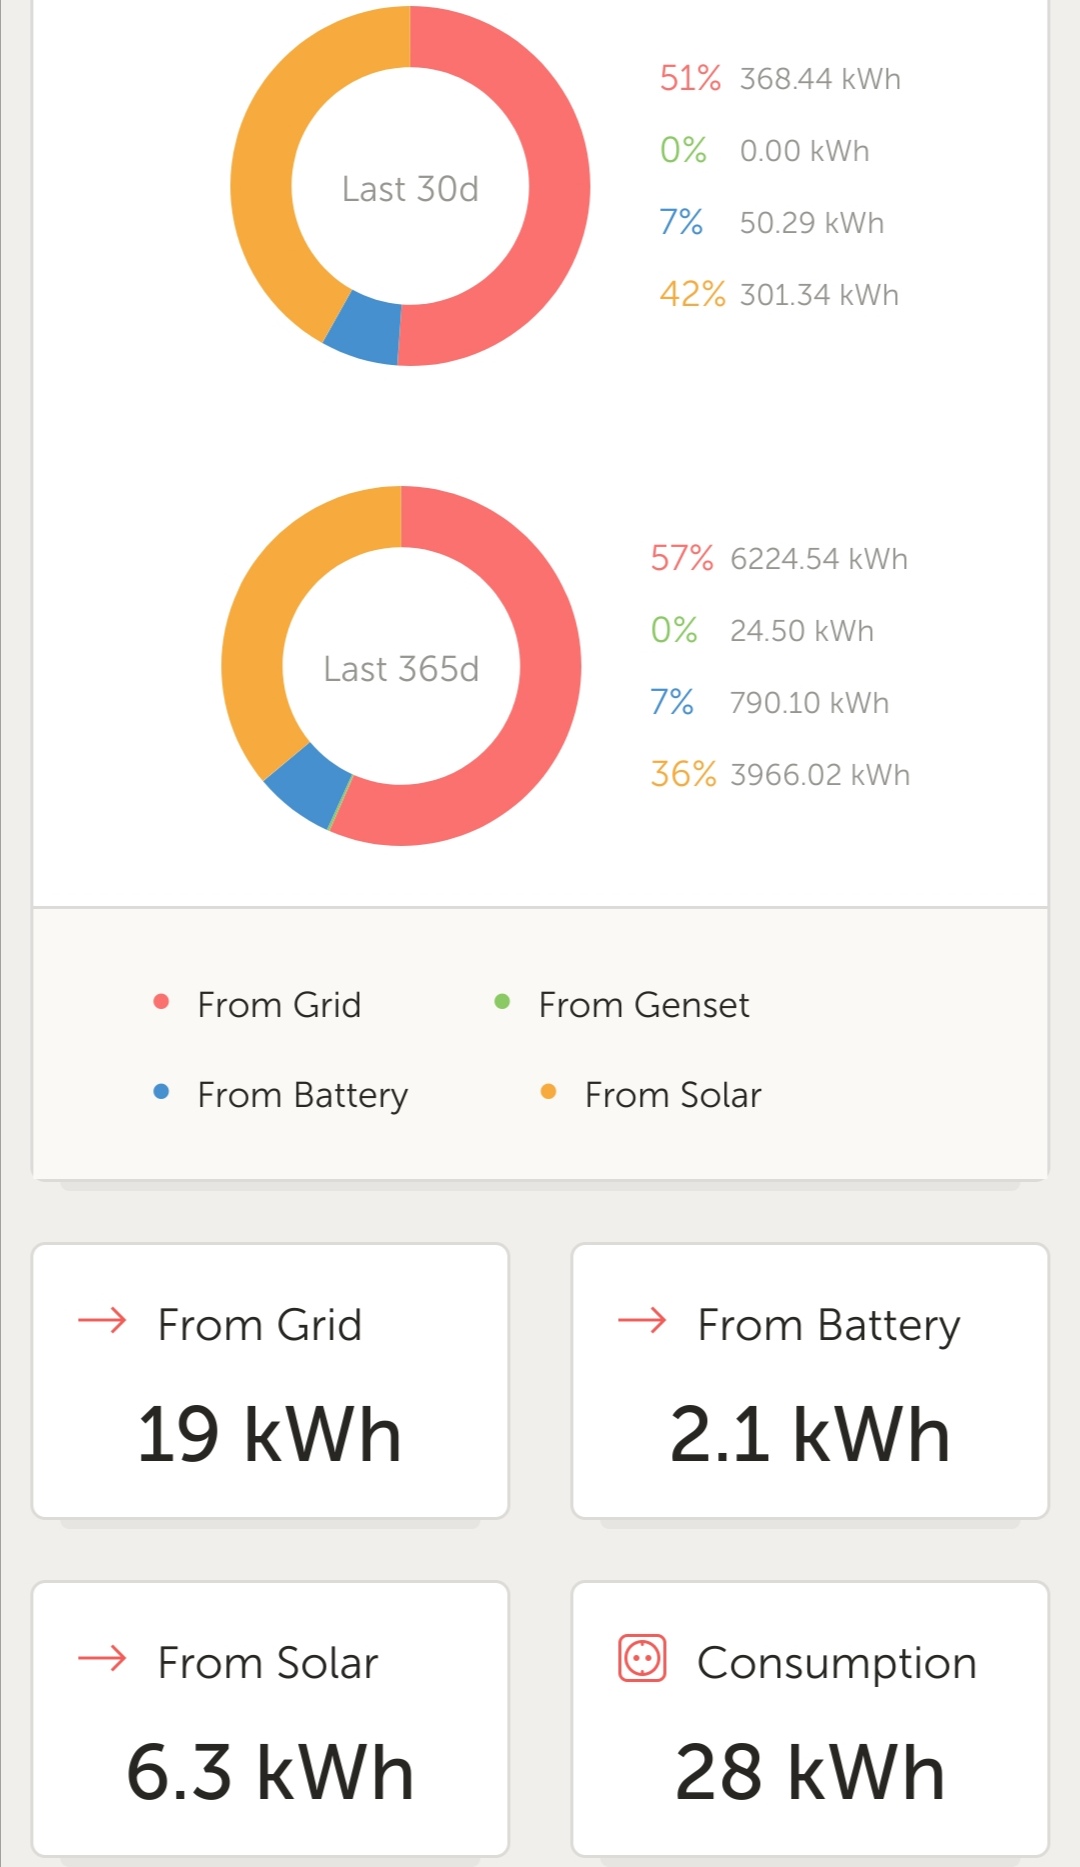
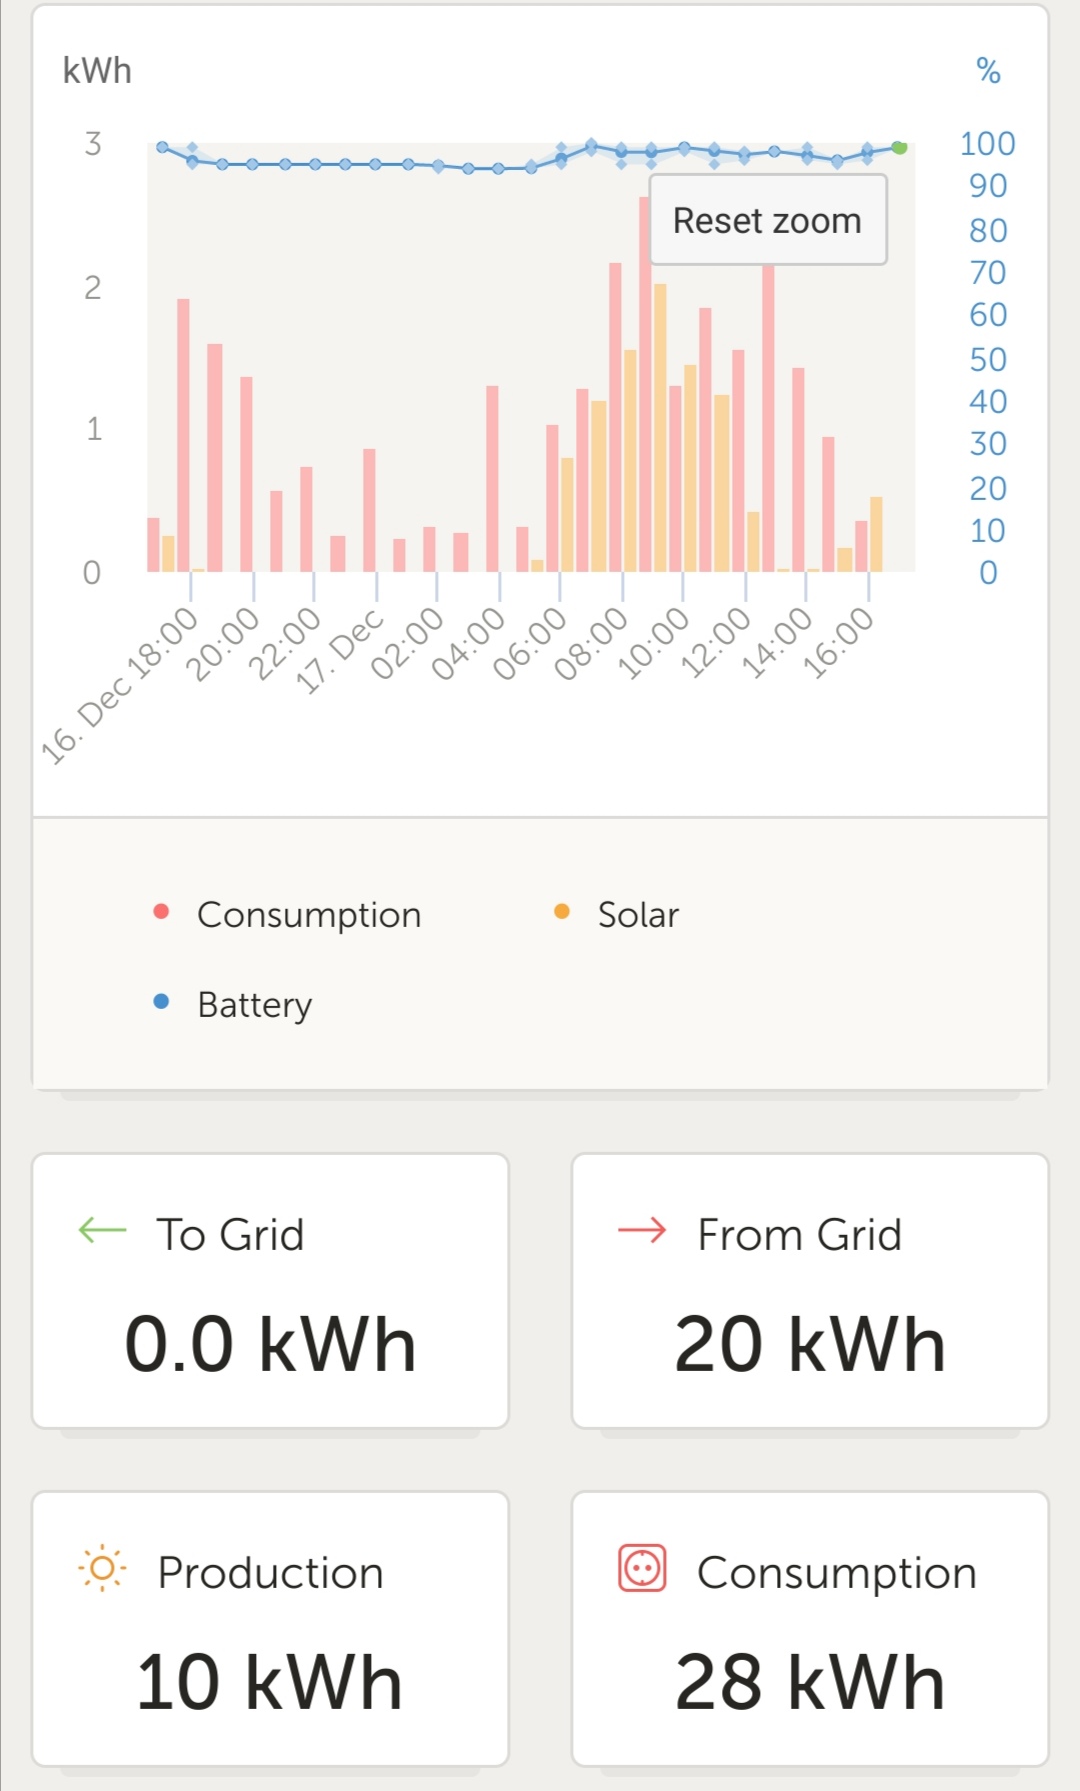
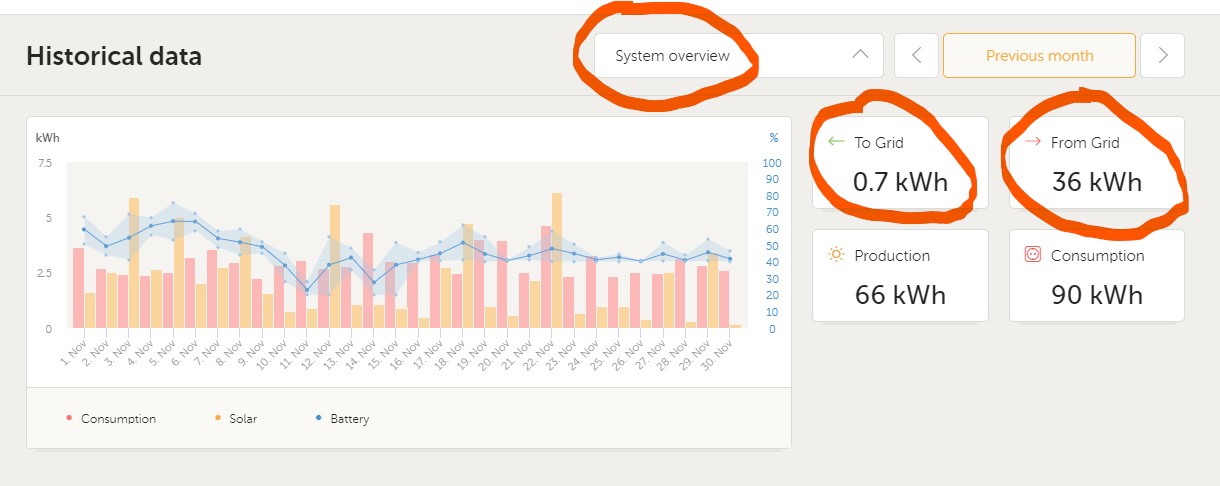
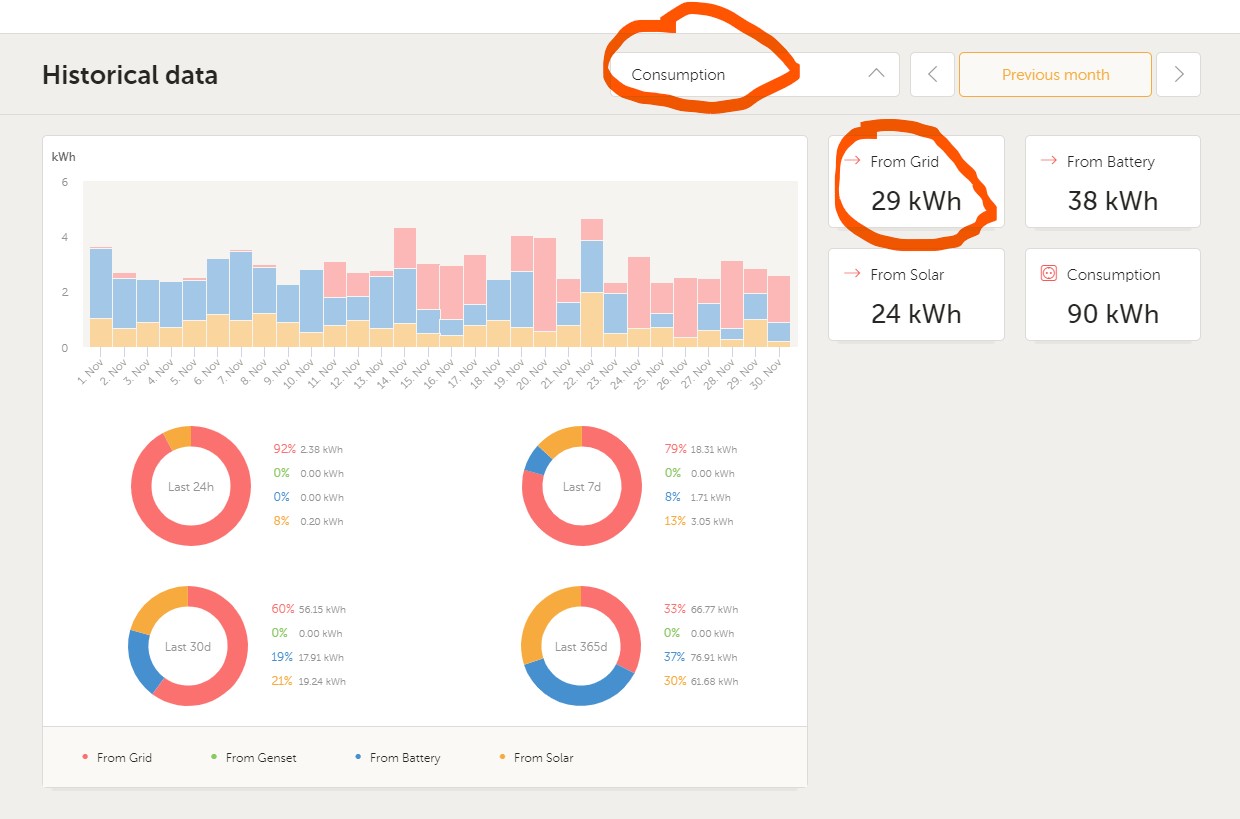
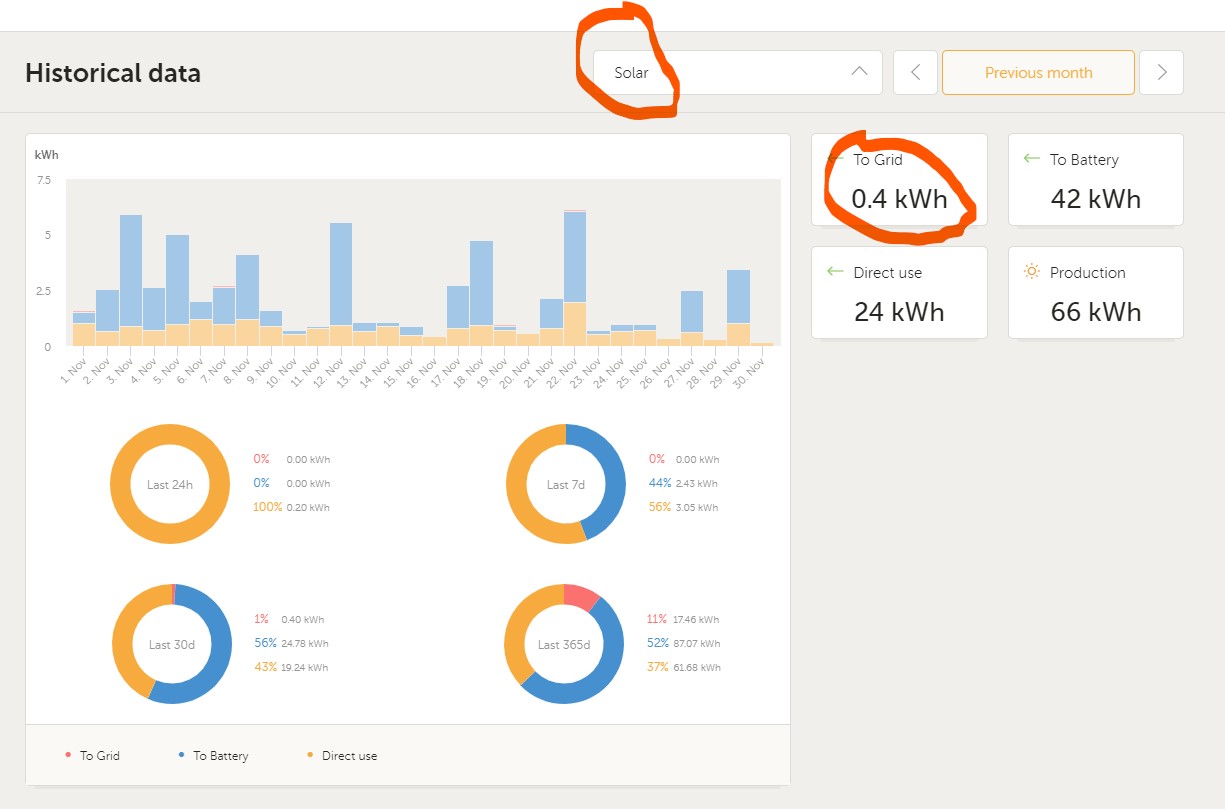
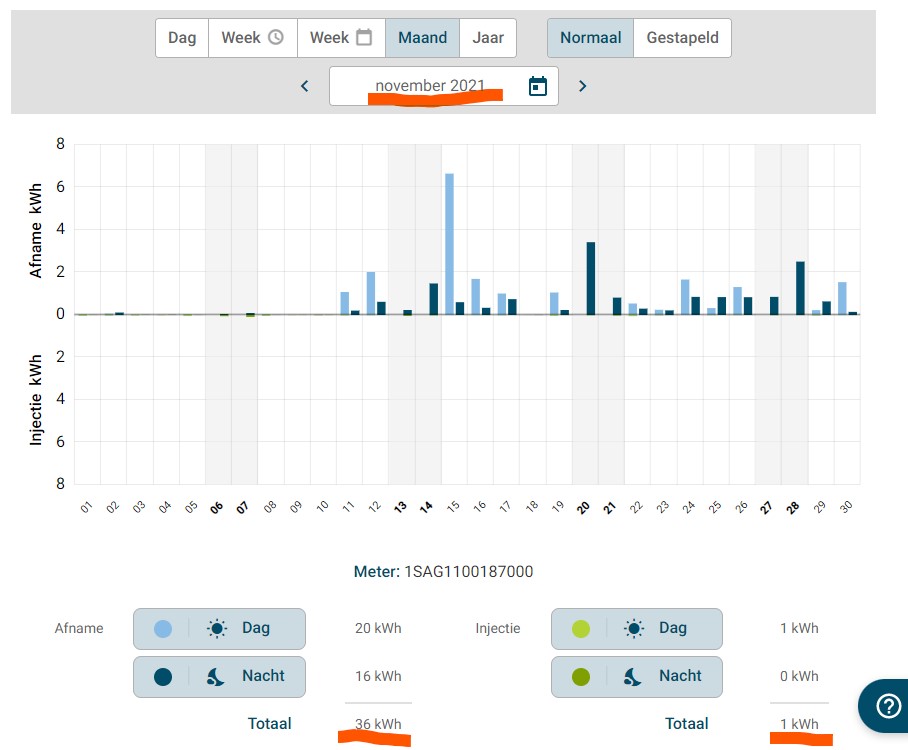
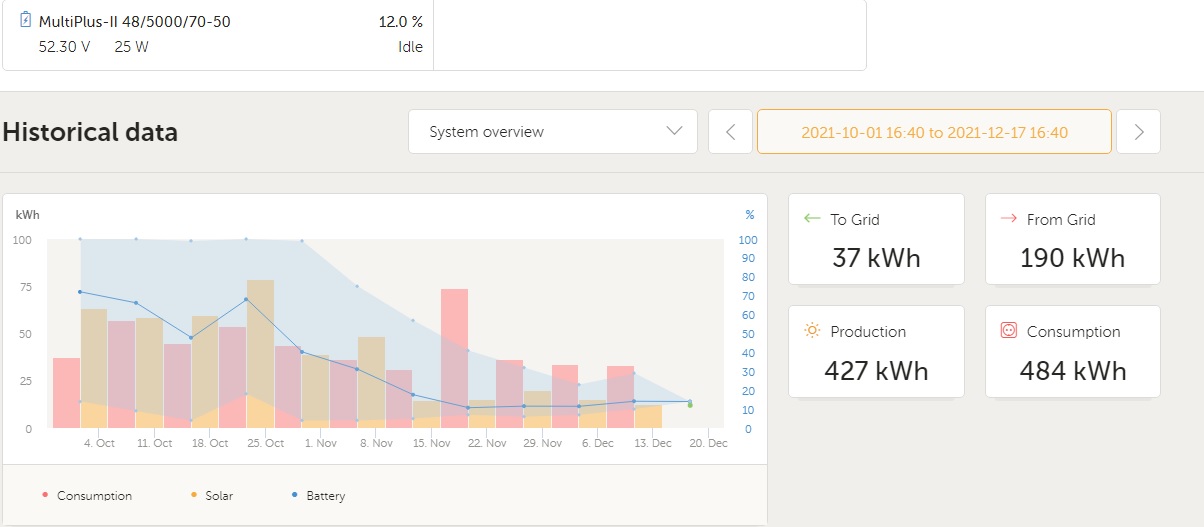
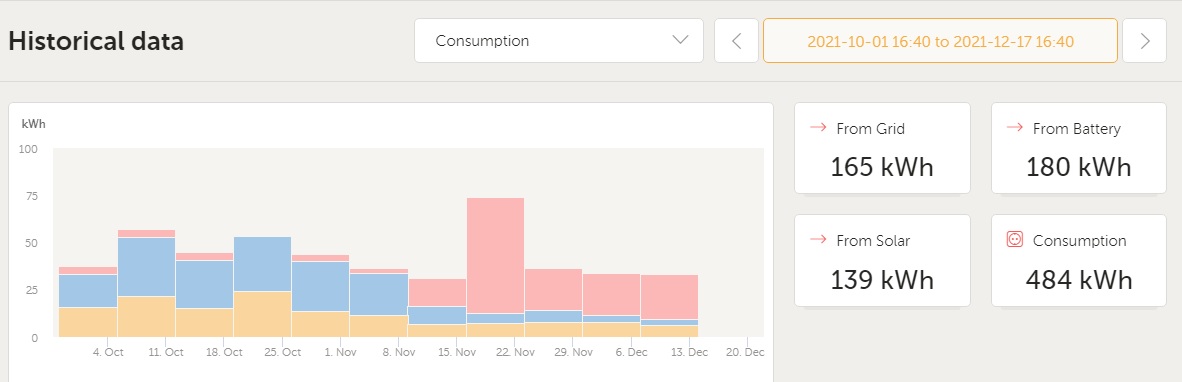
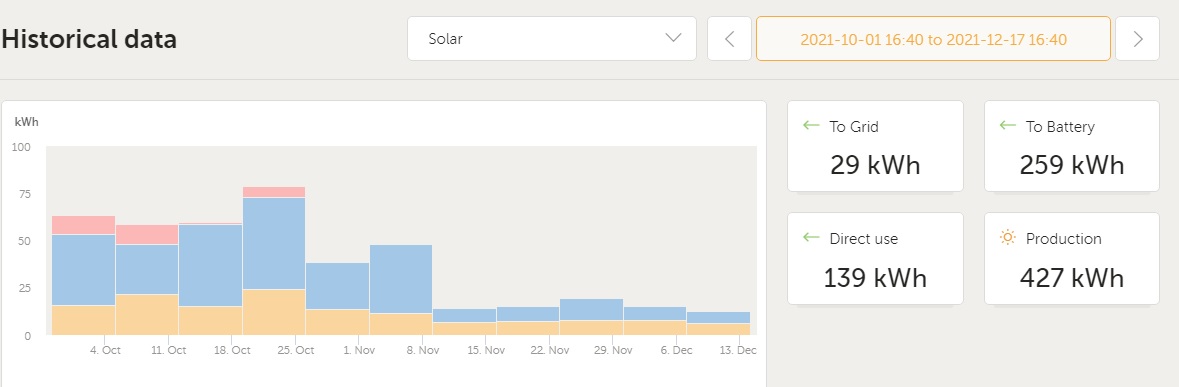
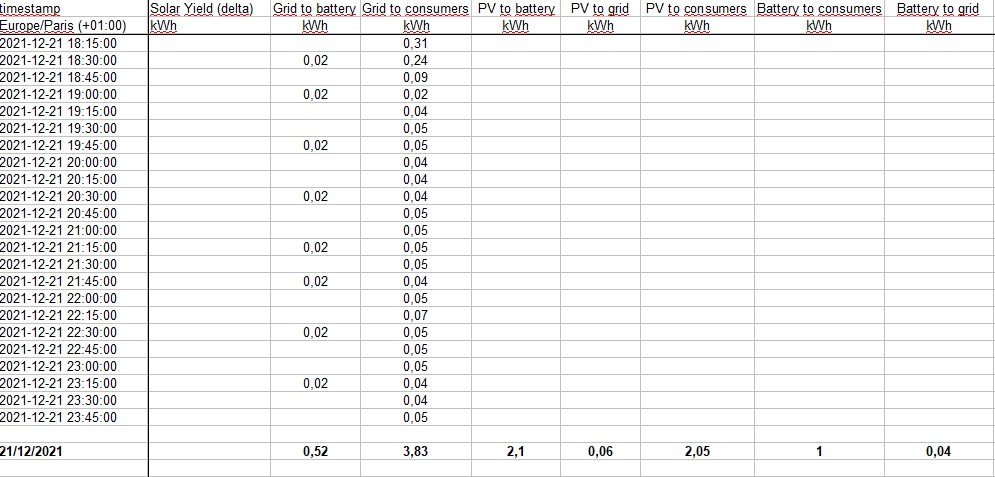
The net consumption data in the tab "system overview" and tab "consumption" are always different (up to 20%). The data shown in the tab "system overview" is +/- the correct value (in comparision with the digital meter). The data shown in the tab "consumption" is always to low. Problem is that for further stats the VRM portal always use the data in the "consumption" tab (wrong value). All my stats are also wrong values.

Question:

Why is there a difference between the values shown in the tabs "system overview" and "consumption" and uses the VRM portal only the wrong data in the "consumption" tab and not the correct one in the "system overview" .

ps. Asked the same question to installer but can't answer the question.

Grtz,

Ivo (Belgium).


VRM
2 |3000

Up to 8 attachments (including images) can be used with a maximum of 190.8 MiB each and 286.6 MiB total.

6 Answers
Alexandra avatar image
Alexandra answered ·
@Peter1

The solar tab just describes where your solar production only was used.

So the two different 'to grids' will be from different sources. Some overshoot from solar some maybe feedback from so ething else like back emf from pumps etc. So from the loads side. I am guessing each system has its own characteristics.

The from grid now between the two tabs on overview and consumers refer to how much went direct to loads and the other what was used in the whole system from grid, like for instance when power assisting, then replacing/charging the battery to replace power used in power assisting. So used from grid but not direct to loads

2 |3000

Up to 8 attachments (including images) can be used with a maximum of 190.8 MiB each and 286.6 MiB total.

Alexandra avatar image
Alexandra answered ·

@MultiVictor

Must have something to do with your meter.

This one is metered by the Quattro

screenshot-20211217-170324.jpg


1 comment
2 |3000

Up to 8 attachments (including images) can be used with a maximum of 190.8 MiB each and 286.6 MiB total.

Alexandra avatar image Alexandra ♦ commented ·

..

screenshot-20211217-170301.jpg

0 Likes 0 ·
peter1 avatar image
peter1 answered ·

Same question here.

systemoverview.jpg

consumption.jpeg

solar.jpeg

Looks like "System overview" has the correct data and is the same as the data from my grid operator. "Consumption" and "Solar" give other data. Why ?

fluvius.jpg


systemoverview.jpg (84.0 KiB)
consumption.jpeg (106.7 KiB)
solar.jpeg (95.6 KiB)
fluvius.jpg (83.6 KiB)
2 |3000

Up to 8 attachments (including images) can be used with a maximum of 190.8 MiB each and 286.6 MiB total.

multivictor avatar image
multivictor answered ·

Alexandra and Peter, thx for the response.

@Peter1 : same results. From grid in tab System overview is simular to grid operator digital meter
Results From grid in tab Consumption are always lower as values in Sysem overview and operator grid meter.

@Alexandra : If the problem is a meter problem I don't understand why there is a difference in values in the same VRM portal? Datavalues From and To Grid" in tabs System overview and Consumption are from the same meter? I understand that there is a difference in vaule between to different meters (grid meter dan VRM meter) but not in the values used the same app?

When I have time I'll post a screenshot to show the differences.

2 |3000

Up to 8 attachments (including images) can be used with a maximum of 190.8 MiB each and 286.6 MiB total.

multivictor avatar image
multivictor answered ·

The sreenshot with the data:

data-system-overview.jpg

data-consumption.jpg

data-solar.jpg


2 comments
2 |3000

Up to 8 attachments (including images) can be used with a maximum of 190.8 MiB each and 286.6 MiB total.

multivictor avatar image multivictor commented ·

System overview From Grid = 190 kWh
Comsunption From Grid = 165 kWh
25 kWh difference

System overview To Grid = 37 kWh
Solar To Grid = 29 kWh
8 kWh difference


0 Likes 0 ·
Alexandra avatar image Alexandra ♦ commented ·

@MultiVictor

Right now i have an idea what you are talking about. I dont think it is a meter issue now.

System overview has the entire system totals.

Solar is only dealing with where your produced only power went. The 8kwh difference comes from the loads side, may be back emf stuff from loads like pumps switching off or LOM tests.

Consumption refers to where the loads are in the system and only the power related to that.

Notice the consumption total for overview and consumption are the same 484kwh. So the difference is an allocation from different sources.

You will also have 'losses' in the system. I use it in quotations loosly as some is heat noise wiring inefficiencies or power factor things possibly. Each set up is different and yours by far is one of the better ones I have seen.

0 Likes 0 ·
multivictor avatar image
multivictor answered ·

@Alexandra : I found the answer in the "VRM/Advanced/Download/Download kWh.xls.

The VRM dashboard doesn't shows all the correct data. It only has a limited number of digits and therefore the total is a round of.

On the dashboard "Consumption" tab the "From Grid" value is the value that goes directly to the AC loads.

On the dashboard "System overview" tab the "From Grid" value is the sum of the value "From Grid" and "Grid to battery".

Apparently the battery is constantly consuming energy form the grid.

pv-battery-grid-ac-data.jpg


2 comments
2 |3000

Up to 8 attachments (including images) can be used with a maximum of 190.8 MiB each and 286.6 MiB total.

Alexandra avatar image Alexandra ♦ commented ·
@MultiVictor

The rounding makes sense. The dash is mostly a broader overview. Also glad you took the time to understand your system more about the system.

0 Likes 0 ·
multivictor avatar image multivictor Alexandra ♦ commented ·
Indeed. It makes sense if you know what's behind.


But - my tought - it make a lot more sense if there are in one dashoard two tabs with the same valuename, give each a different name. Than it is clear for everybody that they represent a different value. Not everybody has time nor the motivation to dig deeper inta a system. Even my Victron certified installer was not aware of this (I asked them the question first).

Ik keep al my energydata of the last ten years in a personal xls.

With the VRM dashboard my expectation was that I no longer needed that because all data pop ups in the VRM dashboard.

Seems - I want correct data - I have to go on with collecting data in an xls file. :-)

On the positive side, in my search for the answer I got to know the Victron community. :-)

0 Likes 0 ·