question

mauromartini avatar image
mauromartini asked

Graph readings

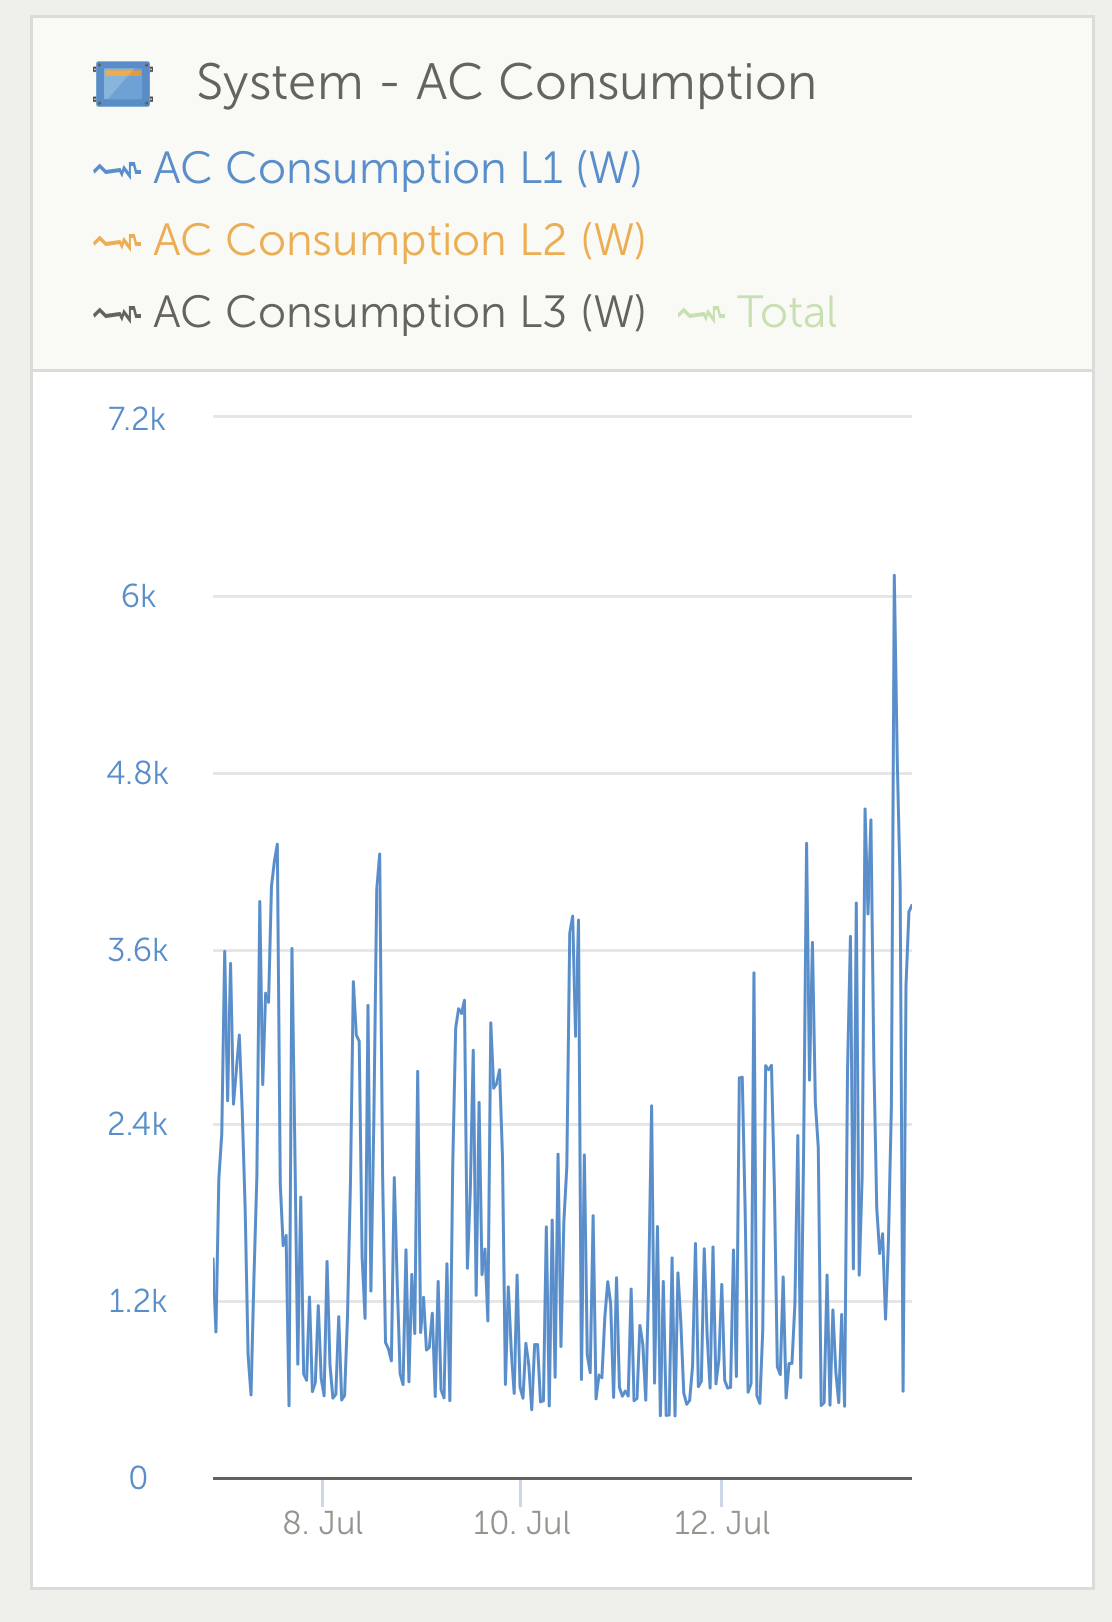
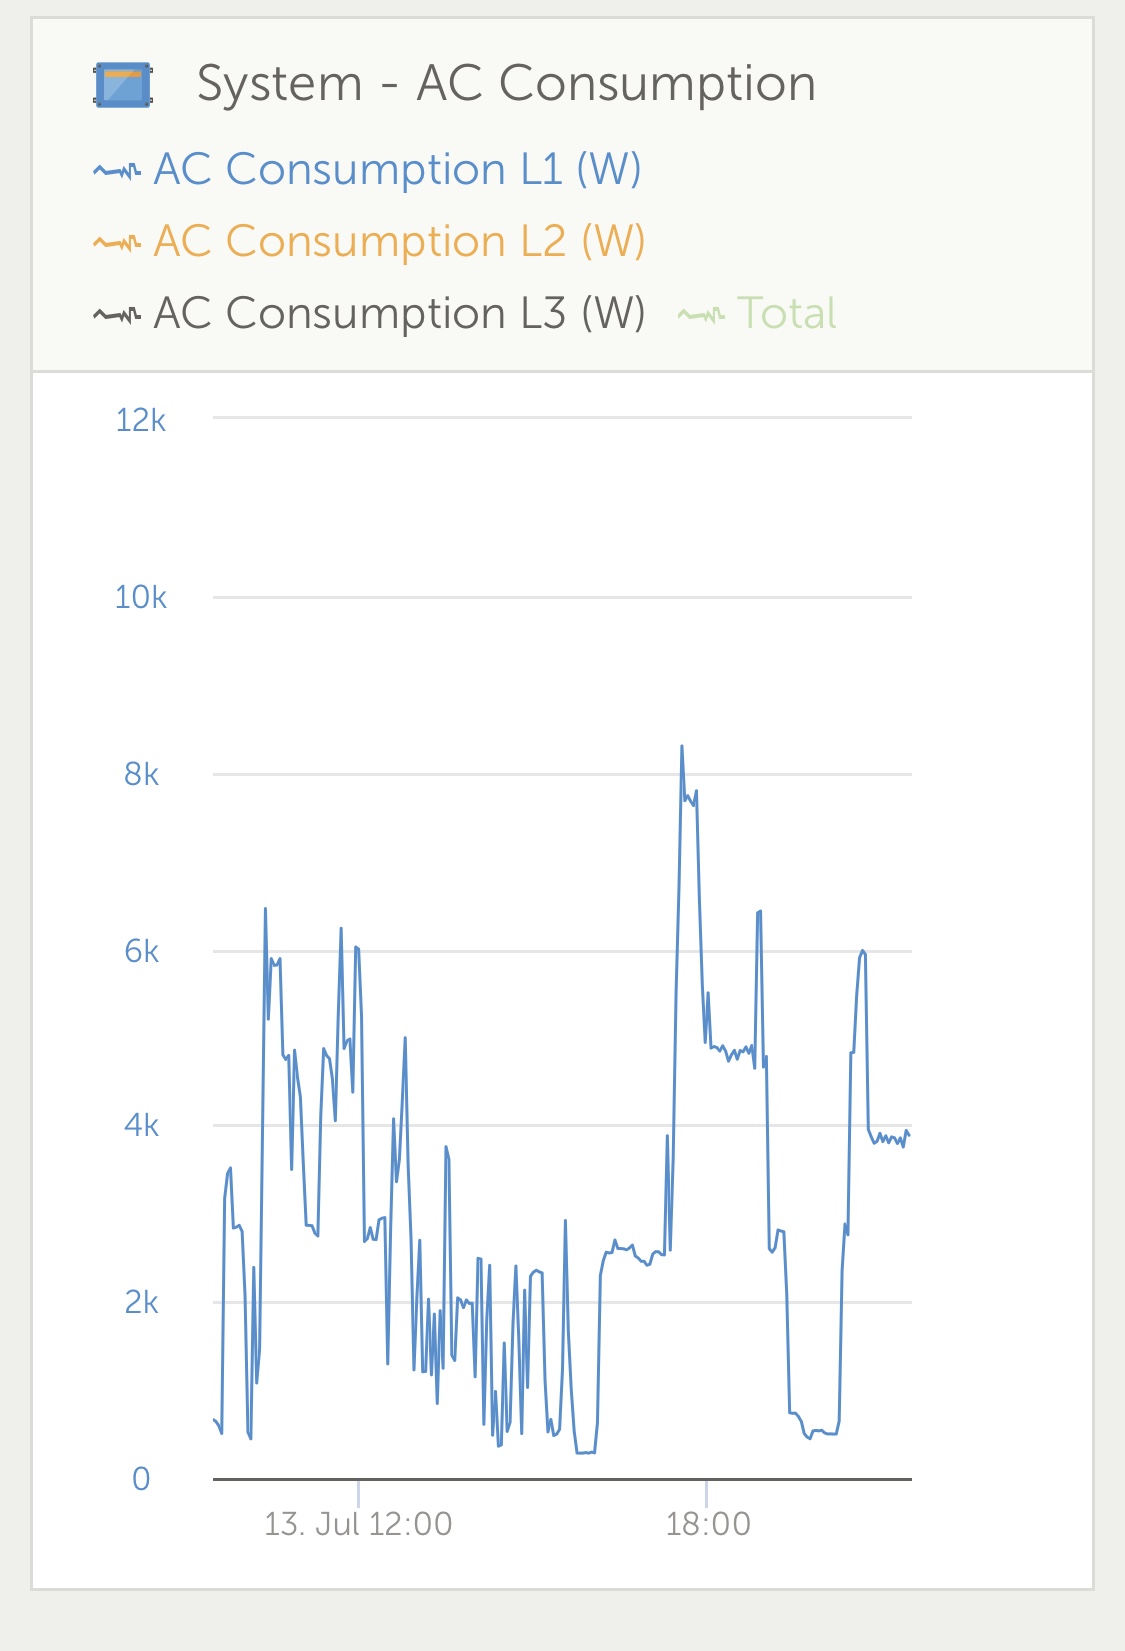
Hi guys. I have been looking a my consumption graphs and for example if I look at AC Consumption 12 hours vs 7 days (looking at same date as time) the 12 hours shows a max consumption of +- 8200w vs about 6100w for the 7 days at . Why is this? Logic would tell me a graph should at least show the min and max even if it cannot reasonably display all data.

Thanks


@warwick

VRM
2 |3000

Up to 8 attachments (including images) can be used with a maximum of 190.8 MiB each and 286.6 MiB total.

1 Answer
Warwick Bruce Chapman avatar image
Warwick Bruce Chapman answered ·
2 |3000

Up to 8 attachments (including images) can be used with a maximum of 190.8 MiB each and 286.6 MiB total.