I beleive I am having some issues with my fridge. I would like to plot the temperatures on a graph much like the solar is tracked so I have data oveer a period of days or weeks to see when the fridge is fluctuating. It currently goes from 1c to 8c, seems to stop working for 4 to 6 hours judging by the AC loads.
asked
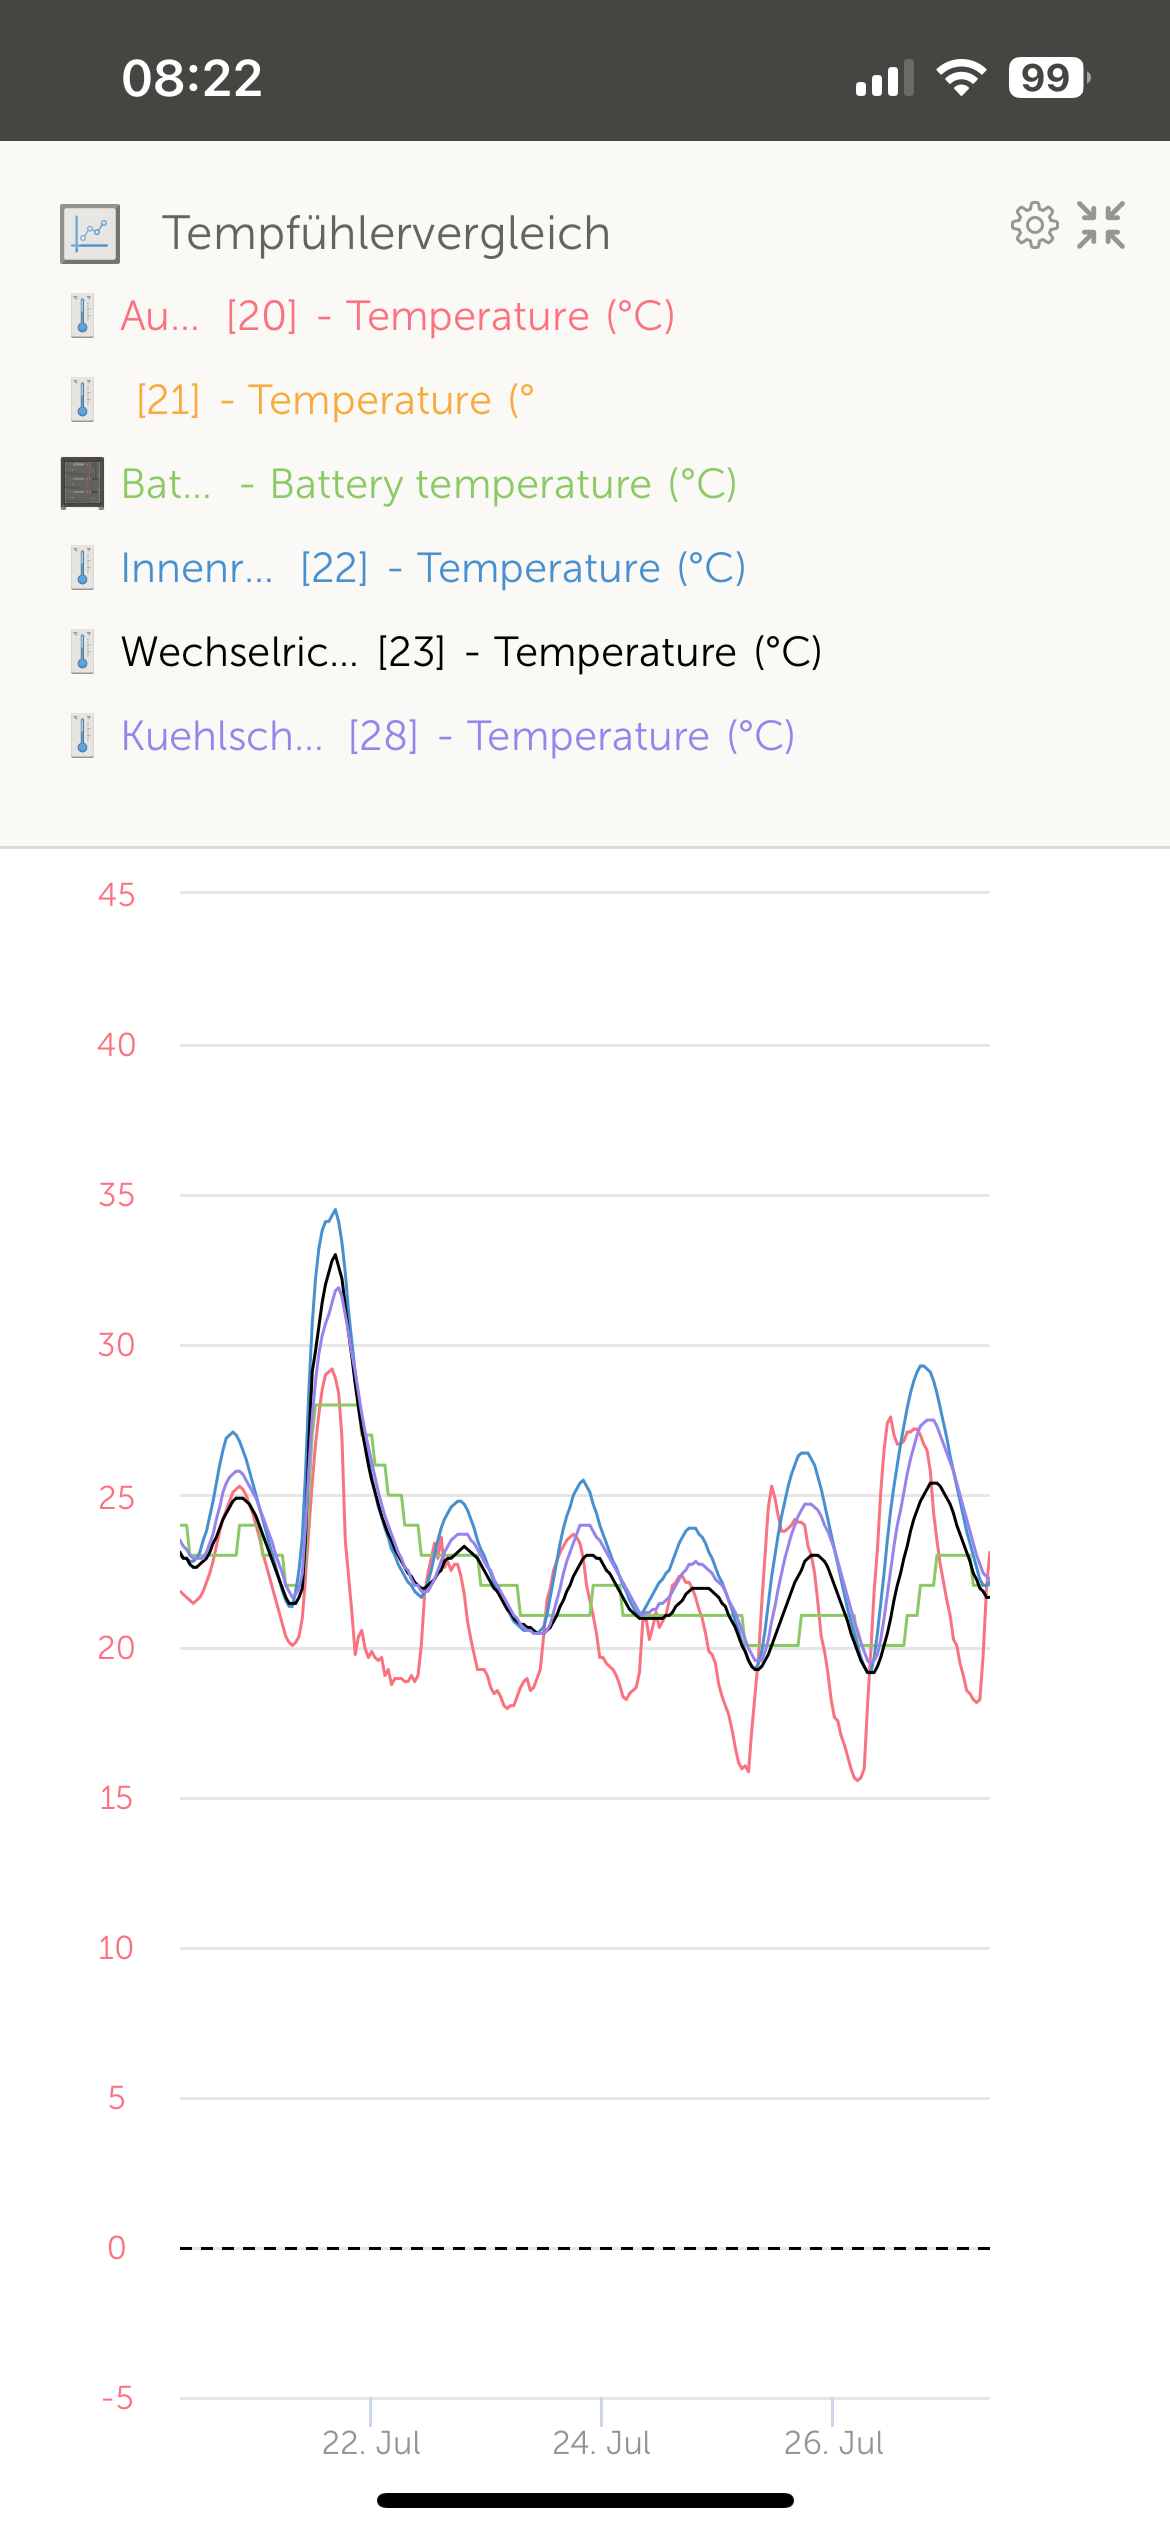
Is there a way to plot the RUUVI temperatures in VRM so I have a history
As long as the Ruuvi is connected to a GX device then yes you can in the advanced tab, I plot my Ruuvi sensor. You can also view history in the Ruuvi app on your phone but need to be in Bluetooth range.
yes, also the other values like humidity, the sensors produce