question

Guy Stewart (Victron Community Manager) avatar image

VRM solar production forecast - now live

EDITED to UPDATE - this feature is now live.

All the questions we received should now be answered here in this Victron Blog article - https://www.victronenergy.com/blog/2023/07/05/new-vrm-solar-production-forecast-feature/

Thanks to all those who contributed to the public testing stage.

VRM
6 comments
2 |3000

Up to 8 attachments (including images) can be used with a maximum of 190.8 MiB each and 286.6 MiB total.

Paul B avatar image Paul B commented ·
Very Nice Like it
2 Likes 2 ·
teloth avatar image teloth commented ·

Whilst I appreciate the forecast data comes externally from Solcast and " prediction " of UK weather can be tricky , I quite often get days where the forecast vs actual produced figures are way off.

If it is a very obvious not a cloud in the sky type of weather next few days , confirmed by your usual other weather forecast sources as well , sure , forecast from Solcast and in VRM pretty much spot on.

However , throw some cloudy / rainy type weather in , figures are just not right. In my experience, usual difference around 30% - 40% out on forecast vs actual.

Yesterday was a record , 22.4 kWh forecasted vs 10 kWh actually produced.

Possible to keep the forecasted figures on each day ( figure thats showing before the solar production begins for the day ) in VRM , so we can actually compare and assess suitability to use this feature for charging algorithms etc. over a period of time ?


Victron's implementation is fantastic , but I guess feature is only as good as the data source.

Please find attached figures from yesterday on VRM.


actual-5-aug-2023.png forecast-5-aug-2023.png


0 Likes 0 ·
dune7 avatar image dune7 commented ·
Enjoying the forecast. Hoping to further integrate into Home Assistant to program for Octopus Flux night time battery charging for winter months. Different topic: Would love someone to create an easy HA integration for Multiplus/Cerbo monitoring/ESS.

For interest, can there be a way to see when actual solar overshoots predicted solar as you can with undershot predictions? Same with usage perhaps but solar would be key. Love that we can turn off the graphs with the Key: icons. Thanks to a great team of Engineers.

0 Likes 0 ·
jimf909 avatar image jimf909 commented ·

Hello, I'm not having any luck seeing a forecast on the dashboard for today. I do get a forecast for future days on the dashboard and the widget on the advanced page. What needs to be done to have the forecast for the balance of today manifest on the dashboard? Thank you.

Today: no forecast for the balance of today.

img-0874.png


Future days: forecast is displayed.

img-0877.jpeg

img-0875.jpeg

img-0876.jpeg


0 Likes 0 ·
img-0874.png (263.5 KiB)
img-0875.jpeg (297.1 KiB)
img-0876.jpeg (332.0 KiB)
img-0877.jpeg (750.5 KiB)
Guy Stewart (Victron Community Manager) avatar image Guy Stewart (Victron Community Manager) ♦♦ jimf909 commented ·
Hi @jimf909

Can you confirm that this has now been resolved?

0 Likes 0 ·
stephanoffice avatar image stephanoffice commented ·

Dear Victron


I use dynamic ess. Everything is working fine except the forecast button is not visable at all in dashboard. Tomorrow and other future days are also empty. My dynamic ess dashboard do also not have a working forecast view. The dynamic ess algoritm is working fine.

My location is set. In cant find anywhere what to do. Do you have a solution?

Greetings

0 Likes 0 ·
33 Answers
kocki avatar image
kocki answered ·

@Guy Stewart (Victron Community Manager) & @Damionjr,

3 hours after removing the GPS mouse and setting the position manually, I got the VRM solar production forecast back:

17.jpg

That's nice,


but:

My installation is on a sailing boat, so now I can't use the GPS functionallity in the VRM portal like geofence and Download the GPS tracks:
18.jpg

Please, can you make it possible that this 2 functionallity are working both at the same time?

This would be great.

Regards,

Gerd


17.jpg (62.5 KiB)
18.jpg (29.2 KiB)
2 |3000

Up to 8 attachments (including images) can be used with a maximum of 190.8 MiB each and 286.6 MiB total.

andre67 avatar image
andre67 answered ·

Hi, thank you so much ; I am testing... wait & see for feedback

1 comment
2 |3000

Up to 8 attachments (including images) can be used with a maximum of 190.8 MiB each and 286.6 MiB total.

andre67 avatar image andre67 commented ·

solarforecast-comments-rg.png
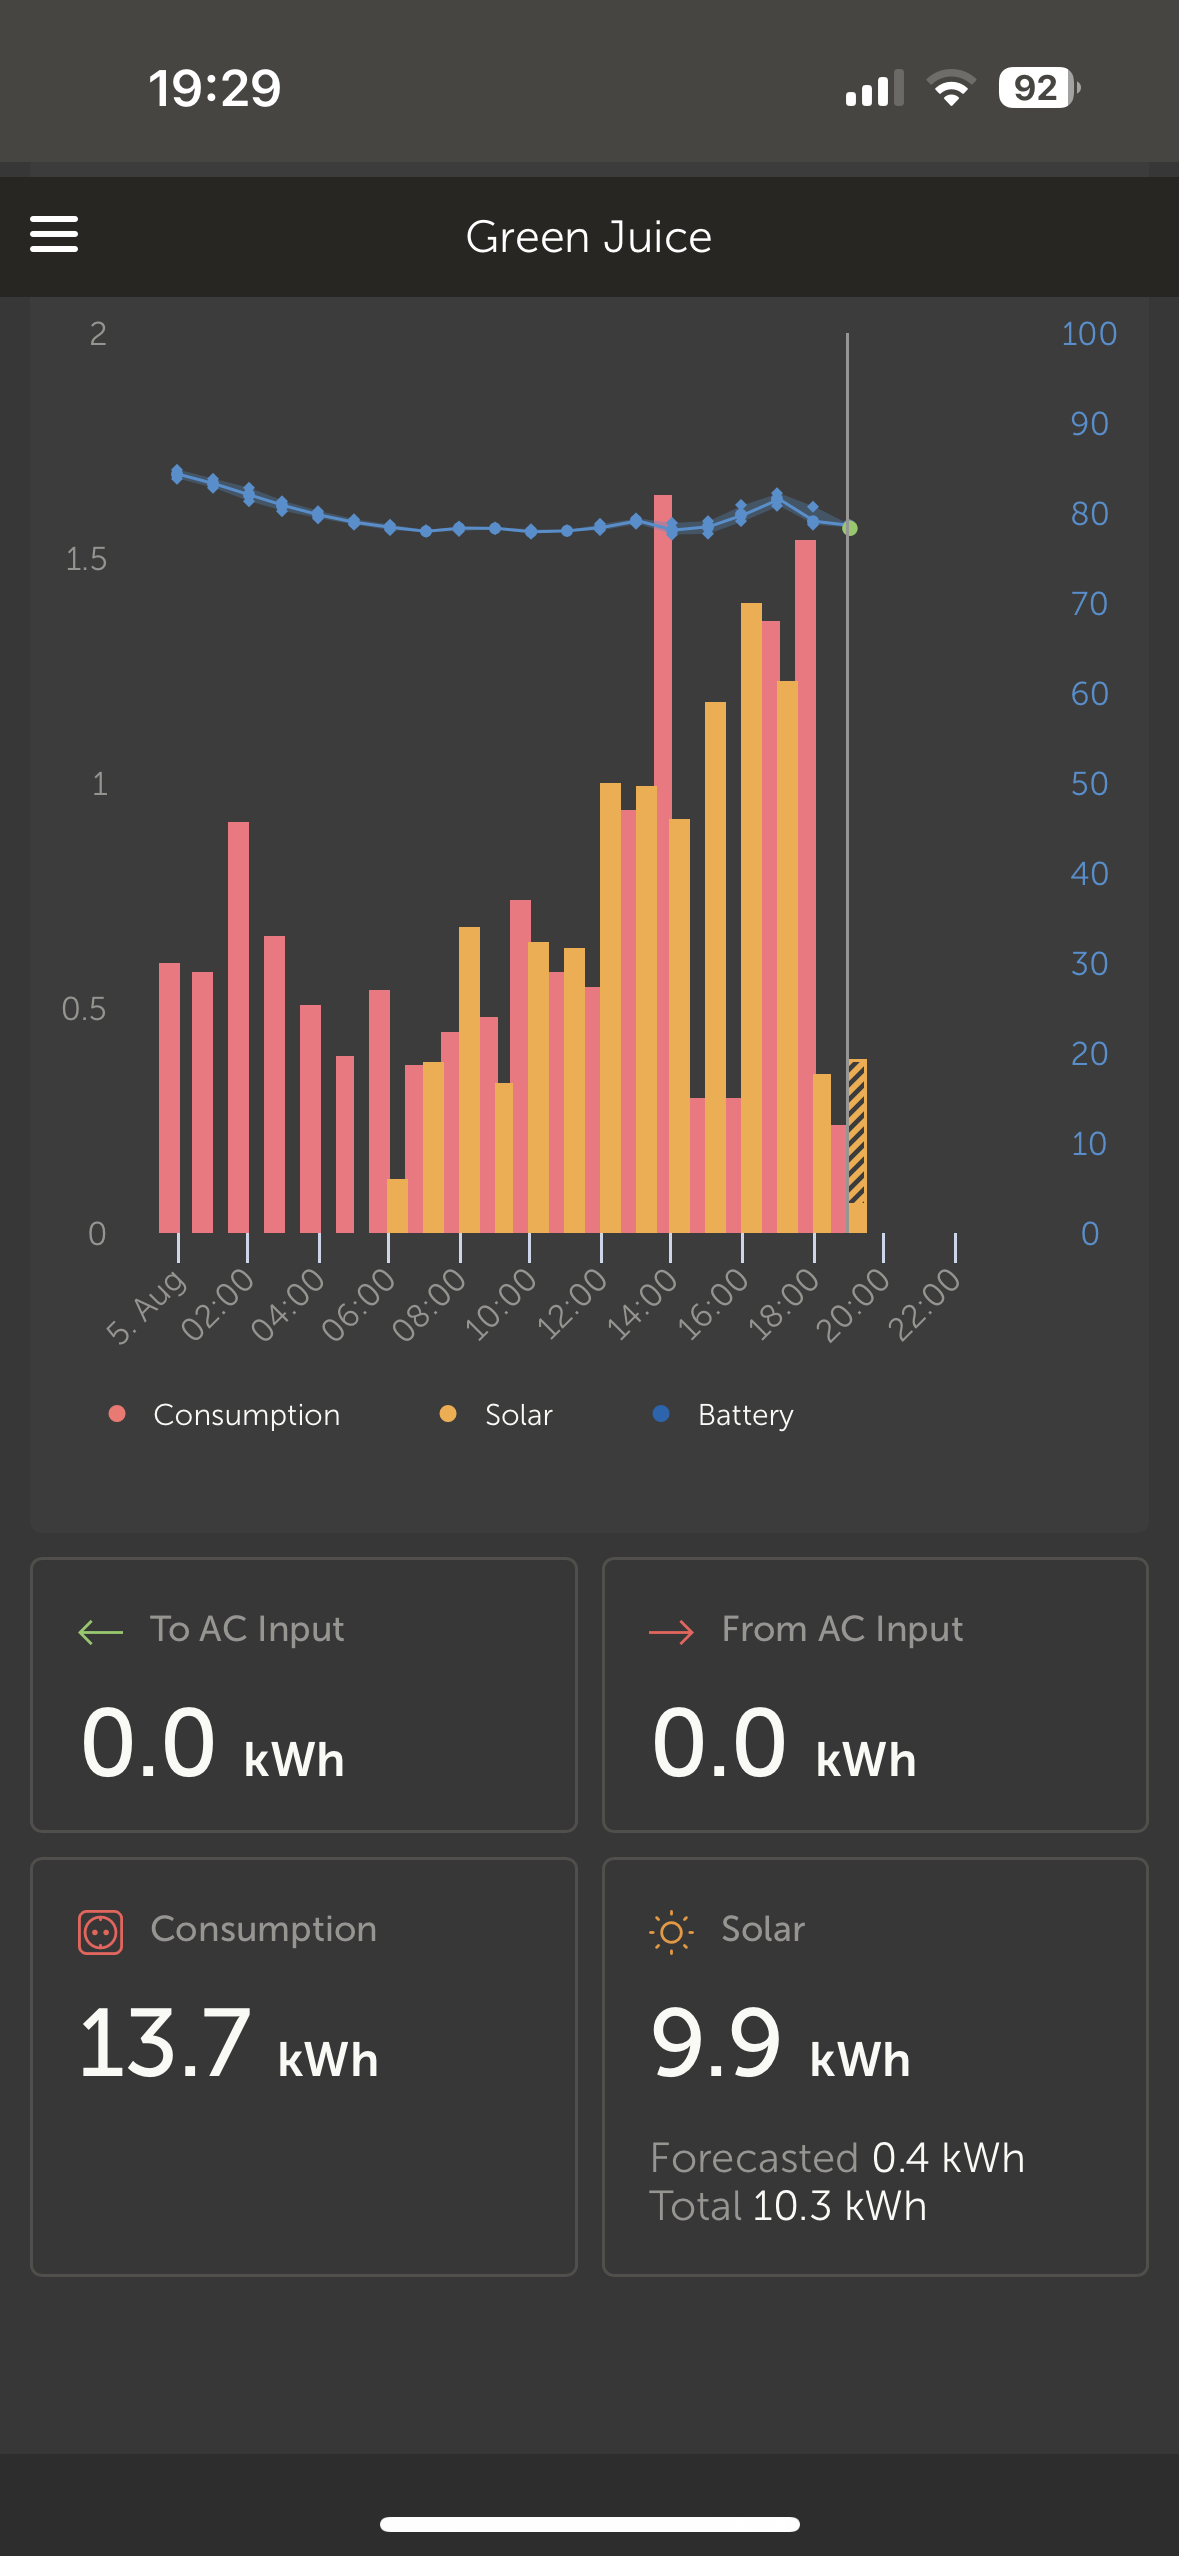
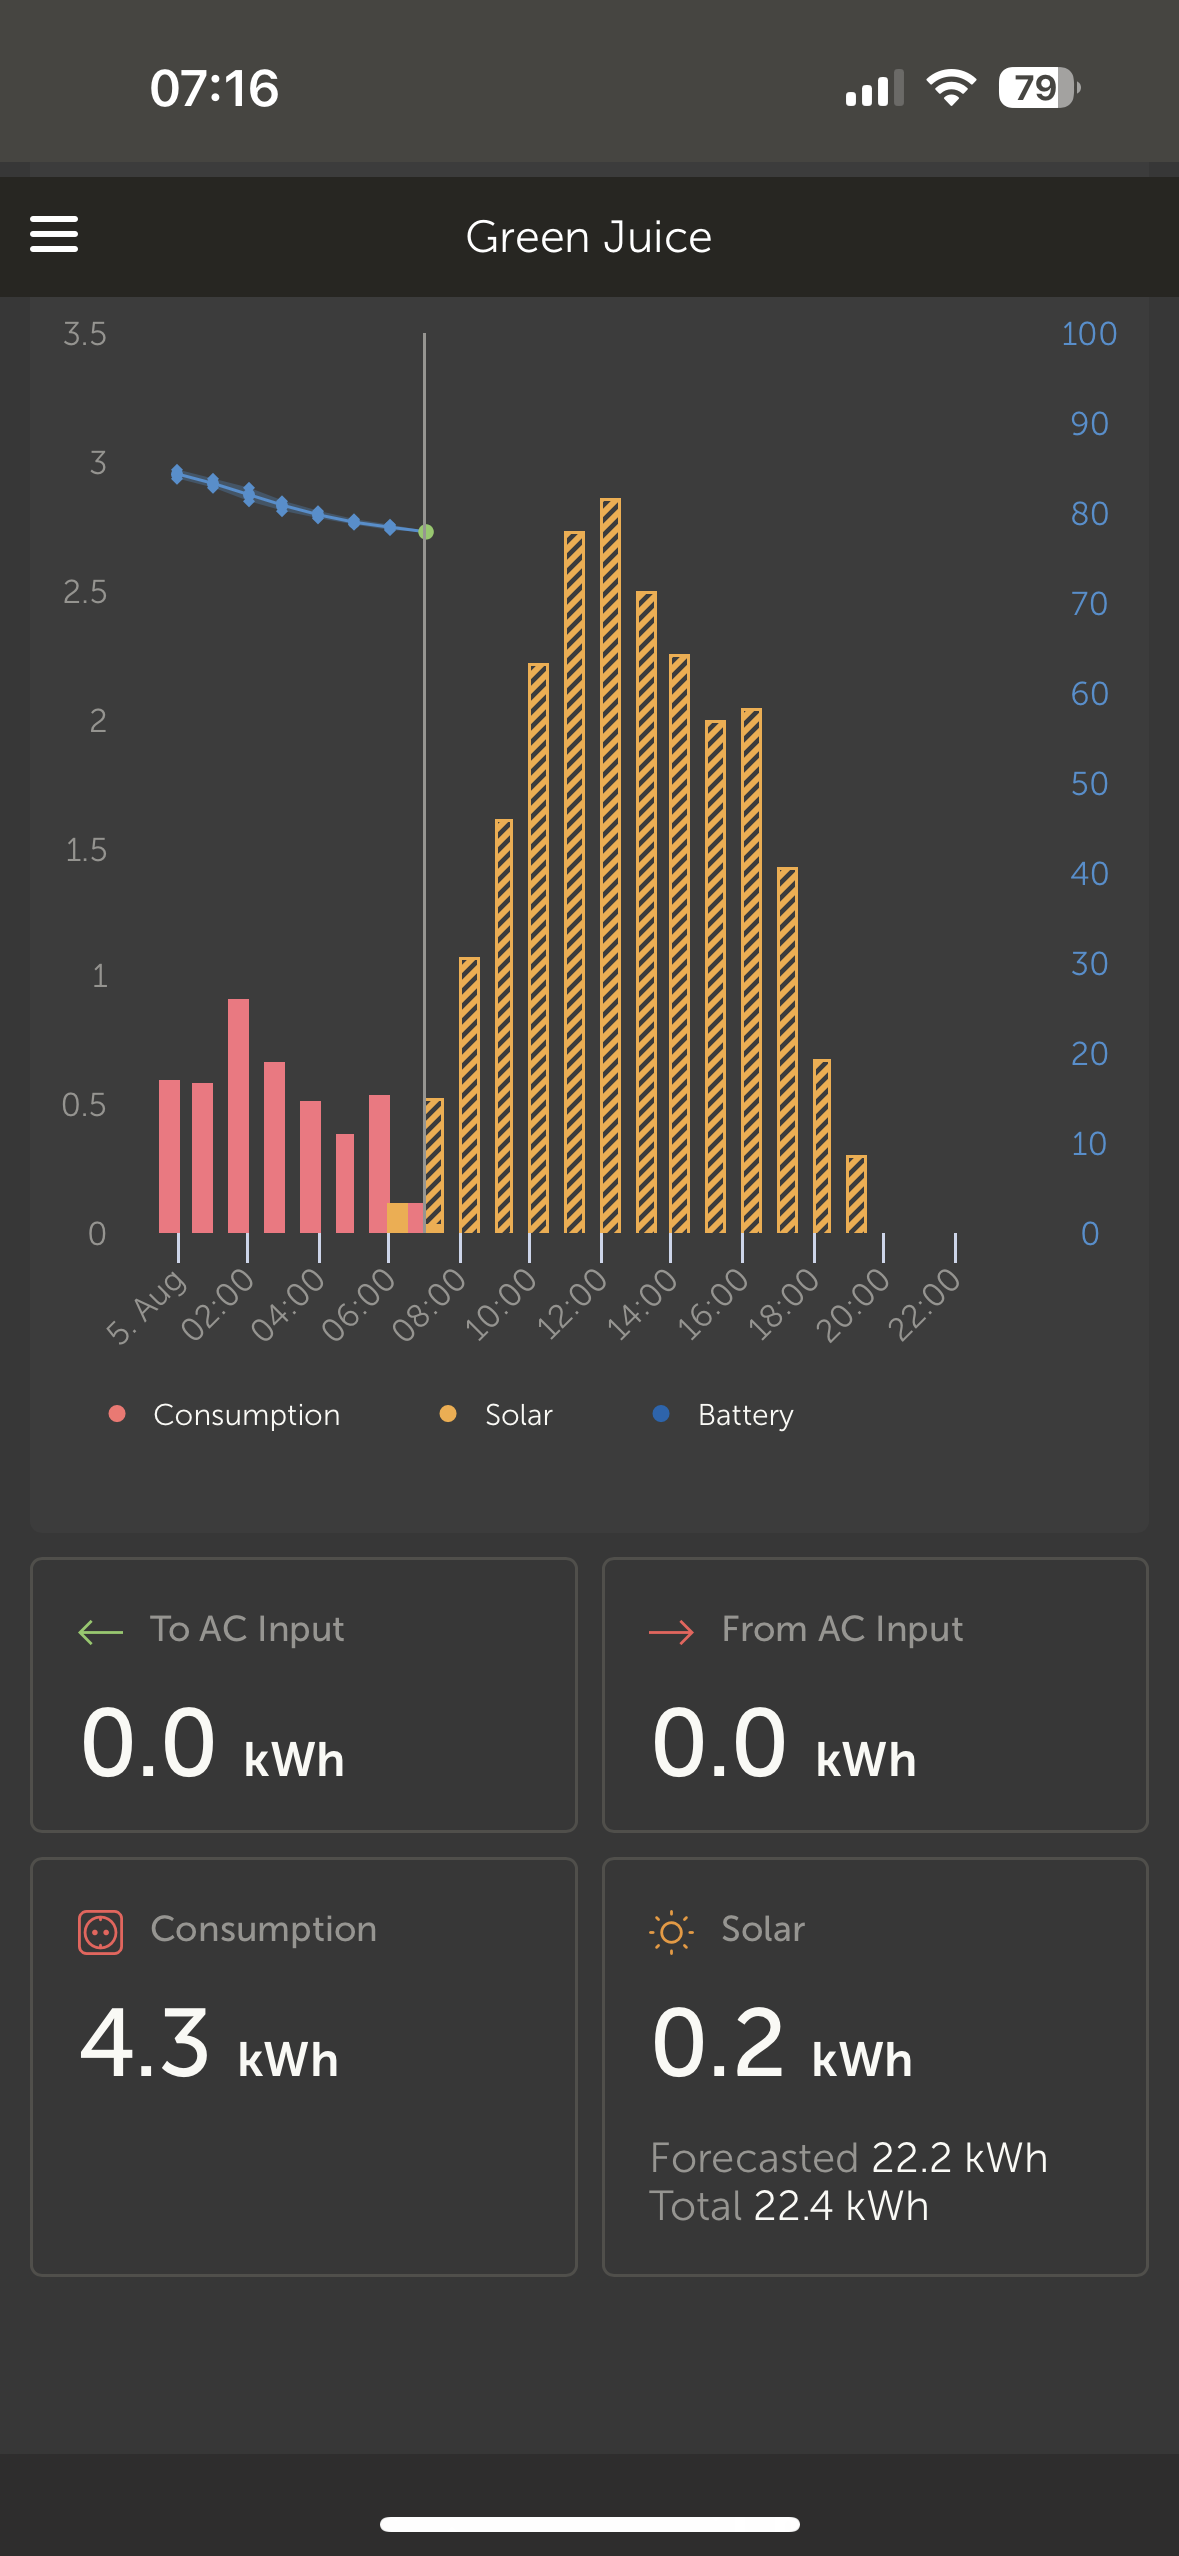
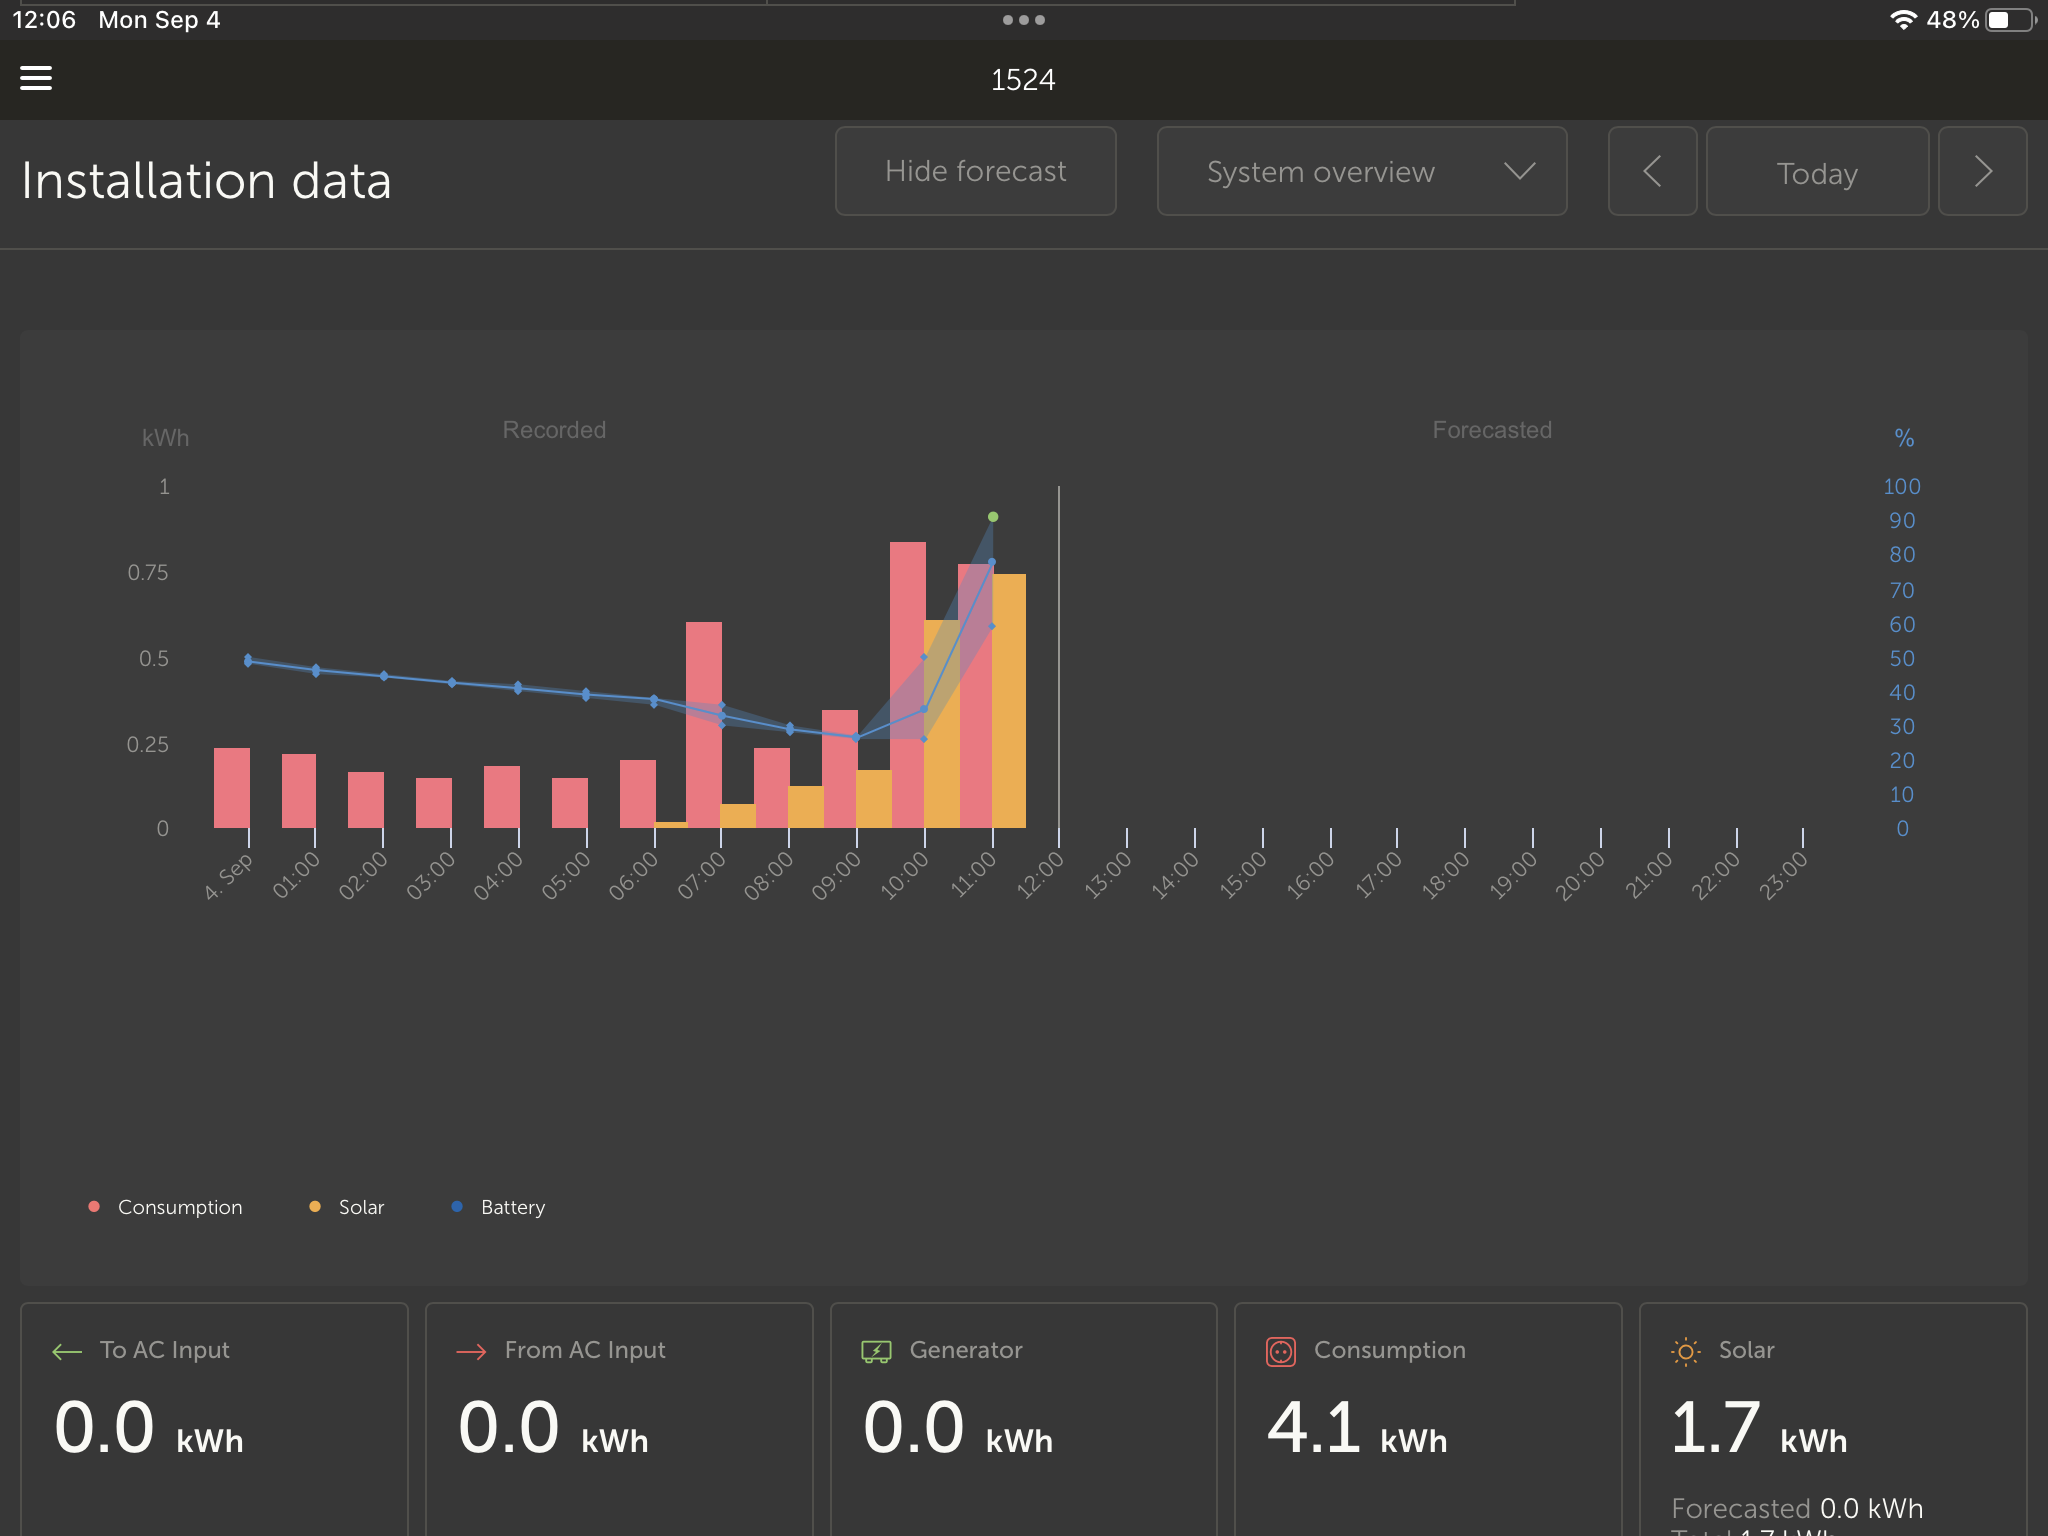
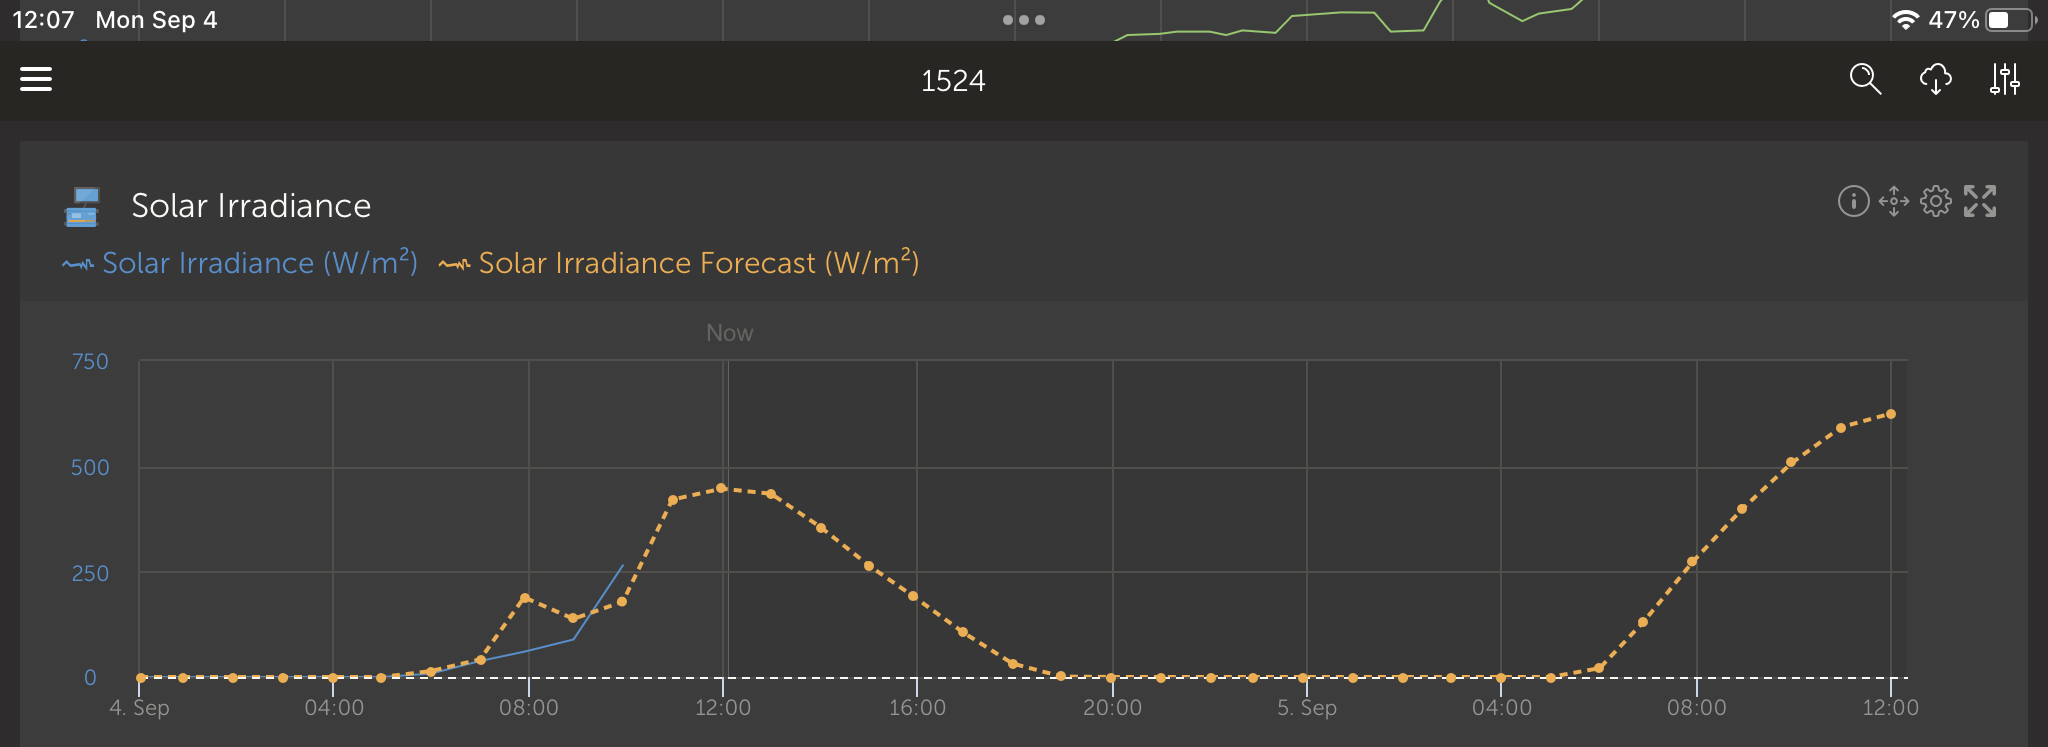
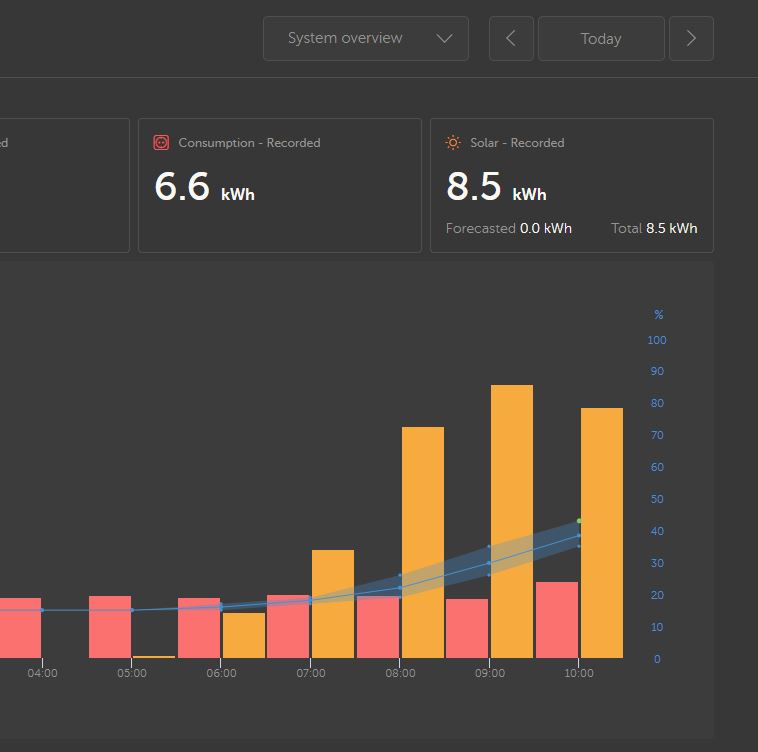
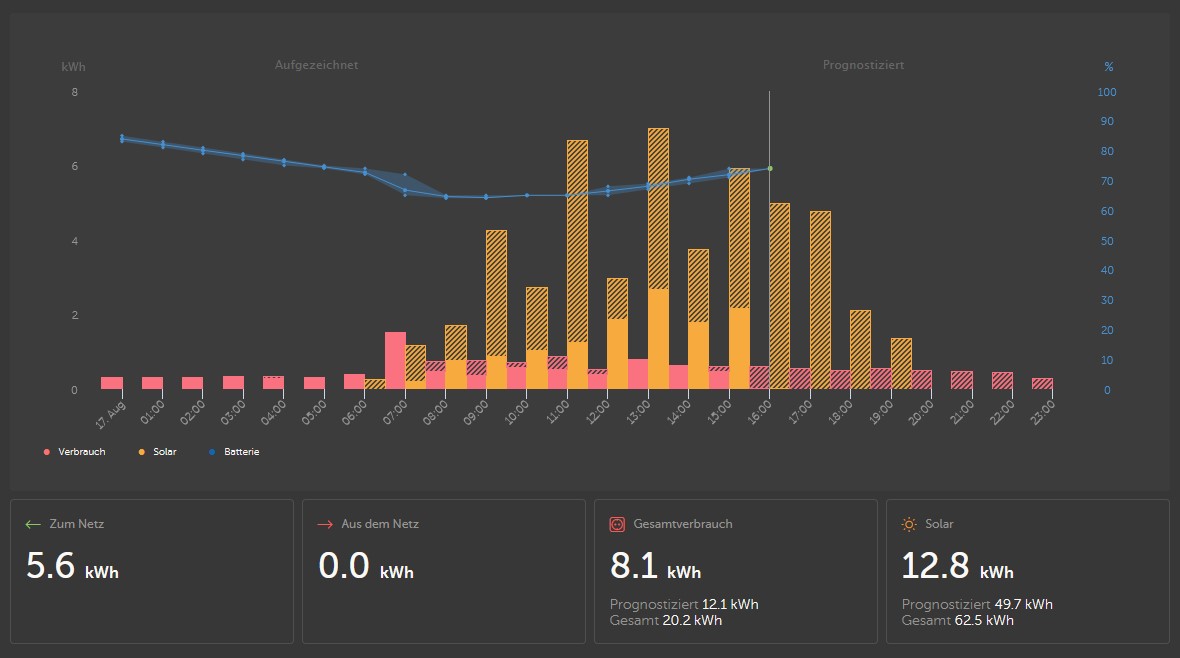
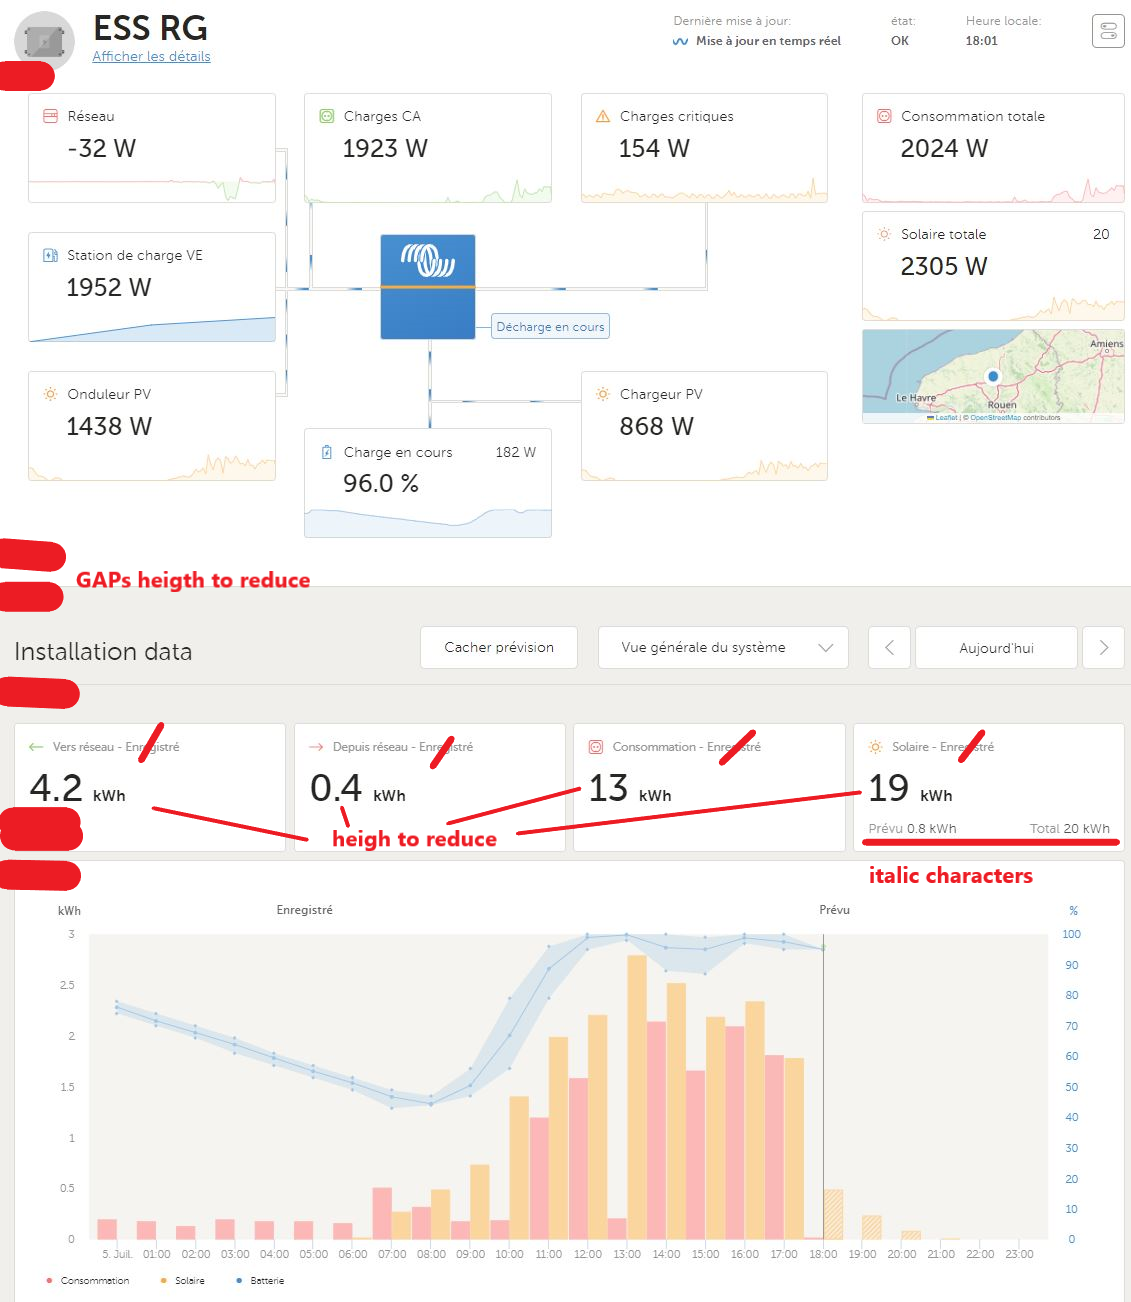
During these few days (from 01/07 to 05/07), I have tested the beta version for the VRM solar forecast.
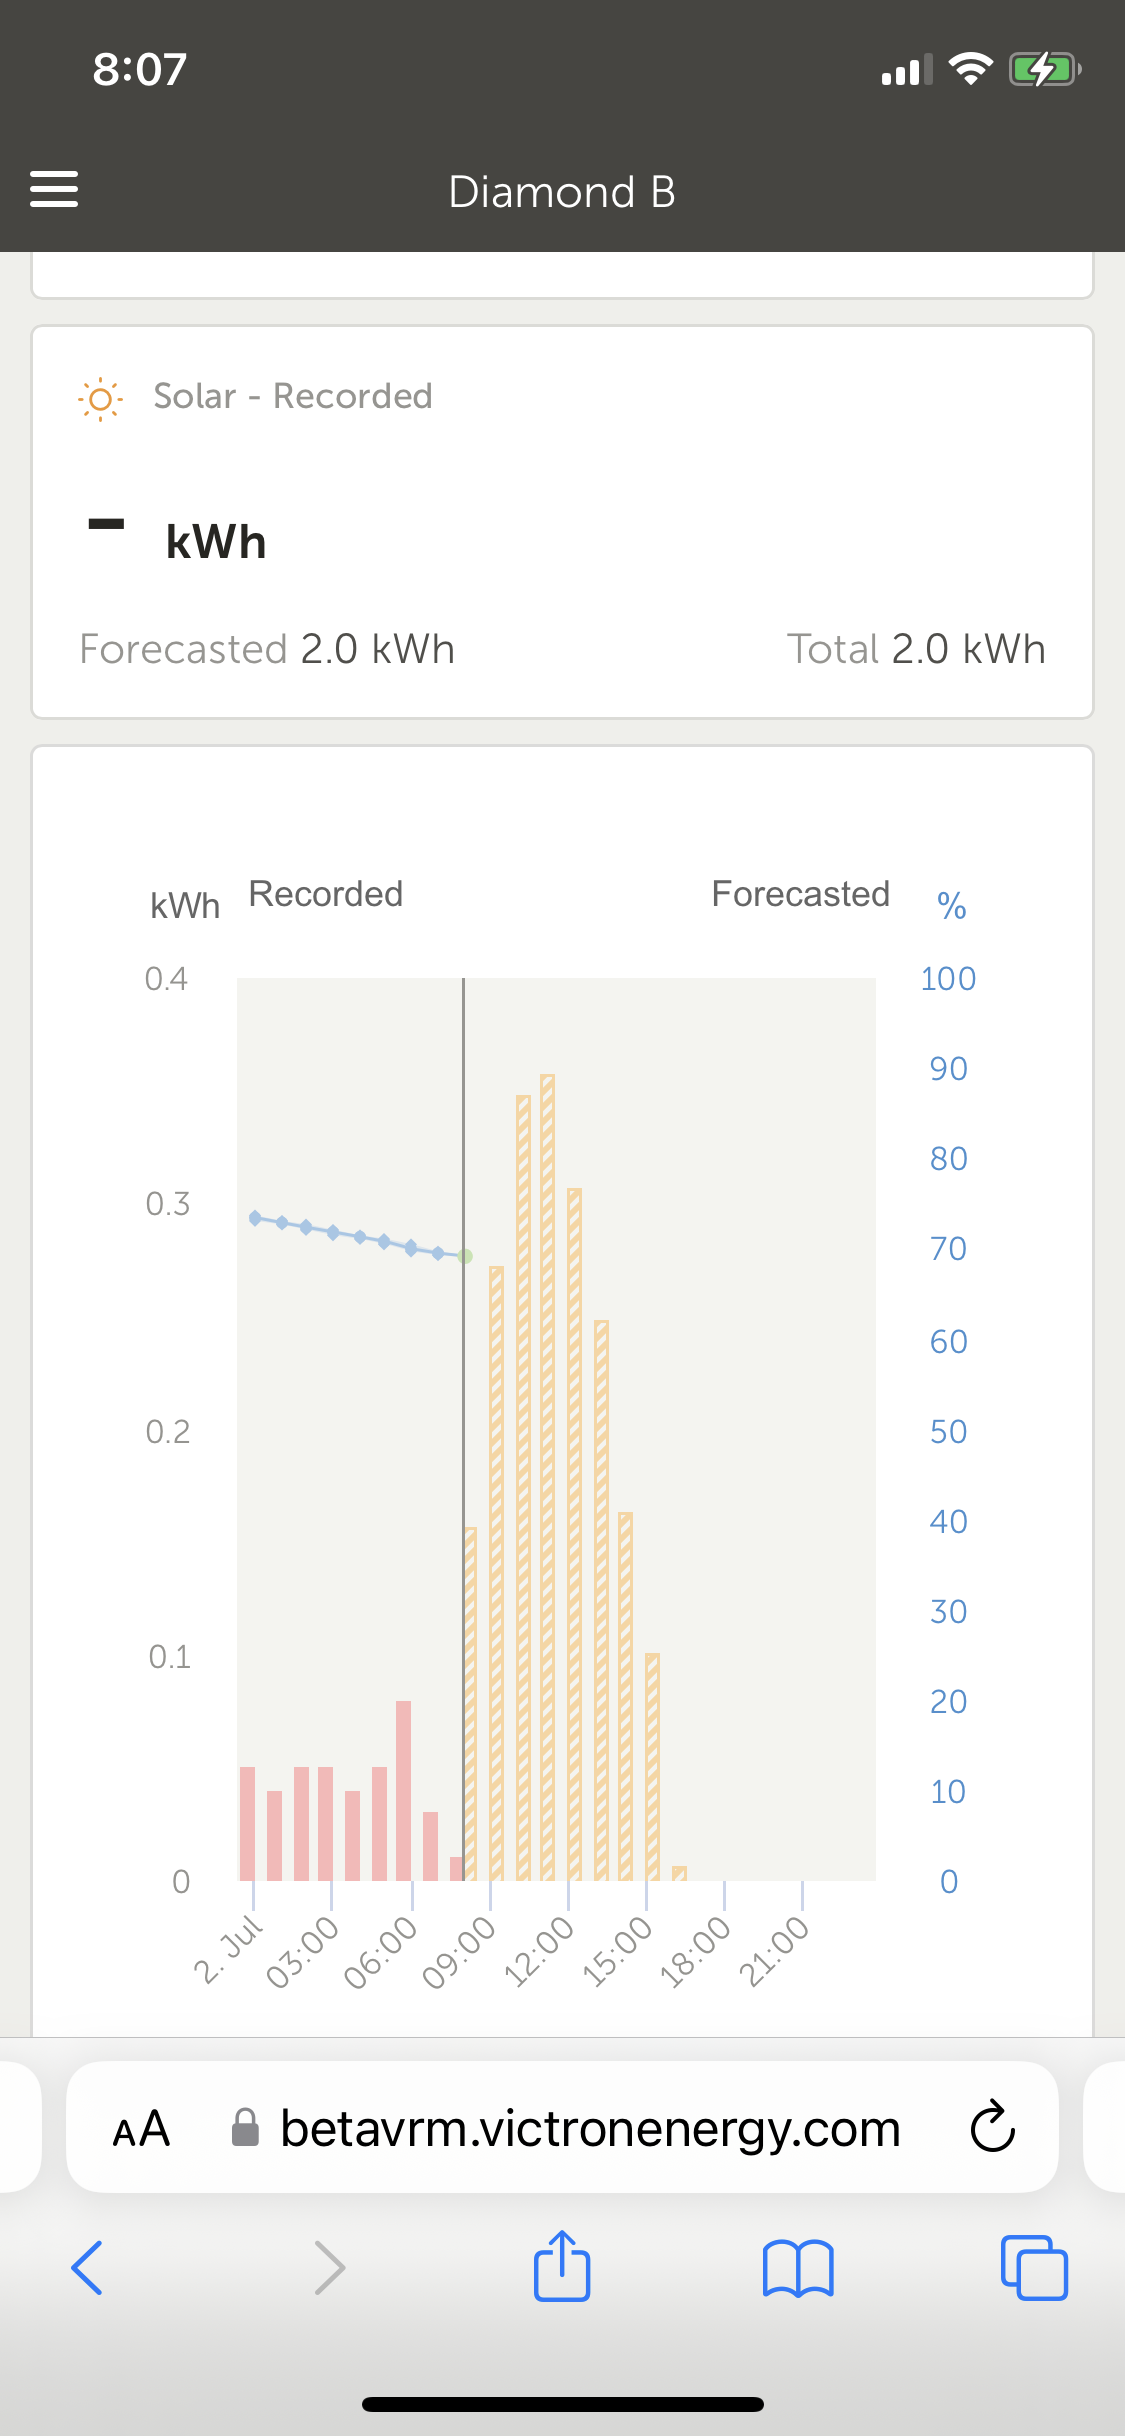
Please find hereafter my comments and the recorded data (if you need I can send you all screen shots with timestamp) :

1-Layout

- Could you please show smaler numbers for the 4 items : To Grid, From Grid, Consumption, Solar ?

Please use same heigth as main items above GRID, LOADS, INVERTER, ....

- Could you also reduce space of the gaps as shown on picture ?

In order to have all information on the screen, without having to roll down and up.


2-Content

- No need to write "recorded" 4 times. Please remove "recorded"

- just write "Forecast" and "Total" using italic characters : "Forecast" and "Total"


3-Accuracy

- I noticed that every hour at hh:01 forecast is updated. Could you please update the numbers at hh:00 ? or better at hh-1:59 ? In order that users who check will use good numbers at hh:00 ; bacause actualy the numbers at hh:00 are changed at hh:01.

- accuracy is better than forecast that I receive on my Home Assistant with the integration= Forecast.Solar. Gapsolar forecast records RG.txt = between 2 and 3 times less for Victron = VERY GOOD for Victron VRM Solar Forecast


4-New Wish

- could you add the solar forecast for Tomorrow ; this will be usefull for users in order for them to manage loads and battery, by anticipating the next day weather

THANKS IN ADVANCE

0 Likes 0 ·
kladz avatar image
kladz answered ·

Amazing feature !

Then you can add an option to set a low SOC battery limit depending on the solar kWh forecast ?

Blue Power Best !

2 |3000

Up to 8 attachments (including images) can be used with a maximum of 190.8 MiB each and 286.6 MiB total.

Sarah avatar image
Sarah answered ·

A great new feature ! It will be interesting to see how it copes with being on a boat at anchor and the shifting wind conditions that can change the orientation of the panels to the sun.

4 comments
2 |3000

Up to 8 attachments (including images) can be used with a maximum of 190.8 MiB each and 286.6 MiB total.

Matthias Lange - DE avatar image Matthias Lange - DE ♦ commented ·
As far as I understand the forecast is based on the location, weather (currently and forecast) and the past production at similar weather.

If you change the location, the orientation or the shading than the forecast will be wrong or at last not very accurate.

3 Likes 3 ·
nickdb avatar image nickdb ♦♦ Matthias Lange - DE ♦ commented ·

There is some machine learning involved to determine the production from expected irradiance. If Panel orientation keeps changing, let alone location, I would not expect overly accurate forecasts.

That said, if it is moored in the same spot and orientates to prevailing winds, which tend to be fairly consistent, then perhaps the results might be better than expected.

1 Like 1 ·
Sarah avatar image Sarah commented ·

Looking good so far - we are mid winter in Sydney so 2kw is probably about right. Wind is a consistent southerly so boat panels will be in full sun.

0 Likes 0 ·
img-8219.png (530.4 KiB)
Sarah avatar image Sarah Sarah commented ·
So at the end of day one - 2.8 kw actual versus a 2kw projected. Biggest difference on the boat being changes in wind direction today which moved the panels to a more favourable direction for solar power. As far as boats are concerned it is probably useful data but maybe nothing of huge consequence (not denying the huge potential for ESS based environments which could be a game changer !!!)
1 Like 1 ·
nesswill avatar image
nesswill answered ·

One word

Fantastic!

thank you.

Ok i know that was three words:)

Working well with my RS 450/100s.

2 |3000

Up to 8 attachments (including images) can be used with a maximum of 190.8 MiB each and 286.6 MiB total.

fellside avatar image
fellside answered ·

Working well here. Using SMA inverter via ET112. No mppt`s fitted.

Will the algorithm be extended to forecast to the next day in future. That will be very useful.

1 comment
2 |3000

Up to 8 attachments (including images) can be used with a maximum of 190.8 MiB each and 286.6 MiB total.

Barbara (Victron Energy) avatar image Barbara (Victron Energy) ♦ commented ·
We will extend the forecast to more time into the future after the initial rollout!
2 Likes 2 ·
ojack avatar image
ojack answered ·

Nice feature.

Is this your start in developing pv forecast depending controls? Like:

- feed in control to cut off noonday feed in peeks?

- advanced Battery life controlling SoC based on pv forecast

- loading battery from grid at night (when grid power is cheap) when pv forecast for the following day ist too small

2 comments
2 |3000

Up to 8 attachments (including images) can be used with a maximum of 190.8 MiB each and 286.6 MiB total.

Barbara (Victron Energy) avatar image Barbara (Victron Energy) ♦ commented ·
You guessed that right :-)
3 Likes 3 ·
ojack avatar image ojack Barbara (Victron Energy) ♦ commented ·
Great, I would be happy to beta-test it next winter ;-)
0 Likes 0 ·
peregrines avatar image
peregrines answered ·

Hi! That is a fantastic new feature :) Thank You!

I have a question regarding multiple Solar Arrays in one system.


I am using:

2 x Rs 450/100

2 x Fronius

3 x Hoymiles

Can I expect my system to receive accurate data in the future?
Or will the Fronius and Hoymiles be "greyed out" ?

2 comments
2 |3000

Up to 8 attachments (including images) can be used with a maximum of 190.8 MiB each and 286.6 MiB total.

I am not sure about the Hoymiles compatibility, but the MPPT RS 450/100 and Fronius are now included in the estimate.


As long as the Hoymiles data is being recognised as solar data in VRM (via Sunspec or an energy meter) it should be ok as well.

1 Like 1 ·
jestron avatar image jestron commented ·
take a look at the ahoy-dtu combined with dbus-mqtt-devices (github is your friend). hoymiles will then show up as ordinary PV generators.
1 Like 1 ·
dansonamission avatar image
dansonamission answered ·

@Guy Stewart (Victron Community Manager) Noticed this a little while ago on beta VRM and got excited to see it but it always read 0 for the forecast, it still only reads 0.


Location has always been set and the site is over a year old. 169174

5 comments
2 |3000

Up to 8 attachments (including images) can be used with a maximum of 190.8 MiB each and 286.6 MiB total.

nickdb avatar image nickdb ♦♦ commented ·
What inverter is it? Remember RS is not supported.
0 Likes 0 ·
Barbara (Victron Energy) avatar image Barbara (Victron Energy) ♦ nickdb ♦♦ commented ·
I just checked but I can see the forecast for that installation. Note that you only see it for the hours between now and midnight, so if you check it after the sun is down it shows 0!
0 Likes 0 ·
dansonamission avatar image dansonamission Barbara (Victron Energy) ♦ commented ·

@Guy Stewart (Victron Community Manager) @Barbara (Victron Energy) so this worked yesterday but not today? The hide forecast button is there for a split second when the page loads then disappears.

nofc.jpg

0 Likes 0 ·
nofc.jpg (40.7 KiB)
Guy Stewart (Victron Community Manager) avatar image Guy Stewart (Victron Community Manager) ♦♦ dansonamission commented ·
Hi @dansonamission,

The feature is now being deployed to production - we expect once that is complete you should see the button again on the normal VRM site.

0 Likes 0 ·
dansonamission avatar image dansonamission Guy Stewart (Victron Community Manager) ♦♦ commented ·
Thanks!
0 Likes 0 ·
teloth avatar image
teloth answered ·

Very nice start to a potential great feature.

As others pointed out , forecast definitely needs to be extended to at least day ahead to decide and make use of cheaper electricity rates night before.

If logic algorittms can be set in Node Red too , based on SoC vs Next days forecast etc for charging , so this can be all automated based on users rules , well, that would make it 10/10 !!


1 comment
2 |3000

Up to 8 attachments (including images) can be used with a maximum of 190.8 MiB each and 286.6 MiB total.

Hi @Teloth,

I have just posted an update to the original post with more information about using this feature with Node-RED

0 Likes 0 ·
pedaaa avatar image
pedaaa answered ·

i just set my site location, but it does not work...

Is there a delay time, after setting the location for it to work?

On my brothers installation the forecast works right away, but he had set this location already months before.


(we are both using Multiplus II and MPPT RS450/100 and some PV-Inverters)

1 comment
2 |3000

Up to 8 attachments (including images) can be used with a maximum of 190.8 MiB each and 286.6 MiB total.

cacer avatar image cacer commented ·
yes, wait some hours.

i set the location yesterday. today i see forecast (also with rs450)

0 Likes 0 ·
ojack avatar image
ojack answered ·

There is an issue at the solar graphics. The colors are not matching.

1688371787487.png


1688371787487.png (102.0 KiB)
1 comment
2 |3000

Up to 8 attachments (including images) can be used with a maximum of 190.8 MiB each and 286.6 MiB total.

Thanks for reporting, I'll pass it on to the VRM team.
0 Likes 0 ·
Jaco Reinecke avatar image
Jaco Reinecke answered ·

Sorted ...

1 comment
2 |3000

Up to 8 attachments (including images) can be used with a maximum of 190.8 MiB each and 286.6 MiB total.

nickdb avatar image nickdb ♦♦ commented ·
Reload the page, should have a show forecast button in the same place.
0 Likes 0 ·
Mark Maritz avatar image
Mark Maritz answered ·

Brilliant innovation! Thanks

Suggestion: Leave the forecast PV in the graph historically so user can see forecast vs actual variations. That would be great!

1 comment
2 |3000

Up to 8 attachments (including images) can be used with a maximum of 190.8 MiB each and 286.6 MiB total.

ojack avatar image ojack commented ·

"That would be great!"

... and would lead to many useless discussions.... ;-)

1 Like 1 ·
hominidae avatar image
hominidae answered ·

...great Feature, thank you!

I am going to compare the forecast with my existing one from solcast, which is actually pretty precise, as it is also tuned with previous measurements.

Q: Can we also have a widget/view in the advanced view, mabe along the PV/Solar yield?

Here is an example from my solar yield + solcast forecast on a typical, not so cloudy day...love to see something like that in the advanced view section in VRM.


1688416891563.png


...keep up the good work!

regards,

hominidae


1688416891563.png (143.6 KiB)
4 comments
2 |3000

Up to 8 attachments (including images) can be used with a maximum of 190.8 MiB each and 286.6 MiB total.

Hi @Hominidae,

More advanced widgets using this data will be available in the future.

2 Likes 2 ·
nickdb avatar image nickdb ♦♦ commented ·
There is an irradiance widget available under the GX options.
0 Likes 0 ·
hominidae avatar image hominidae nickdb ♦♦ commented ·

Yes, I've seen that, but what I'd prefer is a widget with forecasted/estimated PV-Power (W from the inverter/MPPT), as irradiance is W/square-meter.


0 Likes 0 ·
nickdb avatar image nickdb ♦♦ hominidae commented ·
This is an early beta, there will be enhancements made over time. The goal here is to check the basics, as is, works and works reliably.
0 Likes 0 ·
kladz avatar image
kladz answered ·

Forecast is down

2 comments
2 |3000

Up to 8 attachments (including images) can be used with a maximum of 190.8 MiB each and 286.6 MiB total.

Now deploying to production :)
2 Likes 2 ·
kladz avatar image kladz Guy Stewart (Victron Community Manager) ♦♦ commented ·
Wahouu
0 Likes 0 ·
semlohnhoj avatar image
semlohnhoj answered ·

This becomes useful to me (and I suspect a lot of other people with cheap overnight tariffs) when it includes predictions for tomorrow.

Also I have an RS, so support for that as well in my case would be handy although at present I'm using an external MPPT so that's not an issue for me yet (until I wire in the extra panels going on my garage roof).

Are there plans to add "tomorrow's forecast"?

2 comments
2 |3000

Up to 8 attachments (including images) can be used with a maximum of 190.8 MiB each and 286.6 MiB total.

semlohnhoj avatar image semlohnhoj commented ·

That said, superb stuff. Really like the feature and the prediction seems accurate so far.

0 Likes 0 ·

Hi @Semlohnhoj

from the soon to be published blog article;

"Testing is already well underway for how this new functionality can extended further, such as longer range forecasts..."


0 Likes 0 ·
Peter avatar image
Peter answered ·

1. Will Forecast be only to the end of day or for next 24h or to the end of next day?

2. Will forecast take into account any weather forecast?

1 comment
2 |3000

Up to 8 attachments (including images) can be used with a maximum of 190.8 MiB each and 286.6 MiB total.

1. for now forecast is only until the end of the day - we will extend it further in a future update

2. yes, the forecast takes into account weather via the solcast weather satellite and irradiance prediction service

0 Likes 0 ·
menneer avatar image
menneer answered ·

This is a fantastic idea. Problem is, my PV system was installed way before by Quattro. Is there a way to input the basic spec of my PV system so that it will show a forecast? (Obviously, it won't be able to monitor the actual production.)

Thanks.

2 |3000

Up to 8 attachments (including images) can be used with a maximum of 190.8 MiB each and 286.6 MiB total.

joshuadodds avatar image
joshuadodds answered ·

Hi!

Great feature! Have been looking for a reliable source for this data for some time and to have it "baked-in" now with Victron equipment is great.

Just one request that would make this data A LOT more useful to those of us with custom integrations and software working in concert with Victron equipment. Can we get this data from the solar projections published on the MQTT bus or available on the an accessible API endpoint somewhere so that we can periodically query this forecast data for other decisions we might want to make with advanced Dynamic ESS installations? Is this data already available somewhere and if so could someone point me where to find/query it ?

Thanks!

1 comment
2 |3000

Up to 8 attachments (including images) can be used with a maximum of 190.8 MiB each and 286.6 MiB total.

mvader (Victron Energy) avatar image mvader (Victron Energy) ♦♦ commented ·
Hi, See the blogpost, look for Node-RED. And see VRM Portal API
0 Likes 0 ·
kladz avatar image
kladz answered ·

Can't wait for having forcast solar @+24H

4 comments
2 |3000

Up to 8 attachments (including images) can be used with a maximum of 190.8 MiB each and 286.6 MiB total.

Peter avatar image Peter commented ·
In API there is a forecast for today and tomorrow.
0 Likes 0 ·
joshuadodds avatar image joshuadodds Peter commented ·
What is the endpoint for calling this data in the API ?
0 Likes 0 ·
joshuadodds avatar image joshuadodds Peter commented ·
thank you! type=forecast is what i was missing
0 Likes 0 ·
m5115 avatar image
m5115 answered ·

Hi,

I set location 3 days ago, the forecast is not working. The button is greyed out.

Thanks for your help

forecast.jpg


forecast.jpg (36.6 KiB)
6 comments
2 |3000

Up to 8 attachments (including images) can be used with a maximum of 190.8 MiB each and 286.6 MiB total.

mvader (Victron Energy) avatar image mvader (Victron Energy) ♦♦ commented ·
Hi, thank you for the report. We today found a bug that affected new enabled sites; its fixed; please if you don't see any data by tomorrow then ring the alarm bell again.


Have a good day!

0 Likes 0 ·
m5115 avatar image m5115 mvader (Victron Energy) ♦♦ commented ·

not working today either

solar-forecast.png


0 Likes 0 ·
solar-forecast.png (52.8 KiB)
mvader (Victron Energy) avatar image mvader (Victron Energy) ♦♦ m5115 commented ·
Hi @m5115 - and does it work now? Or still not?
0 Likes 0 ·
m5115 avatar image m5115 mvader (Victron Energy) ♦♦ commented ·

yes, I activated the VRM bidirectional communication, then it worked.

see also the parallel thread

https://community.victronenergy.com/questions/215684/early-preview-of-new-vrm-solar-production-forecast.html?childToView=221091#answer-221091


0 Likes 0 ·
mvader (Victron Energy) avatar image mvader (Victron Energy) ♦♦ m5115 commented ·
thanks - fixed since that was a bug. Its now no longer necessary to enable two way comms in order to get the solar forecasting to work.
0 Likes 0 ·
gainestr avatar image gainestr mvader (Victron Energy) ♦♦ commented ·

I can confirm that production forecast works again now without 2-way comms being active. Thank you!

I know that consumption forecast is still being worked on so it’s pointless to bring up any issues with it on this thread, so I won’t. ;-)

1 Like 1 ·
gainestr avatar image
gainestr answered ·

My forecast for today has been missing from the portal for several days now. It was working just fine. My location setting is correct. Forecast for tomorrow is working.

8 comments
2 |3000

Up to 8 attachments (including images) can be used with a maximum of 190.8 MiB each and 286.6 MiB total.

mvader (Victron Energy) avatar image mvader (Victron Energy) ♦♦ commented ·

Hi, thank you for the report. We today found a bug that affected new enabled sites; its fixed; please if you don't see any data by tomorrow then ring the alarm bell again.


Have a good day!

1 Like 1 ·
gainestr avatar image gainestr commented ·

Forecast graph is still not showing forecast for today on either the beta or standard VRM site

0 Likes 0 ·
img-2772.png (317.0 KiB)
m5115 avatar image m5115 gainestr commented ·
Same here, after the bug fix I can now see a number in the solar forecast, but the forecast graph remains broken.
1 Like 1 ·
mvader (Victron Energy) avatar image mvader (Victron Energy) ♦♦ m5115 commented ·
Hi both, noted; is being looked into
0 Likes 0 ·
gainestr avatar image gainestr mvader (Victron Energy) ♦♦ commented ·

I have discovered that if I turn on “VRM two-way communication“ in the Remote Console, then the forecast will show up in the graph the next time the system updates. Hope this helps in the discovery process.

Turning off the option results in the forecast disappearing again but not immediately. Only after I change my graph view and then go back to today view. Or it also disappears by simply refreshing the page in my browser. I’m guessing some type of issue with a portal ID cache/buffer??

EDIT: I may have discovered that it has something to do with login process and not having “Stay signed-in“ enabled. So it does appear to be a browser cache issue with using safari on iOS devices possibly.

0 Likes 0 ·
m5115 avatar image m5115 gainestr commented ·
Excellent! Turning on two-way communication solved the forecast for me too.
0 Likes 0 ·
mvader (Victron Energy) avatar image mvader (Victron Energy) ♦♦ m5115 commented ·
Hi both, thanks for that: when looking into this, the developers actually found a bug. Which is now solved - no more need to enable two way comms for the solar forecast to work.
0 Likes 0 ·
gainestr avatar image gainestr mvader (Victron Energy) ♦♦ commented ·

I can confirm that production forecast works again now without 2-way comms being active. Thank you!

I know that consumption forecast is still being worked on so it’s pointless to bring up any issues with it on this thread, so I won’t. Especially the fact that the consumption forecast also disappears. ;-)

0 Likes 0 ·
kladz avatar image
kladz answered ·

Hello, personally I don't like the new pastel colors of the dashboard tiles at all

2 |3000

Up to 8 attachments (including images) can be used with a maximum of 190.8 MiB each and 286.6 MiB total.

Peter avatar image
Peter answered ·

Comparison from my program GbbVictronWeb.gbbsoft.pl: "VRM forecast versus Real" and "Solcast forecast versus Real" on my location. "Corrected" is corrected forecast based on average hour different from last 28 days.


1691318781987.png


1691318781987.png (33.2 KiB)
2 comments
2 |3000

Up to 8 attachments (including images) can be used with a maximum of 190.8 MiB each and 286.6 MiB total.

Kaj Lehtinen avatar image Kaj Lehtinen commented ·
Hi!

Just so that I read the table correct - what you are saying is that VRM forecasts are more correct than Solcast forecasts in the dataset you based that on?

Will you SaaS service produce the same report for me (comparison between Solcast & VRM on historic data) if I hook up my system to your Saas? If so - Do I need to be connected for 28 days or will your system fetch history from both sources on day one?


/Kaj

0 Likes 0 ·
Peter avatar image Peter Kaj Lehtinen commented ·
For me Solcast (after simple "average % per hour" correction) is little more correct then VRM. To produce this report, I have 2 accounts (can be two "Plants"): one compare my PV with Solcast, second compare my PV with VRM. You need to be connected for 28 days, because this is "forecast" and program can only download forecast for "today" (and 7 next days) - everyday. There are people who use this program only for statistic and profit calculation.
0 Likes 0 ·
ojack avatar image
ojack answered ·

Hello,

nice update for solar production forecast!! (in Beta Mode)

But today it's quite inaccurate. If i look out of the window my own forecast for the rest of the day is continuously raining and 0 sun hours. So it will be very hard to get the missing 49.7 kWh.screenshot-2023-08-17-160504.jpg


1 comment
2 |3000

Up to 8 attachments (including images) can be used with a maximum of 190.8 MiB each and 286.6 MiB total.

ojack avatar image ojack commented ·
And also the consumption forecast for today is not correct. We have 8 hours left with 0.5 kWh consumption each. So this should be at least 4kWh until the end of the day and not 12 kWh as it is displayed.
0 Likes 0 ·
oxident avatar image
oxident answered ·

Great feature!

Unfortunately, I'm forced to use a "fake" PV inverter in order to "map" my 3rd party ESS (Senec) into VRM. Therefore, the predicted value are wrong for me.

It would be great if Victron could do something to allow other kind of ESS to be integrated in order to avoid this problem. Maybe invent a new kind of device class on dbus?

1 comment
2 |3000

Up to 8 attachments (including images) can be used with a maximum of 190.8 MiB each and 286.6 MiB total.

mr-manuel avatar image mr-manuel commented ·
What fake PV inverter do you use? It has to send energy forwarded values to get this working. Eventually check dbus-mqtt-pv: https://github.com/mr-manuel/venus-os_dbus-mqtt-pv
0 Likes 0 ·
Mark Maritz avatar image
Mark Maritz answered ·

VRM date range doesn't seem to be saving

I used to set a range and that was saved until I changed it. It now resets each time I reload the page.

2 |3000

Up to 8 attachments (including images) can be used with a maximum of 190.8 MiB each and 286.6 MiB total.

F Schaumann avatar image
F Schaumann answered ·

So, how long does it take for the forecast to become active? I added the geo-data for the installation almost 2 days ago and the system still says "collecting data" when I click on the forecast button in the VRM portal.

1 comment
2 |3000

Up to 8 attachments (including images) can be used with a maximum of 190.8 MiB each and 286.6 MiB total.

Hi @Phrixotrichus

It takes 48 hours for the initial forecast to become active, and then will continue to calibrate over a rolling 28 day window.

0 Likes 0 ·
damionjr avatar image
damionjr answered ·

Hello @Guy Stewart (Victron Community Manager) ,

I had been enjoying the forecast feature for the past month or so And found that, over time, it became more and more accurate.

Unfortunately, it stopped working about a week ago, and I can’t find the issue.

My installation and VRM profile have been active for the last two years. I have followed all the instruction issued in the last release notes.

Is there anything else you can suggest i look into? Venus OS firmware is the only firmware I haven’t updated. I am currently running 3.0, as each attempt to install the last two updates resulted in NODE-RED issues, with a rollback to 3.0 being the only solution that works.

Irradence logging is active, two communication is on.

22 comments
2 |3000

Up to 8 attachments (including images) can be used with a maximum of 190.8 MiB each and 286.6 MiB total.

kocki avatar image kocki commented ·

Hello @Guy Stewart (Victron Community Manager),

it's the same on my installation.

I deleted my installation and registered it again more than 72 hours ago, but it's not showing the forecast on the dashboard window:

04.jpg05.jpg

Interestingly I see the forcast in the Solar Irradiance widget on the advanced tab:

06.jpg

Please, can you help?

Regards, Gerd

0 Likes 0 ·
04.jpg (27.1 KiB)
05.jpg (38.9 KiB)
06.jpg (26.5 KiB)
Hi @Damionjr @kocki ,

Both of your systems have recently changed location. The solar forecast is reset each time the location changes, so is not available for mobile systems.


0 Likes 0 ·
damionjr avatar image damionjr Guy Stewart (Victron Community Manager) ♦♦ commented ·
Thanks @Guy Stewart (Victron Community Manager) but it was working perfectly until recently. Nothing has changed on my end.

Is there no other solution other than removing the gps?

0 Likes 0 ·
Guy Stewart (Victron Community Manager) avatar image Guy Stewart (Victron Community Manager) ♦♦ damionjr commented ·
The developers are considering how the situation can be improved for mobile users, it's not an obvious solution.


It was changed recently because people who were moving were getting inaccurate results because it is location dependant, so it was decided that when an installation moves that we should reset the estimate data.

1 Like 1 ·
kocki avatar image kocki Guy Stewart (Victron Community Manager) ♦♦ commented ·

Thanks @Guy Stewart (Victron Community Manager) but why can I see the correct values in the Solar Irradiance widget in the avanced tab?

12.jpg

0 Likes 0 ·
12.jpg (19.5 KiB)
That data is available in real time based on your location.


It is only one of the factors that is used as an input to calculate your estimated solar production (which requires more time and data than just the irradiance forecast).

0 Likes 0 ·
Hi @Damionjr & @kocki,

I'll look into what might be the issue.

0 Likes 0 ·
kocki avatar image kocki Guy Stewart (Victron Community Manager) ♦♦ commented ·

Hello @Guy Stewart (Victron Community Manager) & @Damionjr,

great, thanks.

Perhaps it will be helpful for you to know that I'm using GPS mouse.

If you need more infos, please tell us.

Regards,

Gerd

1 Like 1 ·
damionjr avatar image damionjr kocki commented ·
Thank you @Guy Stewart (Victron Community Manager) and @kocki,


I am also using a GPS mouse and happy to share my installation if that helps.

Damion

0 Likes 0 ·
damionjr avatar image damionjr Guy Stewart (Victron Community Manager) ♦♦ commented ·

@Guy Stewart (Victron Community Manager)


Another observation is that I can see forecast data on the iPhone VRM widget just not when viewing the VRM portal.

0 Likes 0 ·
img-6172.png (1.8 MiB)
kocki avatar image kocki damionjr commented ·

@Guy Stewart (Victron Community Manager)
Can we get this nice VRM widgets also for Android users?

1 Like 1 ·
gloitom avatar image gloitom kocki commented ·

I have exact the same widget on android.

You have to expand the status widget, after placing it on the screen.

0 Likes 0 ·
kocki avatar image kocki Guy Stewart (Victron Community Manager) ♦♦ commented ·

Good morning

@Guy Stewart (Victron Community Manager)
& @Damionjr,

This morning I noticed the menu item Diagnostics, maybe it's new or I didn't noticed it until now:

07.jpg

Is it helpful for you to send it to you?

I don't want to post it here, because the Diagnostics data includes private data like serial numbers.

Regards,

Gerd

0 Likes 0 ·
07.jpg (18.1 KiB)
kocki avatar image kocki kocki commented ·

Perhaps also interested, the installation of my neighbor without GPS mouse but the same manual location settings works fine:

08.jpg

0 Likes 0 ·
08.jpg (68.6 KiB)
damionjr avatar image damionjr kocki commented ·
@kocki thats exactly how mine looked only a week ago! The mouse has been plugged in for months
1 Like 1 ·
kocki avatar image kocki damionjr commented ·

Perhaps small location differences via the GPS mouse will detect a new location and permanently restarts the "Collecting solar irradiance data for forecast" from new?

Maybe I don't know.

0 Likes 0 ·
That is exactly what is happening @kocki,

The developers are looking if this can be improved for minor changes.

1 Like 1 ·
kocki avatar image kocki Guy Stewart (Victron Community Manager) ♦♦ commented ·

Great, perhaps they can put a virtual circle from e.g. 1 km around the GPS location, similar to geofence.

But why was it working for @Damionjr until +/- 1 week ago? Did the developers change something?

0 Likes 0 ·

Yes, it was changed as old inaccurate solar production estimates were being shown for systems that had changed location.

https://www.victronenergy.com/live/vrm_portal:change_log

-1 Like -1 ·
kocki avatar image kocki kocki commented ·

Now Diagnostics is gone again, why?09.jpg

0 Likes 0 ·
09.jpg (16.6 KiB)

The diagnostics page link appearing in the navigation bar was a bug that has now been fixed.

If you still want to see the diagnostics info, you can by adding the /diagnostics as a suffix to the URL of your site.

1 Like 1 ·
kocki avatar image kocki Guy Stewart (Victron Community Manager) ♦♦ commented ·
Hello Guy,

for me it wasn't a bug, it was a feature.

Regards,

Gerd

0 Likes 0 ·
kocki avatar image
kocki answered ·

@Damionjr,

what a nice VRM widget on your iPhone, I don't have it on my Android, I miss it.

7 comments
2 |3000

Up to 8 attachments (including images) can be used with a maximum of 190.8 MiB each and 286.6 MiB total.

Kaj Lehtinen avatar image Kaj Lehtinen commented ·
It should be available on Android as well, I have it on my Samsung galaxy running Android 13.
1 Like 1 ·
kocki avatar image kocki Kaj Lehtinen commented ·

On my Samsung Galaxy S10+ I only have these 8 widgets:

screenshot-20231120-122559-nova7.jpg

screenshot-20231120-122702-nova7.jpg

screenshot-20231120-122731-nova7.jpg

screenshot-20231120-122752-nova7.jpg

None of these 8 widgets are so nice like the widget on IOS.

@Kaj Lehtinen: Do you have more or other widgets on Android 13?

Regards,

Gerd


0 Likes 0 ·
semlohnhoj avatar image semlohnhoj kocki commented ·

When you add them to your screen you need to stretch them out so they are larger. They then show the extra information.

When first added:

screenshot-20231120-125000-one-ui-home.jpg


After enlarging:

screenshot-20231120-125016-one-ui-home.jpg

1 Like 1 ·

Hi @kocki,

The procedure to see the full range of vrm app widgets on android is a little bit different to iOS.

Once you add the widget, it should be possible to 'expand' it to show more information.

Here is a video to demonstrate:

0 Likes 0 ·
kocki avatar image kocki Guy Stewart (Victron Community Manager) ♦♦ commented ·

Hi @Guy Stewart (Victron Community Manager),

You are Great!!!, Thanks, it works:

screenshot-20231120-132705-nova7.jpg

I attached my GPS mouse +/- 2 days ago, so I don't see the solar forcast in the moment in the Windows App.
But I see the solar forecast on the Android widget, how can it be?

Regards,

Gerd

1 Like 1 ·
Regarding the forecast in the app; think of it like a feature not a bug :)


The info required is still there under the covers (and then available via the API), but we hide it when we know (or think that we know) it is more likely to be inaccurate. This logic of when to hide and when to show that applies to the dashboard hasn't been applied to the phone app widgets, and might not be, unless enough people are complaining about it.

1 Like 1 ·
kocki avatar image kocki Guy Stewart (Victron Community Manager) ♦♦ commented ·

Hi @Guy Stewart (Victron Community Manager),

I like your features !!!, Thanks.
And for me it is accurate.

0 Likes 0 ·
Peter avatar image
Peter answered ·

/Diagnostic has wrong sort order! (no sort order but should by by date/time descending)

1 comment
2 |3000

Up to 8 attachments (including images) can be used with a maximum of 190.8 MiB each and 286.6 MiB total.

kocki avatar image kocki commented ·

It's grouped by device, for me it's better than sorted by date/time descending.

Best would be to select the sort order individually like in other apps.

0 Likes 0 ·
diederik avatar image
diederik answered ·

I'm testing this so maybe I can use it at home. However, I have no idea how the forecast is calculated.

Yesterday the prediction was 14.40KWh. At the end of the day I had 22.5KW.

Today the prediction was 13.7KWh, but it looks like I will never reach this.

Is it just sunrise-sunset or does it really take the weather into account?

solar-yield-forecast.png


2 |3000

Up to 8 attachments (including images) can be used with a maximum of 190.8 MiB each and 286.6 MiB total.