It would be really nice if Victron could add the totals (kWh) on the consumption graph in addition to the percentage of each source for each time period.
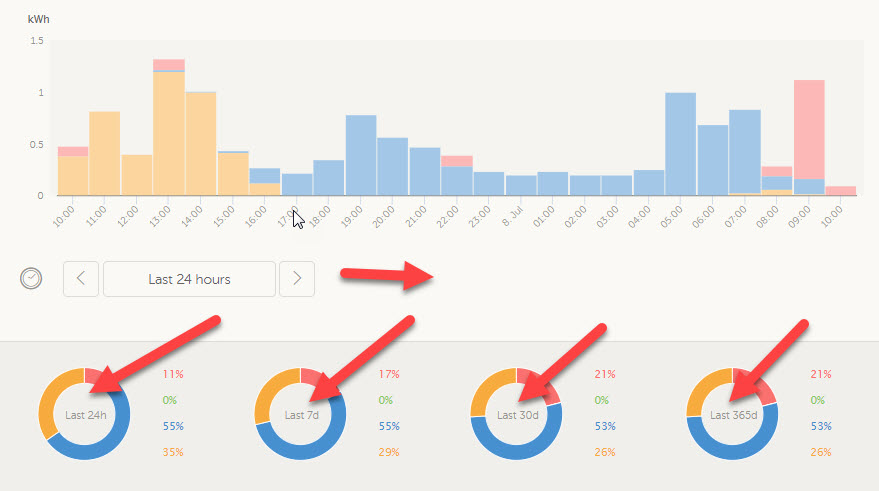
It would be really nice if Victron could add the totals (kWh) on the consumption graph in addition to the percentage of each source for each time period.
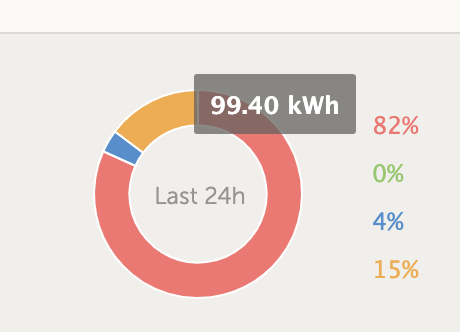
@AdrianC Totally agree! I just released a build that adds a tooltip to these charts with the total kWh. Just hover the pie chart to see it in action. Thanks for the suggestion!
Thank you Teun, that is fantastic!
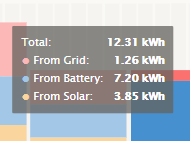
One more suggestion... I think it will read easier plus show the total for all sources if displayed as you have it on the graph (see image below). Would this be possible?