It makes reading/comparing difficult when the y-axis of the SOC graph goes above 100% - sometimes to 180%. Its not necessary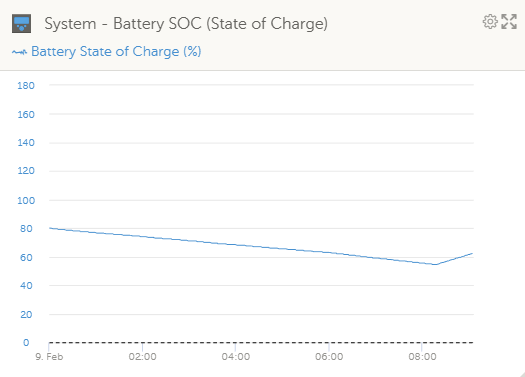
asked
Can you limit the SOC graph to max 100% on the y-axis?
Hi @Stuart Bell
Yeh, that's a weird example. But the VRM devs have concentrated their improvement efforts into giving us Custom Widgets. So you can set up your own. This is one I did for myself..
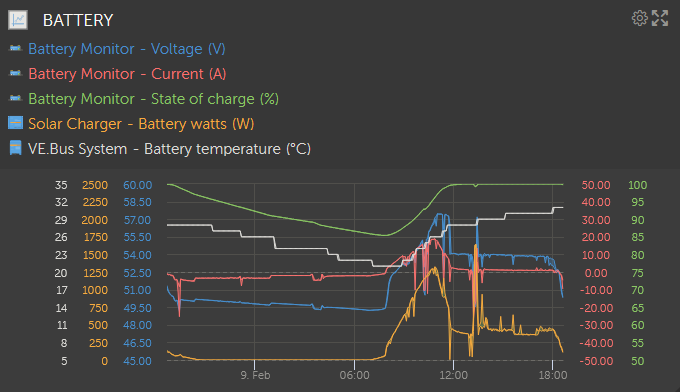
The trick with multiple traces is to avoid multiple scale lines and the figures split into weird gradations. Give it a try, you'll get the hang of it.
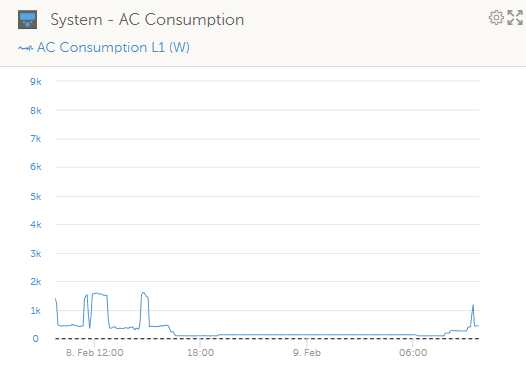
Hi - thanks for the suggestion... may have to go that route as I also get odd ones like this - again makes it hard sometimes to see the detail you need!
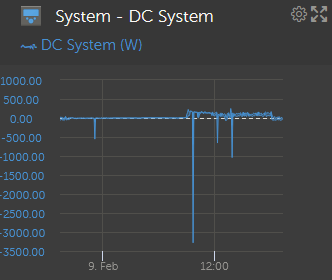
Yeh, there's other 'impractical' stuff too. Like DC System, which is the result of a calculation of values sampled at slightly different times. So you get this, when my actual DC loads would rarely exceed 500W. Nor do I need to see a Watt scale showing 2 decimal places..